In brief
- Bitcoin is bouncing in the new year, giving hope to crypto bulls.
- BTC is now trading above its average price over the last 200 days, a trend not seen since October.
- Bitcoin could now be poised to exit the dreaded “death cross” formation, a bearish pattern that formed in November.
The new year has started off with a bang—and one that initially had nothing to do with crypto. When U.S. Delta Force operators dragged Venezuelan President Nicolás Maduro out of his fortified compound in Caracas on January 3, financial markets erupted into chaos. Gold surged above $4,400 per ounce, the S&P 500 rallied on tech momentum, and Bitcoin—after spending weeks trapped in a suffocating range—finally broke free.
Today’s price action shows BTC trading at $93,958, up 2.69% on the day. But it’s not the percentage gain that matters here. It’s where that price sits: above the 200-day exponential moving average for the first time since October. If the trend persists, Bitcoin could break free from the “death cross” formation it painted on charts back in November.
That’s a big deal for traders who’ve been watching Bitcoin struggle through what was supposed to be a triumphant year under a crypto-friendly Donald Trump administration.
Despite a pretty bullish first semester last year, Bitcoin ended up with a negative 6% performance in 2025. After a 125% rally in 2024 that sent BTC screaming past $100K, the market sold the news once Trump actually took office. All those policy changes and regulatory shifts were already priced in by the end of 2024, and 2025 ended up being the usual “buy the rumor, sell the news” scenario that left crypto investors nursing losses while gold and silver posted their best years since 1979.
Traditional safe havens have been crushing it while Bitcoin—the supposed “digital gold”—has struggled to hold $90K. The geopolitical backdrop has provided markets with a mixed bag. With Maduro now detained at the Metropolitan Detention Center in Brooklyn, oil markets are in FUD mode, and investors are piling into anything that looks like a hedge against chaos.
But here’s the thing about chaos: it cuts both ways. The same geopolitical uncertainty that’s driving institutional money into gold is also reminding crypto natives why Bitcoin was invented in the first place. When governments can capture sitting heads of state in midnight raids and declare they’ll “run” entire countries, suddenly the idea of an asset that governments can’t easily seize or control starts looking pretty attractive again.
Bitcoin (BTC) price: The squeeze finally breaks
Bitcoin had been coiling tighter and tighter for weeks, trading in a narrow band between $85,000 and $90,000. Today, it gave in to the upside, starting the week at $91,498 and spiking to its current price of $93,925 with no upside wicks. Today’s candlestick is strong, all body no wicks, decisively breaking its most important resistance.
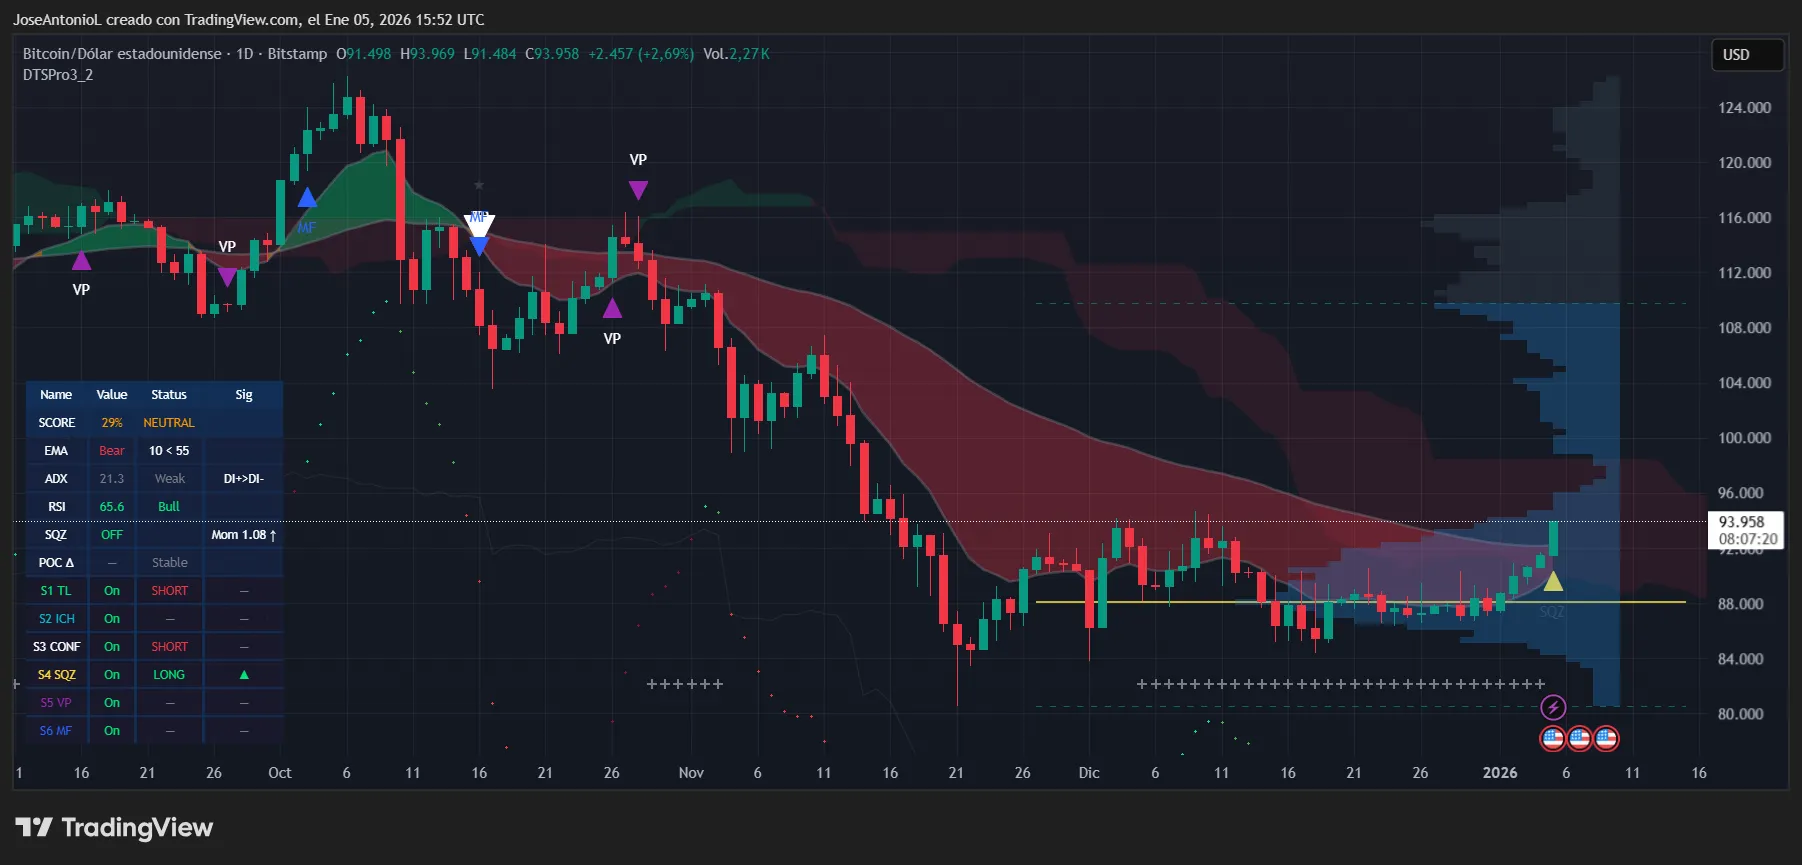
Bitcoin (BTC) price data. Image: Tradingview
For the first time since October, Bitcoin is trading above the 200-day exponential moving average. That’s the line that separates longer-term bullish structure from bearish drift. When you’re above it, you’re technically in “uptrend” territory. When you’re below it, you’re fighting gravity. The market has been fighting gravity for months. Today’s the first day since then that it’s not.
Exponential moving averages, or EMAs, help traders identify trend direction by tracking the average price of an asset over the short, medium, and long term. And here’s the rub: Bitcoin’s EMA configuration is still bearish.
When the short-term 50-day EMA falls below the longer-term 200-day EMA, it means bears are in control and the longer-term bull market structure has been broken. That’s known as a death cross formation among traders, and Bitcoin has been in one since mid-November.
For what it’s worth, though, common technical indicators that traders tend to rely on may provide some optimism: The Average Directional Index, or ADX, sits at 21.3 showing that the current down trend is weaker now. ADX measures trend strength regardless of direction, and readings below 25 typically signal choppy, directionless action where false breakouts are common.
The Relative Strength Index, or RSI, measures market momentum on scale from 0 to 100, with readings below 30 signalling oversold and above 70 suggesting overbought. At 65.6, Bitcoin is showing buying momentum without being overbought. At the moment, Bitcoin is in that sweet spot where momentum is building but hasn’t yet reached exhaustion levels that typically trigger profit-taking.
So what does all this technical jargon actually mean for your portfolio?
It means we’re at an inflection point. The compression that built up over the last few weeks has resolved to the upside. The 200-day moving average has been reclaimed. If—and this is a big if—the market can string together a few daily closes above $95,000 with rising ADX, then Bitcoin could escape its death cross formation and set up what’s known as a “golden cross.”
That’s when the 50-day EMA crosses above the 200-day, a pattern that traders view as a major bullish signal for sustained uptrends.
Disclaimer
The views and opinions expressed by the author are for informational purposes only and do not constitute financial, investment, or other advice.
Disclaimer: The information on this page may come from third parties and does not represent the views or opinions of Gate. The content displayed on this page is for reference only and does not constitute any financial, investment, or legal advice. Gate does not guarantee the accuracy or completeness of the information and shall not be liable for any losses arising from the use of this information. Virtual asset investments carry high risks and are subject to significant price volatility. You may lose all of your invested principal. Please fully understand the relevant risks and make prudent decisions based on your own financial situation and risk tolerance. For details, please refer to
Disclaimer.
Related Articles
Famed trader “Maji” ends 13 straight wins, closing a Bitcoin long position at a loss of $192k
Gate News, April 12. Lookonchain monitoring shows that the well-known trader “Maji” saw their 13-win streak come to an end. Due to the market downturn, they just closed a Bitcoin long position, incurring a loss of about $192k.
GateNews7m ago
BTC 15-minute drop of 1.75%: Derivatives liquidity deterioration and capital withdrawals in sync weigh on prices
From 01:30 to 01:45 (UTC) on 2026-04-12, the BTC price saw significant volatility within the 71,560.0–73,017.1 USDT range. The candlestick return rate recorded -1.75%, and the amplitude reached 2.00%. During this period, market attention increased, the trading atmosphere clearly became more cautious, and heightened volatility triggered short-term capital vigilance.
The primary driving force behind this unusual move is the continued deterioration of liquidity in the derivatives market: CME futures open interest fell to a 14-month low, and institutional arbitrage capital accelerated its withdrawal. Futures trading volume trended lower over the long run, and arbitrage basis compression caused the market to deepen in…
GateNews47m ago
Morgan Stanley is considering launching tokenized money market funds, exploring crypto asset tax and lending services
Morgan Stanley’s head of digital asset strategy, Amy Oldenburg, said the firm will treat tokenized money market funds as a future direction, while also considering tax-loss harvesting services and Bitcoin-related products. The firm has filed ETF applications for Ethereum and Solana, and manages $9.3 trillion in client assets.
GateNews50m ago
Bitcoin ETFs Acquire 3,350 BTC in $240M Inflow
Spot ETFs tied to Bitcoin saw a significant inflow of $240 million, indicating strong institutional demand and reflecting a trend of consistent accumulation. With over 721,000 BTC held by ETFs, supply pressure is rising, fundamentally supporting Bitcoin's integration into traditional finance.
Coinfomania53m ago
Bitcoin dips below $72,000, down 0.92% over the past 24 hours
Gate News message: On April 12, market data showed that Bitcoin fell below $72,000, with a 24-hour drop of 0.92%.
GateNews53m ago
BTC 跌破 72000 USDT
Gate News bot 消息,Gate 行情显示,BTC 跌破 72000 USDT,现价 71993.6 USDT。
CryptoRadar55m ago
