
**Date: **Sun, Jan 04, 2026 | 01:14 PM GMT
As 2026 gets underway, the broader cryptocurrency market is showing renewed stability. Ethereum (ETH) is up nearly 6% on the week, and several major altcoins are beginning to regain momentum. Against this improving backdrop, Hyperliquid (HYPE) is quietly positioning itself as a potential late mover, with its chart structure starting to flash early bullish signals.
While HYPE remains mostly flat on the weekly timeframe, the more important story is unfolding beneath the surface. Recent price action suggests a meaningful structural shift may be underway — one that could mark the early stages of a bullish continuation if key levels are reclaimed.
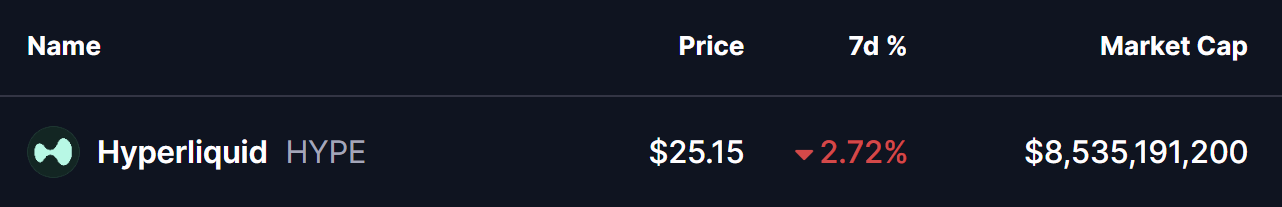
Source: Coinmarketcap
Rounding Bottom Pattern Taking Shape
On the daily timeframe, Hyperliquid appears to be forming a rounding bottom pattern, a classic bullish reversal structure that typically develops after a prolonged corrective phase. This pattern reflects a slow transition from aggressive selling to steady accumulation, as downside momentum fades and buyers gradually step back in.
The setup began after HYPE faced strong rejection near the $51.42–$50.06 neckline resistance zone, which triggered a sharp decline through late November and December. That downside move eventually found strong demand near the $22.20 support level, where selling pressure stalled. Multiple defenses of this area prevented further downside and helped establish a solid base for a potential trend reversal.
Since carving out that bottom, HYPE has started to curve higher in a smooth, rounded fashion — closely matching the textbook structure of a developing rounding bottom. The recent stabilization above the $25 region further supports the view that selling pressure is weakening and accumulation may be underway.
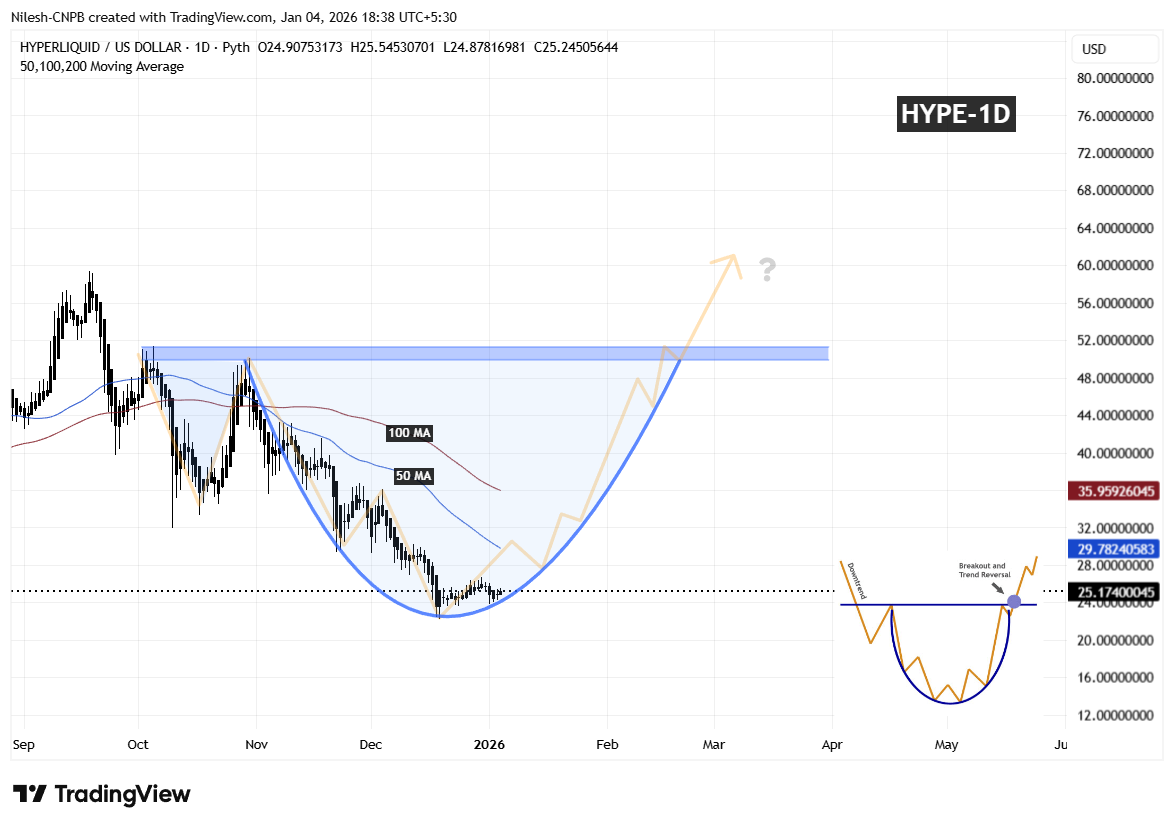
Hyperliquid (HYPE) Daily Chart/Coinsprobe (Source: Tradingview)
A key technical level now comes into play: the 50-day moving average, currently hovering near $29.78. This level has acted as dynamic resistance during the early recovery phase, and reclaiming it would mark an important shift in short-term market structure.
What’s Next for HYPE?
A sustained reclaim of the 50-day MA would be the first meaningful confirmation that buyers are regaining control after months of corrective price action. Holding above this level could allow price to build momentum toward the 100-day MA, which would further reinforce the developing reversal structure.
Looking ahead, the most important level remains the $51.42–$50.06 neckline resistance zone. A clean breakout above this area would validate the entire rounding bottom pattern and could open the door to a broader bullish expansion phase, with momentum traders likely re-entering the market.
In the near term, all eyes remain on the 50-day MA reclaim for upside confirmation. Until that happens, short-term consolidation or shallow pullbacks remain possible. However, as long as price continues to hold above the established base, the broader bottoming structure remains intact and constructive.
Disclaimer: The views and analysis presented in this article are for informational purposes only and reflect the author’s perspective, not financial advice. Technical patterns and indicators discussed are subject to market volatility and may or may not yield the anticipated results. Investors are advised to exercise caution, conduct independent research, and make decisions aligned with their individual risk tolerance.
About Author: Nilesh Hembade is the Founder and Lead Author of Coinsprobe, with over 5 years of experience in the cryptocurrency and blockchain industry. Since launching Coinsprobe in 2023, he has been providing daily, research-driven insights through in-depth market analysis, on-chain data, and technical research.
Disclaimer: The information on this page may come from third parties and does not represent the views or opinions of Gate. The content displayed on this page is for reference only and does not constitute any financial, investment, or legal advice. Gate does not guarantee the accuracy or completeness of the information and shall not be liable for any losses arising from the use of this information. Virtual asset investments carry high risks and are subject to significant price volatility. You may lose all of your invested principal. Please fully understand the relevant risks and make prudent decisions based on your own financial situation and risk tolerance. For details, please refer to
Disclaimer.
Related Articles
BTC edges up 0.46% in 15 minutes: institutional fund outflows and macro risk-off sentiment in sync drove the move
From 15:00 to 15:15 (UTC) on 2026-04-16, BTC logged a +0.46% return within 15 minutes. The price fluctuated in a range of 73,939.7 to 74,440.0 USDT, with an amplitude of 0.68%. During this time window, market attention increased, short-term volatility intensified, and fund-flow characteristics changed noticeably.
The main driver of this deviation is the continued outflow of large amounts of capital from exchanges. According to on-chain data, in the past 24 hours the net flow was -14,408.84 BTC, mainly concentrated in large transfer ranges of more than $1 million (especially>$10M net outflow -12,987.03 BTC). This shows that institutions and large holders actively reduced their BTC holdings on exchanges, and short-term selling pressure was significantly lowered. Against the backdrop of persistently weak liquidity, with order book depth remaining at a low level for a long time, the price has become more sensitive to medium-sized buy orders—amplifying the impact of even modest inflows on spot market price action.
In addition, macro conditions changed in parallel and produced a synchronized effect: easing geopolitical tensions in the Middle East boosted overall market sentiment. International gold prices rose, global equity markets hit new highs, and the market re-evaluated the probability of the Federal Reserve cutting rates within the year, further increasing investor attention to safe-haven assets (including BTC). At the same time, on-chain data indicates that the “whale” trading activity during this phase is at an annual low (>$1M transfers fell to 1,485 transactions). With heavy market wait-and-see sentiment and limited short-term supply, BTC’s responsiveness to sudden buy-side capital was further enhanced.
Investors should be reminded that current market liquidity is still fragile. Insufficient order book depth increases the market’s sensitivity to large capital movements, and short-term volatility may intensify. Going forward, focus on further shifts in on-chain large-fund flows, changes in price action as it breaks through support or resistance regions, and the risks and opportunities brought by related macro policies and geopolitical developments. Please continue to track key data and stay alert to any sudden shocks during the period of abnormal moves.
GateNews58m ago
XRP Rises 4% as Ripple Partnership and ETF Inflows Drive Recovery
XRP rose 4% to $1.41, boosted by Ripple's partnership with Kyobo Life and increasing institutional interest. Broader market gains and positive community engagement also contributed, though XRP remains 63% below its peak. Key support is at $1.38.
GateNews7h ago
ETH/BTC ratio rebounds—are institutional funds rotating? A deep dive into structural signals in the crypto market
BTC breaks through $75,000; the Iran–Israel ceasefire and fresh highs in U.S. stocks lift risk assets, but the options market remains somewhat cautious. The ETH/BTC ratio rebounds, signaling capital rotation.
GateInstantTrends9h ago
Crypto Market Rebounds 1.5% to $2.54T as Bitcoin Leads Rally Amid Tech Surge and Policy Progress
The crypto market rebounded 1.5% to $2.54 trillion, led by Bitcoin's 7% gain amid easing geopolitical tensions and strong ETF inflows. Analysts predict further gains if Bitcoin surpasses $76K resistance.
GateNews9h ago
Bitcoin bull market index rises to 40 points; Bloomberg: the U.S. and Iran are considering extending the ceasefire agreement by two weeks
Bitcoin’s price as of April 16 is approaching $74,700. The Bullish Sentiment Index (BSI) has risen to 40 points, indicating a rebound in market sentiment. The United States and Iran are evaluating options to extend the current ceasefire agreement, and they are also discussing navigation issues in the Strait of Hormuz, as diplomatic negotiations continue.
MarketWhisper15h ago
