
**Date: **Mon, Jan 05, 2026 | 05:26 AM GMT
As 2026 kicks off, the broader cryptocurrency market is showing renewed stability. Ethereum (ETH) is up nearly 4% on the week, and momentum is gradually spreading across major altcoins — including the decentralized exchange token Aster (ASTER).
While ASTER is also posting over 4% weekly gains, the more important story is unfolding beneath the surface. Recent price action suggests a meaningful structural shift may be developing — one that could mark the early stages of a bullish continuation if key technical levels are reclaimed.
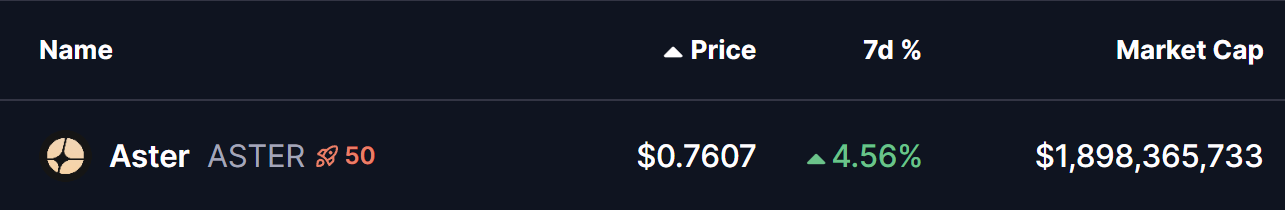
Source: Coinmarketcap
Rounding Bottom in Play
On the daily timeframe, **Aster **appears to be forming a rounding bottom pattern, a classic bullish reversal structure that typically develops after a prolonged corrective phase. This pattern reflects a gradual transition from aggressive selling to steady accumulation, as downside momentum fades and buyers slowly regain confidence.
The setup began after ASTER faced strong rejection near the $1.35–$1.40 neckline resistance zone, triggering a sharp decline through late November and December. That downside move eventually found strong demand near the $0.6546 support level, which has since acted as a critical base. Multiple defenses of this zone prevented further downside and helped establish a stable foundation for a potential trend reversal.
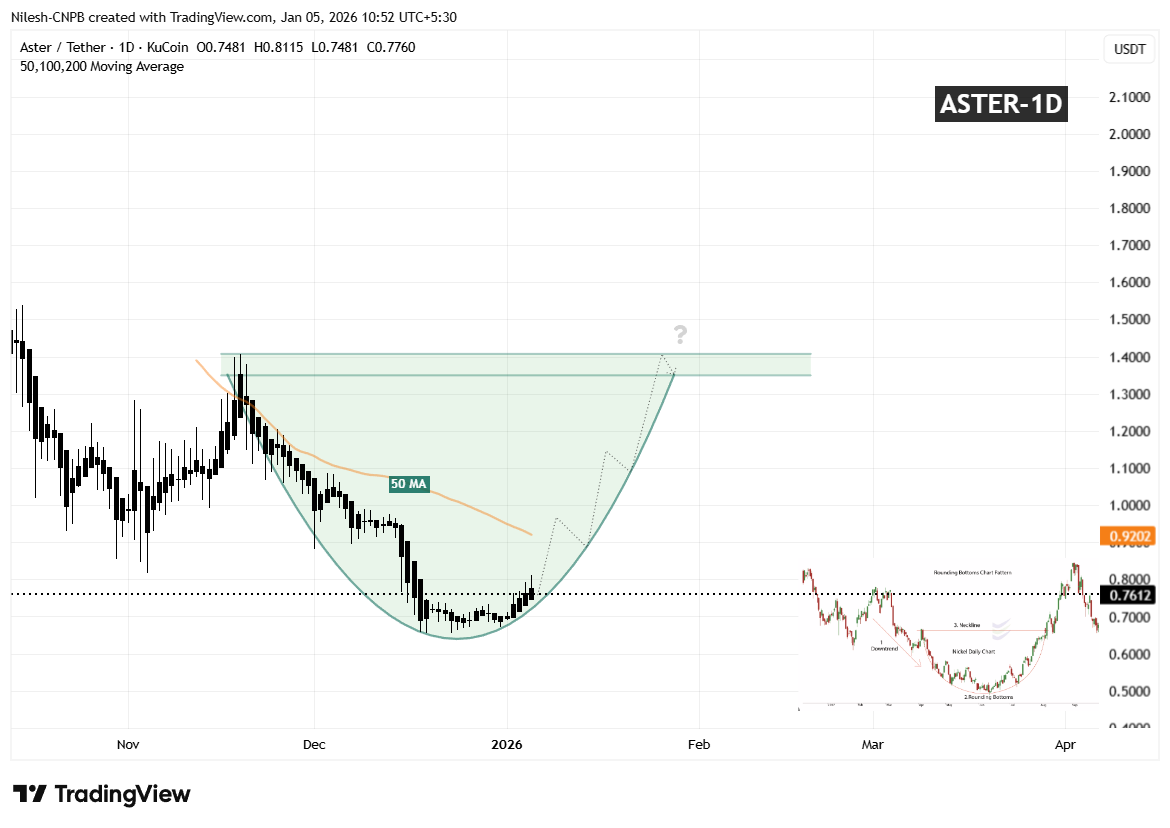
Aster (ASTER) Daily Chart/Coinsprobe (Source: Tradingview)
Since carving out that bottom, ASTER has started to curve higher in a smooth, rounded fashion — closely matching the textbook structure of a developing rounding bottom. The recent stabilization above the $0.76 region further supports the view that selling pressure is weakening and accumulation may be underway.
A key technical level now comes into focus: the 50-day moving average, currently hovering near $0.9202. This moving average has acted as dynamic resistance throughout the recovery phase, repeatedly capping upside attempts.
What’s Next for ASTER?
For the rounding bottom structure to gain confirmation, ASTER needs to reclaim the $0.9202 region and establish acceptance above the 50-day moving average. A sustained move above this zone would signal that buyers are regaining control after months of corrective price action.
Beyond that, the most significant technical barrier remains the $1.35–$1.40 neckline resistance. A clean and decisive breakout above this area would validate the entire reversal pattern and could open the door for a broader bullish expansion phase, with momentum traders and sidelined participants likely re-entering the market.
Until those levels are reclaimed, the pattern remains in development. Short-term consolidation or minor pullbacks remain possible if ASTER struggles near the 50-day MA. However, as long as price continues to form higher lows and holds above the established rounding base, the broader bottoming structure remains intact and constructive.
Disclaimer: The views and analysis presented in this article are for informational purposes only and reflect the author’s perspective, not financial advice. Technical patterns and indicators discussed are subject to market volatility and may or may not yield the anticipated results. Investors are advised to exercise caution, conduct independent research, and make decisions aligned with their individual risk tolerance.
About Author: Nilesh Hembade is the Founder and Lead Author of Coinsprobe, with over 5 years of experience in the cryptocurrency and blockchain industry. Since launching Coinsprobe in 2023, he has been providing daily, research-driven insights through in-depth market analysis, on-chain data, and technical research.
Disclaimer: The information on this page may come from third parties and does not represent the views or opinions of Gate. The content displayed on this page is for reference only and does not constitute any financial, investment, or legal advice. Gate does not guarantee the accuracy or completeness of the information and shall not be liable for any losses arising from the use of this information. Virtual asset investments carry high risks and are subject to significant price volatility. You may lose all of your invested principal. Please fully understand the relevant risks and make prudent decisions based on your own financial situation and risk tolerance. For details, please refer to
Disclaimer.
Related Articles
Michael Saylor: Bitcoin may have already hit bottom, but quantum risks have been exaggerated
Strategy Executive Chairman Michael Saylor believes Bitcoin hit its bottom around $60,000 this February, because all forced sellers in the market have already exited. He said that the catalyst for the next bull market will be a bitcoin-based banking credit system, while he believes the threat from quantum computing is being exaggerated, and he pointed out that the technical community has enough time to deal with this threat.
MarketWhisper26m ago
Glassnode: Is the Bitcoin rebound just a dead cat bounce? Where is the key pressure level?
Glassnode reports that although the Bitcoin price rebounded to $72k due to a U.S.-Iran ceasefire, the market structure is still in a bear market. In the short term, the downside may be limited, but the $78k level faces pressure overhead. ETF capital inflows have ticked up slightly, but they have not yet fully returned; trading activity in derivatives remains sluggish, indicating insufficient market confidence. Going forward, we need to monitor changes in the futures trading and options markets.
ChainNewsAbmedia57m ago
Why is Bitcoin down today? The Iran–Israel ceasefire is on the verge of collapse, and the Strait of Hormuz shuts down again
Bitcoin has recently been trading below $72,000 and faces risks from the failure of the U.S.-Iran ceasefire talks and the Strait of Hormuz closing again, which has weighed on market sentiment. At the same time, Federal Reserve meeting minutes show that the likelihood of further rate hikes is rising, further affecting the valuation of risk assets. Bitcoin’s key resistance level is $75,000 and its support level is $68,000; the market is currently waiting for a clear direction confirmation signal.
MarketWhisper1h ago
The Crypto Fear and Greed Index drops to 14, and the market remains in extreme fear
Gate News message, April 9, according to Alternative data, today’s Crypto Fear and Greed Index is 14 (yesterday was 17), and the market remains in extreme fear. The index ranges from 0-100 and provides a composite assessment of six indicators: volatility (25%), market trading volume (25%), social media buzz (15%), market surveys (15%), Bitcoin’s share of the entire market (10%), and Google trending topic analysis (10%).
GateNews2h ago
Optimism over the Iran-U.S. ceasefire helped drive a broad rebound in U.S. stocks, and Bitcoin rose to a three-week high.
The United States and Iran reached a two-week ceasefire agreement, and global financial markets turned optimistic, with the S&P 500 rising 2.51%. U.S. crude oil prices fell to below $95 per barrel, easing concerns about an energy crisis. Bitcoin at one point rose 5% to $72,841, hitting a three-week high. Expectations that the Federal Reserve will cut interest rates have also increased.
ChainNewsAbmedia2h ago
Bitcoin ETF attracts $470 million, setting a 6-week high! Analyst: “A breakout rally is brewing.”
U.S. spot Bitcoin ETF inflows hit a new six-week high on Monday, signaling a rebound in institutional investor confidence. Total net inflows of $471.3 million came mainly from institutions such as BlackRock and Fidelity. Even though market sentiment is gradually improving, broader macroeconomic and geopolitical risks could still affect Bitcoin’s upward momentum. Analysts said that sustained structural buying can support Bitcoin, but future price action will still need to be monitored for changes in external factors.
区块客2h ago
