
Cardano is kicking off 2026 with some renewed energy, and the chart is making one thing very clear. ADA is right back at the level that’s been holding it down for weeks.
As Sssebi put it, ADA “wants to fly” as it presses into the $0.40 zone, and that’s not hype, it’s just what the ADA chart is showing.
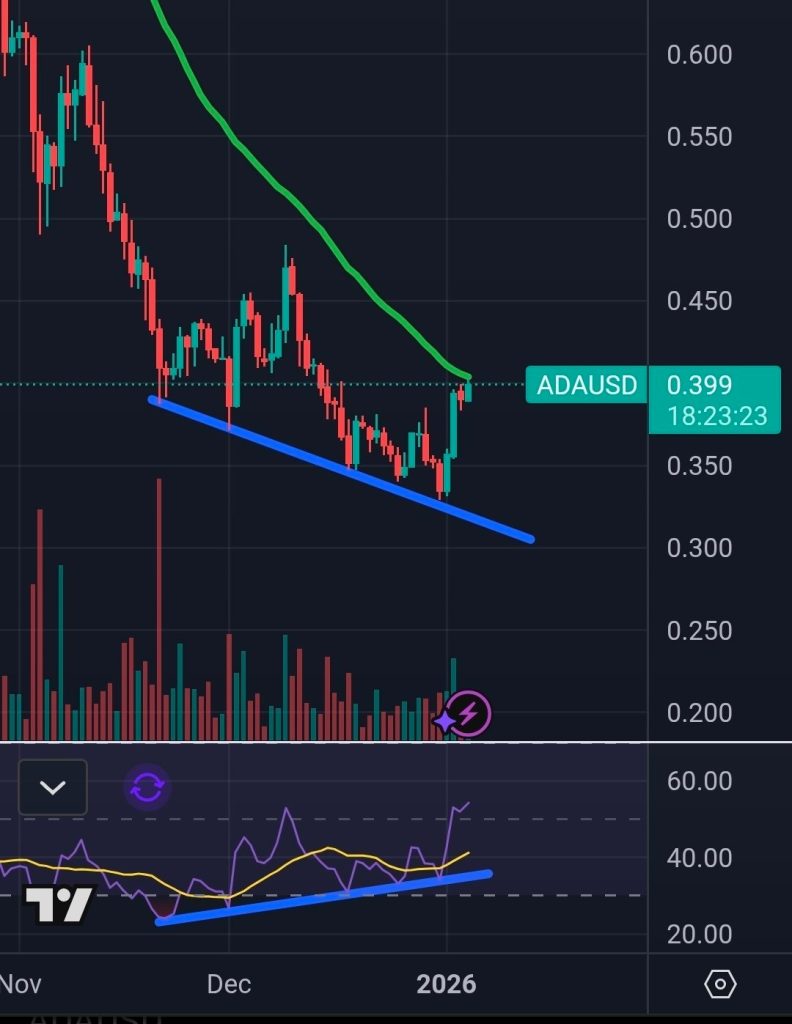
The ADA price is hovering around the area of $0.399 following the remarkable recovery. Now, it seems like the market is reaching a crossroads in terms of what might happen next.
- What the ADA Chart Is Really Saying
- RSI Is Helping the Bullish Case, But Proof Still Matters
- What’s Next for ADA?
What the ADA Chart Is Really Saying
The first thing that stands out is the pressure from above. That downward-sloping green line has acted as a lid on price, stopping multiple rally attempts. Right now, ADA is testing that trendline at the same time it’s testing horizontal resistance near $0.40, which makes this area especially important.
Source: X/@Sssebi
Below the price, the blue trendline tells another part of the story. The ADA price kept making lower lows during the pullback, but that support line held firm. When the price bounced, it did so quickly, which usually signals that sellers were running out of steam near the lows.
This is the kind of setup where the market compresses, finds a floor, and then sends price straight back into resistance to see who’s really in control.
AI Ranks LINK and SOL as Top 2026 Bets, Flags ADA as a Risk_**
RSI Is Helping the Bullish Case, But Proof Still Matters
Momentum indicators are starting to lean in favor of the bulls. On the RSI, the price was drifting lower into late December, but RSI was quietly making higher lows.
That bullish divergence often shows up when selling pressure is fading, even if the price hasn’t flipped direction yet.
Now RSI is rising along with price, which supports the idea that this bounce has some substance. Still, divergence alone isn’t enough. ADA needs to actually break and hold resistance to turn momentum into a trend.
What’s Next for ADA?
Everything revolves around $0.40. A bright breakout past that point and a hold would be a strong move. The levels to watch after that would be around the $0.45 mark, with the large psychological level at $0.50 following.
As long as 0.40 acts as a resistance level, attention turns once again to support. The first area to watch is around $0.37, followed by $0.35. Below that, the low $0.30s remain the deeper support zone that buyers don’t want to see tested again.
For now, the ADA price is doing what it needs to do. The bounce looks strong, RSI supports the move, and the price is pressing into the exact level that can change the tone of the chart.
What happens around $0.40 over the next few candles should tell the story of whether this move has real legs or needs more time to develop.
Disclaimer: The information on this page may come from third parties and does not represent the views or opinions of Gate. The content displayed on this page is for reference only and does not constitute any financial, investment, or legal advice. Gate does not guarantee the accuracy or completeness of the information and shall not be liable for any losses arising from the use of this information. Virtual asset investments carry high risks and are subject to significant price volatility. You may lose all of your invested principal. Please fully understand the relevant risks and make prudent decisions based on your own financial situation and risk tolerance. For details, please refer to
Disclaimer.
Related Articles
Crypto Market Records Dip While Sentiment Remains Neutral
The global crypto market is undergoing a correction, with a 0.86% drop in total capitalization to $2.41T. Bitcoin and Ethereum fell by 1.21% and 1.33%, respectively. Despite declines in DeFi TVL and NFT sales, some altcoins surged significantly.
BlockChainReporter37m ago
William Blair: After a certain CEX callback, risk is released, and prospects are boosted by USDC growth
Investment bank William Blair said that after a decline in its stock price in the first quarter, a certain CEX has already completed risk clearing, and the market has fully priced in expectations of weak trading volume and revenue. Although the trading data is soft, the impact is limited; the exchange has strengthened its competitiveness through a diversified layout. The stablecoin USDC continues to grow, raising its market share and generating synergistic benefits. Institutional investors are bullish on a market recovery and believe the exchange has upside potential.
GateNews50m ago
BTC 15-minute rise 0.48%: stronger spot buy-side demand combined with shrinking liquidity driving the move
2026-04-13 14:30 to 2026-04-13 14:45 (UTC), BTC saw a +0.48% return within a 0.55% amplitude range (71600.7–71997.0 USDT). During this period, market volatility increased; both spot and on-chain data indicate that short-term capital flows were notably active, market attention rose, and sentiment remains cautious.
The main driver behind this deviation is stronger spot-market buy pressure and the continued net outflow of exchange funds. Specifically, over the past 24 hours, BTC spot trading volume was about $33.15B, compared with the 7-day average
GateNews2h ago
Bitmine gets promoted to the NYSE main board! Tom Lee: US stocks may be at their bottom, and selling pressure on Ether could ease
Bitmine has officially transferred from the NYSE American board to the main board in the United States, marking an important milestone for the company. Despite a significant drop in its share price, it has still increased the share repurchase plan amount to $4.0 billion. The company holds a large amount of Ether, and it expects that a rebound in the crypto market will help improve its assets and share price performance.
CryptoCity2h ago
Gold and silver fall across the board, and the BTC/ETH volatility index rises slightly
On April 13, gold and silver prices fell to $4,732.92 per ounce and $74.209 per ounce, respectively. The BTC volatility index rose by 0.42%, and the ETH volatility index rose by 0.31%. The U.S. dollar versus the Chinese yuan and the Japanese yen edged up slightly, major European stock indexes generally fell, while WTI and Brent crude oil prices rose. The Gate platform supports trading for multiple asset types.
GateNews2h ago
ETH 15-minute rise of 1.24%: On-chain capital outflows and macro risk aversion converge to boost volatility
From 2026-04-13 13:45 to 14:00 (UTC), ETH surged rapidly within a 1.48% amplitude. The price ranged from 2182.61 to 2214.98 USDT, and the return rate in 15 minutes reached +1.24%. This bout of unusual activity has drawn market attention, with active capital inflows and outflows, a marked increase in volatility, and a short-term warming of trading sentiment.
The main driver behind this unusual activity is on-chain capital outflows and changes in the holdings structure. Over the past few weeks, the net positions of the 1k–10k ETH whale cohort and the 10k+ super whale cohort have continued to decline, around April 13, the related
GateNews2h ago
