
Date: Mon, Dec 29, 2025 | 08:30 AM GMT
The broader cryptocurrency market has kicked off the final week of 2025 on a constructive note, with both Bitcoin (BTC) and Ethereum (ETH) posting gains of over 2%. This steady strength among major assets has helped stabilize market sentiment, creating room for select altcoins — including Sui (SUI) — to develop promising technical structures.
SUI is trading with a modest intraday gain, but more importantly, its price action is beginning to reflect a clear structural shift. The chart suggests that selling pressure is fading and that a potential bullish continuation phase may be forming beneath the surface.
Source: Coinmarketcap
Bearish Bat Pattern in Play?
On the 4-hour timeframe, SUI appears to be carving out a Bearish Bat harmonic pattern. Despite its name, this structure often allows for an upside move toward the completion point before any broader trend decision takes place.
The formation started from Point X near the $1.728 area, followed by a sharp decline into Point A. Price then staged a recovery toward Point B before undergoing a deeper corrective move into Point C around $1.35. This region acted as a strong demand zone, where buyers consistently stepped in to absorb selling pressure.
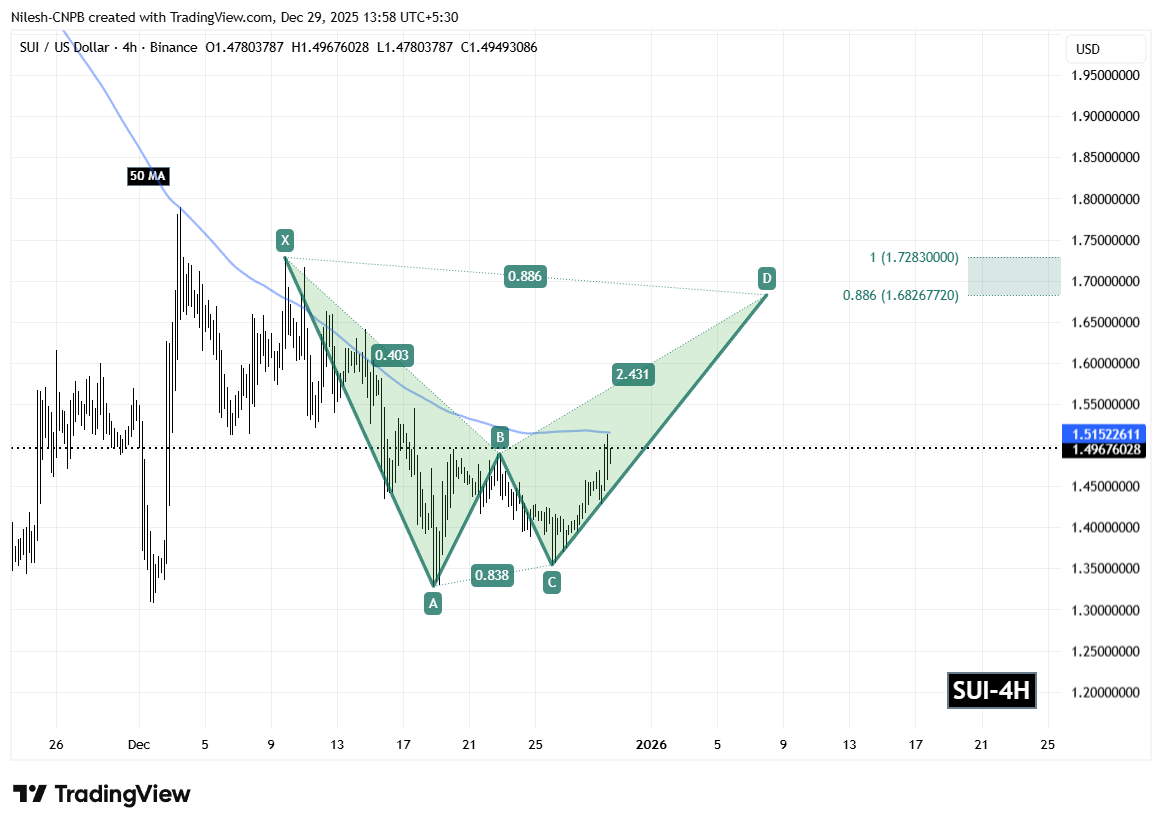
Sui (SUI) 4H Chart/Coinsprobe (Source: Tradingview)
Since printing the Point C low, SUI has shown steady recovery behavior and is currently trading around the $1.49 level. This rebound highlights waning bearish momentum and growing buyer confidence at lower prices.
Adding further technical weight to the setup, the 50-period moving average on the 4-hour chart is positioned near $1.51. A decisive reclaim and sustained hold above this level would reinforce bullish momentum and validate the ongoing recovery structure.
What’s Next for SUI?
If buyers continue to defend the $1.43 support zone and successfully flip the 50-hour moving average into support, the harmonic structure suggests a continuation move toward the Potential Reversal Zone (PRZ).
Based on Fibonacci projections, the PRZ lies between $1.6826 (0.886 extension) and $1.7283 (1.0 extension). This zone represents a potential upside of roughly 15% from current levels and aligns closely with classic harmonic completion targets, where price reactions often intensify.
For now, SUI’s technical outlook remains constructive. As long as support holds and momentum continues to build, the harmonic pattern indicates that the next meaningful move may favor the upside, positioning SUI for a test of higher resistance zones in the sessions ahead.
Disclaimer: The views and analysis presented in this article are for informational purposes only and reflect the author’s perspective, not financial advice. Technical patterns and indicators discussed are subject to market volatility and may or may not yield the anticipated results. Investors are advised to exercise caution, conduct independent research, and make decisions aligned with their individual risk tolerance.
About Author: Nilesh Hembade is the Founder and Lead Author of Coinsprobe, with over 5 years of experience in the cryptocurrency and blockchain industry. Since launching Coinsprobe in 2023, he has been providing daily, research-driven insights through in-depth market analysis, on-chain data, and technical research.

Disclaimer: The information on this page may come from third parties and does not represent the views or opinions of Gate. The content displayed on this page is for reference only and does not constitute any financial, investment, or legal advice. Gate does not guarantee the accuracy or completeness of the information and shall not be liable for any losses arising from the use of this information. Virtual asset investments carry high risks and are subject to significant price volatility. You may lose all of your invested principal. Please fully understand the relevant risks and make prudent decisions based on your own financial situation and risk tolerance. For details, please refer to
Disclaimer.
Related Articles
Compass Point cuts Circle to Sell, CRCL shares fall more than 10%
Circle Internet Group(CRCL)stock price fell 9.9%, and Compass Point cut its rating to “Sell,” with a target price of $77, reflecting regulatory risk and the impact of market sentiment. At the same time, a hacking incident involving Drift Protocol triggered a collective lawsuit investigation, indirectly affecting CRCL’s stock price. Market awareness of DeFi risks has increased, and with stablecoin legislation stalled, Circle faces greater structural pressure.
MarketWhisper29m ago
U.S.-Iran ceasefire for 2 weeks! Bitcoin surges past $72,000, with shorts getting forcibly liquidated—liquidations exceeding $400 million.
Middle East conflict turned for the better after the U.S. and Iran agreed to a two-week ceasefire, with market risk sentiment recovering. U.S. stock index futures jumped sharply. Bitcoin broke through the $72,000 high, while oil prices plunged. Although the current rebound is significant, analysts warn that uncertainty around how the ceasefire agreement will be carried out and the overall economic pressure may still limit how long the rally can last.
区块客1h ago
CryptoQuant: Sustainable futures longs are catalyzing BTC and ETH to rise, not liquidation-triggered
CryptoQuant research indicates that after the ceasefire agreement, the price rise in Bitcoin and Ethereum was driven by new longs establishing positions, not by short liquidations. The open interest in BTC and ETH perpetual futures increased by $2.1 billion and $2.2 billion, respectively. Renewed institutional buying in the U.S. brought the Coinbase premium back into positive territory. Bitcoin broke above $69,400, targeting $79,000.
MarketWhisper1h ago
ETH 15-minute pump of 0.60%: exchange net capital outflows and on-chain large transfers drive a short-term rebound
2026-04-10 01:30 to 2026-04-10 01:45 (UTC), ETH traded within the 2185.0 to 2204.03 USDT range. The candlestick return was +0.60%, and the 15-minute intraday swing was 0.87%. During this period, mainstream market attention increased, with trading volume expanding by about 20% compared with the periods before and after, indicating stronger short-term liquidity.
The main drivers behind this unusual move were exchange net outflows and active on-chain large transfers. On-chain data shows that during this period, ETH saw multiple transactions, each over 8,000 ETH,
GateNews1h ago
Longtime Bitcoin whale dumps 271 million, replaying the crash scene from last January
Last week, Bitcoin whales sold about $271 million, setting the largest single-day activity since January. The market reacted well to this selloff: long-term holders significantly increased their Bitcoin holdings, indicating the market’s absorption capacity has strengthened. Analysts predict that Bitcoin could remain in the $70,000 to $72,000 range. Compared with the market conditions during the January selloff, this time has been more stable. Long-term holders’ net positions turned positive, and technical indicators suggest the market is approaching a bottom, with clear signs of a future recovery.
MarketWhisper1h ago
Why is Bitcoin up today? “Alireza” opens direct negotiations, and Trump demands that Iran “immediately” stop tanker fees
Bitcoin’s official rise today reached $71,800, mainly because Israel and Lebanon have begun direct negotiations, reducing market concerns about an Iran ceasefire agreement. In addition, a weaker US dollar and continued buying by institutional investors also pushed prices higher. On the technical side, Bitcoin’s key support levels are $68,500 to $70,000. A break above $76,000 to $78,000 could prompt another test of $80,000 to $85,000.
MarketWhisper2h ago
