
Date: Sat, Dec 27, 2025 | 11:04 AM GMT
**Zcash (ZEC), **the privacy-focused cryptocurrency, has continued to outperform much of the broader altcoin market, extending its strong upside momentum. The token surged nearly 10% today alone, pushing its 60-day rally beyond 50%. While overall market conditions remain mixed, ZEC’s technical structure suggests this move may not be finished just yet.

Source: Coinmarketcap
Ascending Triangle Breakout
On the daily timeframe, ZEC had been consolidating inside a well-defined ascending triangle — a bullish continuation pattern marked by higher lows pressing against a horizontal resistance. Throughout this phase, sellers consistently defended the $476 region, while buyers steadily raised their bid levels, compressing price action and building pressure beneath resistance.
That standoff has now resolved decisively in favor of bulls. ZEC pushed cleanly above the $476 barrier, confirming a breakout and accelerating toward the current price near $494. This move signals a clear shift in short-term momentum and reflects growing confidence among buyers following an extended consolidation phase.
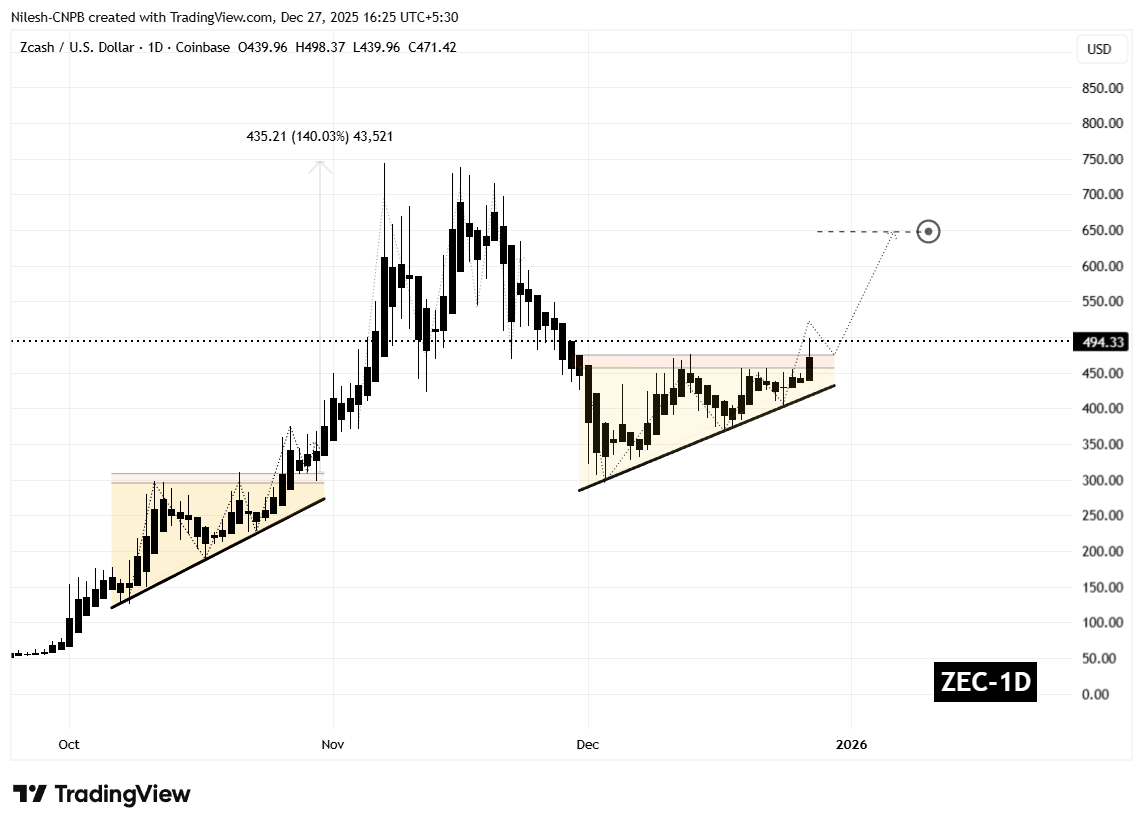
Zcash (ZEC) 4H Chart/Coinsprobe (Source: Tradingview)
Notably, this breakout closely mirrors a similar technical structure seen in October, which ultimately triggered a powerful 140% rally. While history does not guarantee a repeat, the resemblance strengthens the bullish narrative surrounding the current move.
What’s Next for ZEC?
After a breakout of this magnitude, a brief consolidation or retest is often considered constructive rather than bearish. For ZEC, the $457–$476 region now becomes a critical zone to monitor. Holding above this area would confirm former resistance as new support and keep the bullish structure firmly intact.
If buyers successfully defend this zone, the ascending triangle’s measured move points toward a potential upside target near $651. This level represents roughly a 30% gain from current prices and aligns with the broader projection suggested by the pattern.
On the downside, failure to maintain strength above the breakout region could weaken the bullish outlook. A sustained move back below former resistance or a breakdown in structure may invite renewed selling pressure and lead to a deeper consolidation before another upside attempt.
For now, the breakout remains valid. As long as buyers continue to defend the newly reclaimed levels, Zcash appears well-positioned to extend its recovery and potentially unlock further upside in the sessions ahead.
Disclaimer: The views and analysis presented in this article are for informational purposes only and reflect the author’s perspective, not financial advice. Technical patterns and indicators discussed are subject to market volatility and may or may not yield the anticipated results. Investors are advised to exercise caution, conduct independent research, and make decisions aligned with their individual risk tolerance.
Disclaimer: The information on this page may come from third parties and does not represent the views or opinions of Gate. The content displayed on this page is for reference only and does not constitute any financial, investment, or legal advice. Gate does not guarantee the accuracy or completeness of the information and shall not be liable for any losses arising from the use of this information. Virtual asset investments carry high risks and are subject to significant price volatility. You may lose all of your invested principal. Please fully understand the relevant risks and make prudent decisions based on your own financial situation and risk tolerance. For details, please refer to
Disclaimer.
Related Articles
PEPE Reclaims 0.00000400 — Is This 1.8% Move the Start of a Bigger Run?
PEPE rebounds from 0.00000385 support, forming higher lows and stronger bullish structure.
Technical indicators like MACD and RSI show momentum with room for further upside.
Key resistance at 0.00000410; support at 0.00000380 critical for trend continuation.
PepeCoin — PEPE, has
CryptoNewsLand2h ago
ETH drops 0.58% in 15 minutes: derivatives liquidity contraction and proactive position reduction dominate short-term pullback
From 2026-04-19 04:30 to 2026-04-19 04:45 (UTC), within ETH’s 15-minute candlestick chart, the return recorded -0.58%, and the price range was 2321.62 to 2342.04 USDT, with an amplitude of 0.87%. The short-term selloff occurred against a backdrop of increased overall market volatility and a broad decline in the prices of major crypto assets; overall market risk appetite clearly fell, and traders’ wait-and-see sentiment strengthened.
The main driver behind this abnormal move is a sharp contraction in liquidity in the derivatives market and leveraged funds proactively reducing positions. Data shows that over the past 24 hours, the ETH/USD perpetual contract trading volume dropped 67.16% to approximately 74.87 million, open interest edged down 3.33% to 329 million, and liquidation amounts did not expand unusually. This structure indicates that the market lacks the risk of passive cascades; more funds chose to proactively step aside and wait on the sidelines, intensifying short-term selling pressure.
In addition, the long/short structure in which shorts held the upper hand (long/short ratio 47.48%:52.52%) and sentiment synchronization with the panic range reinforced the downward price trend. During the same period, major coins such as BTC and SOL also fell 2%-3.4% in tandem, further showing that this pullback was driven by system-wide risk sentiment. On-chain funds did not show any large abnormal transfers or large-scale liquidations of DeFi protocols; spot and on-chain liquidity remained generally stable, and no sudden system risk resonance was observed.
Current volatility-related risks still need close monitoring, especially as overall risk appetite continues to contract—ETH’s short-term price may face further downside probing. Watch subsequent changes in derivatives trading volume and open interest, extreme shifts in the long/short ratio and funding rate, and promptly monitor on-chain fund flows, large transfers, and any signs of amplified platform net outflows. For more market anomalies and deeper analysis, please continue to follow our upcoming market updates.
GateNews3h ago
Spark Protocol's January delisting of rsETH proves prudent as Aave faces ETH liquidity crisis
Spark Protocol's strategy of delisting low-usage assets and tightening collateral has faced initial backlash but proved wise during market turmoil. While maintaining higher interest rate caps, SparkLend ensures liquidity, unlike Aave, which now faces significant risks.
GateNews3h ago
Request Network (REQ) Surges 23.68% in 15 Minutes, 24-Hour Gain Reaches 116.52%
Request Network (REQ) surged 23.68% in just 15 minutes, reaching $0.152, with a 24-hour rise of 116.52% and trading volume over $8 million. Factors include retail interest and whale accumulation. Resistance at $0.160 and support at $0.122 are under observation.
GateNews4h ago
Solana Price Stalls Near $80 as ETF Outflows Weigh
Solana trades around $80, facing bearish sentiment due to ETF outflows and declining retail participation. Technical indicators show mixed signals, with resistance at $87 and $98, while support at $77 remains critical for stability.
CryptoFrontNews9h ago
Dogecoin Holds $0.094 as X Cashtags Drive Market Attention
Key Insights
Dogecoin holds above $0.094 despite market weakness as Bitcoin and Ethereum stabilize, reflecting resilience and sustained demand across major cryptocurrencies during the consolidation phase.
X launches smart cashtags enabling real-time crypto and stock tracking, improving marke
CryptoNewsLand12h ago
