
As the new year 2026 begins, the broader cryptocurrency market has shown modest strength over the past few hours, with both Bitcoin (BTC) and Ethereum (ETH) turning slightly green. This improvement in sentiment has started to spill over into the altcoin market as well, with several tokens attempting to build upward momentum — including Render (RENDER).
RENDER is currently up around 4% on the day, but the more compelling development lies beneath the surface. On lower timeframes, price action is beginning to highlight a constructive bullish structure that could soon pave the way for a meaningful breakout if confirmed.
Source: Coinmarketcap
Ascending Triangle Structure Takes Shape
On the 4-hour chart, RENDER appears to be forming a textbook ascending triangle, characterized by a sequence of higher lows pressing steadily against a well-defined horizontal resistance zone. This structure is widely viewed as a bullish continuation pattern, particularly when it develops after a period of consolidation and shows signs of accumulation.
RENDER recently faced rejection near the $1.36 neckline resistance, which pushed price back toward its rising support trendline around the $1.28 region. However, each pullback has been met with strong buying interest, keeping the pattern intact and preventing any deeper breakdown. This behavior suggests that sellers are gradually losing control as buyers continue to step in at higher levels.
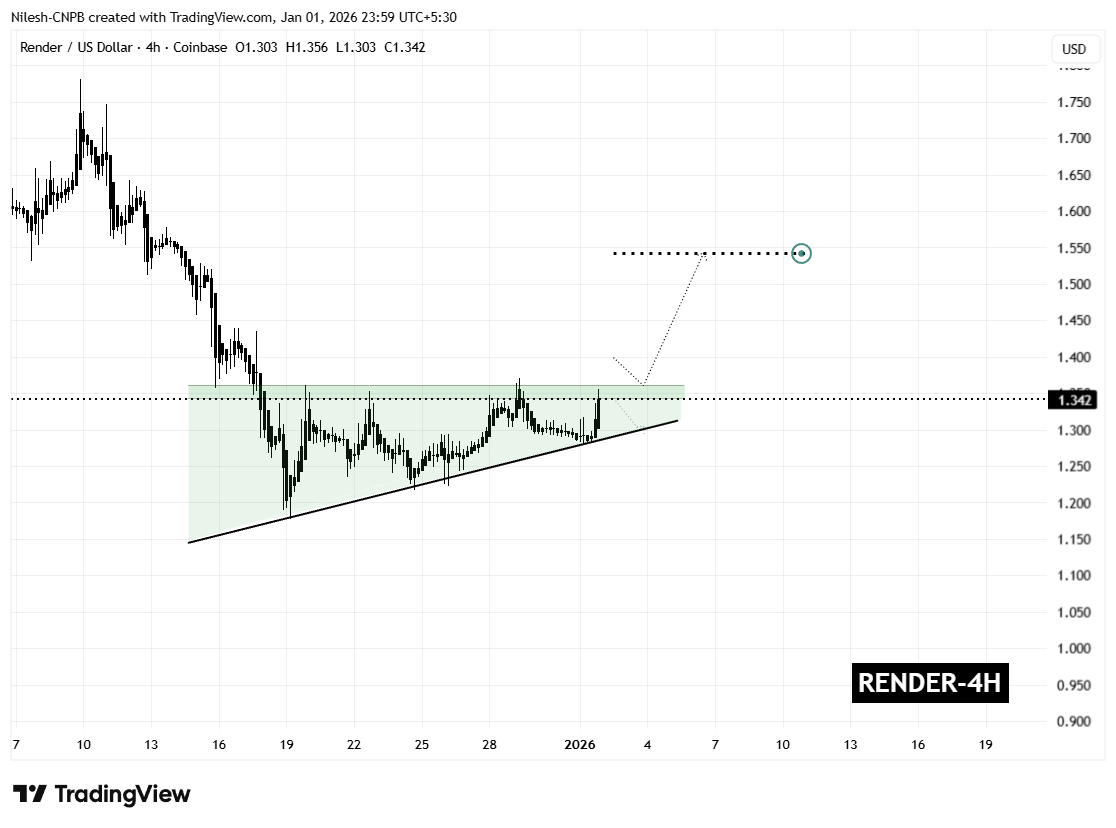
Render (RENDER) 4H Chart/Coinsprobe (Source: Tradingview)
The latest rebound has carried RENDER back toward the upper boundary of the pattern, reinforcing the idea that demand remains firm. Rather than signaling weakness, this price action points to healthy consolidation as the market tightens ahead of a potential breakout.
What’s Next for RENDER?
From here, RENDER appears to be preparing for another test of the $1.36 resistance zone. A confirmed breakout and sustained close above this level, ideally followed by a successful retest as support, would validate the ascending triangle structure and likely trigger a bullish expansion phase.
Based on the measured move of the pattern, the technical upside projection points toward the $1.54 region. This target represents a potential upside of roughly 14% from current levels and also aligns with previous price structure, strengthening the bullish case.
That said, caution remains warranted. A failure to break above resistance could result in a pullback toward the rising support trendline. As long as that trendline continues to hold, the broader bullish structure would remain intact. A decisive breakdown below support, however, would invalidate the pattern and delay any breakout scenario.
For now, the combination of improving market sentiment, persistent buying pressure, and a tightening ascending triangle structure suggests that Render is approaching a critical decision point — one that could define its next significant move as 2026 gets underway.
Disclaimer: The views and analysis presented in this article are for informational purposes only and reflect the author’s perspective, not financial advice. Technical patterns and indicators discussed are subject to market volatility and may or may not yield the anticipated results. Investors are advised to exercise caution, conduct independent research, and make decisions aligned with their individual risk tolerance.
About Author: Nilesh Hembade is the Founder and Lead Author of Coinsprobe, with over 5 years of experience in the cryptocurrency and blockchain industry. Since launching Coinsprobe in 2023, he has been providing daily, research-driven insights through in-depth market analysis, on-chain data, and technical research.

Disclaimer: The information on this page may come from third parties and does not represent the views or opinions of Gate. The content displayed on this page is for reference only and does not constitute any financial, investment, or legal advice. Gate does not guarantee the accuracy or completeness of the information and shall not be liable for any losses arising from the use of this information. Virtual asset investments carry high risks and are subject to significant price volatility. You may lose all of your invested principal. Please fully understand the relevant risks and make prudent decisions based on your own financial situation and risk tolerance. For details, please refer to
Disclaimer.
Related Articles
XRP Breakout Holds as XRPL Lending Vote Gains Momentum
XRP shows weekly strength, trading above EMAs after breaking from a descending wedge; XRPL advances XLS-65/66 lending upgrades with pooled vaults and fixed-term loans; derivatives rise in volume, open interest, and options activity.
Abstract: This report notes XRP's persistent weekly momentum and price strength above key moving averages following a breakout from a descending wedge. It covers XRPL validators voting on XLS-65 and XLS-66, enabling native lending, pooled liquidity vaults, and fixed-term loans to expand on-chain financial activity. It also reports rising derivatives participation, with higher trading volume, open interest, and a surge in options activity, suggesting increasing trader positioning for a continued breakout.
CryptoNewsLand17m ago
Shiba Inu Price Compression Signals Imminent Breakout Phase
Key Insights:
Shiba Inu trades near $0.0000060 as tightening volatility and reduced momentum signal an approaching breakout phase after months of sustained decline.
Open interest declines to $68 million, while persistent spot outflows highlight cautious sentiment and limited conviction
CryptoNewsLand22m ago
Shiba Inu Holds Support as 31.7B SHIB Flows to Exchanges
Shiba Inu is showing resilience despite a sharp increase in tokens moving to exchanges. Data indicates that 31.74 billion SHIB entered trading platforms within 24 hours, raising concerns about potential selling pressure. At the time of writing, SHIB trades at $0.000006229, marking a gain of 0.61% ov
CryptoFrontier31m ago
Ripple Altcoin Maintains Breakout Against Bitcoin, XRP Could See a Price Surge of Over 550%
Ripple altcoin maintains breakout against Bitcoin.
XRP could see a price surge of over 550%.
This could propel the price of XRP to a new ATH target at $10.
The crypto market continues to show strong signals for an explosive altcoin price run phase. This long-held hope that the
CryptoNewsLand3h ago
Dogecoin Open Interest Surges to Two-Month High as Price Eyes $0.14
Gate News message, April 24 — Dogecoin surged as broader crypto market strength lifted sentiment, with open interest climbing to a two-month high. According to Coinglass, Dogecoin open interest exceeded $1.4
GateNews5h ago
Crypto Trader Says Bear Market Trend Rejected Bitcoin Twice, BTC Prepares for Bullish Narrative Shift
Crypto trader says bear market trend rejected Bitcoin twice.
Bear and bull analysts continue to debate the many possible outcomes.
BTC prepares for bullish narrative shift.
The price of Bitcoin BTC continues to trade above the now critical support level of $76,000, giving rise to
CryptoNewsLand5h ago