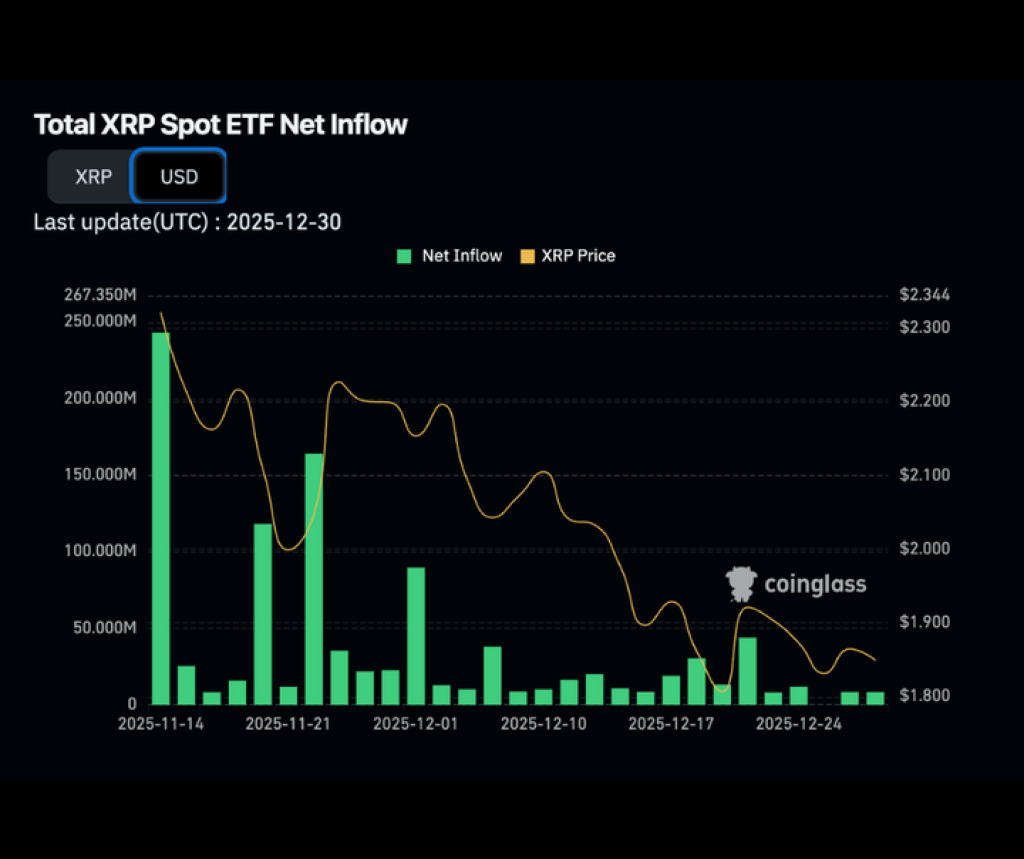
A CoinDesk post paired with a CoinGlass chart makes a simple point: spot ETF flow has become a steady source of demand for XRP, even while price action has struggled to hold its earlier momentum. The chart tracks “Total XRP Spot ETF Net Inflow” in USD terms, with green bars for net inflow and a yellow line for XRP price. The last update stamp shows 2025-12-30, and the timeline spans mid-November through late December.
The biggest signal sits at the start of the window. Net inflow prints a large spike in mid-November, then settles into a pattern of smaller but frequent positive days. A second burst appears around late November, followed by another noticeable inflow pop around early December. After that, the bars compress, but they do not disappear. In plain terms, inflows cool from the initial surge, yet they keep showing up.
The XRP price tells a different story. The yellow line starts near the top of the chart’s range and trends lower through the period, moving from the low $2.30s toward the high $1.80s. There is a brief rebound into mid-December, but the line fails to reclaim earlier levels and drifts back toward the lower end by late December. The key takeaway is divergence: inflows persist while price grinds down.
Source: X/@CoinDesk
CoinDesk frames the move as aggressive absorption. The post says XRP ETFs pulled in over $1B in about 50 days and locked 746M XRP, which it labels as 1.14% of circulating supply. It also notes only one zero-inflow day since launch, which supports the “consistent bid” narrative. From there, the post extrapolates: at a $27.7M-per-day pace, ETF assets could reach $5B by mid-May 2026, potentially locking 2.6B XRP, or roughly 4% of supply. It adds another pressure point: exchange balances are down 58% in 2025.
The bullish case makes sense on structure. If a large buyer keeps absorbing spot supply while exchange balances fall, liquidity tightens and the market needs less incremental demand to move higher.
The risk sits in the extrapolation. Flow pace rarely stays linear. A few quiet weeks can break the “daily run-rate” math, and price can still drift if broader crypto sentiment turns risk-off. Even so, the chart supports the core idea: XRP has a consistent demand source in the background, and that changes the setup heading into 2026.
Read also: “The Timeline Was Wrong”: XRP Community Confronts Reality After 7 Years of Waiting
Disclaimer: The information on this page may come from third parties and does not represent the views or opinions of Gate. The content displayed on this page is for reference only and does not constitute any financial, investment, or legal advice. Gate does not guarantee the accuracy or completeness of the information and shall not be liable for any losses arising from the use of this information. Virtual asset investments carry high risks and are subject to significant price volatility. You may lose all of your invested principal. Please fully understand the relevant risks and make prudent decisions based on your own financial situation and risk tolerance. For details, please refer to
Disclaimer.
Related Articles
Why Isn’t XRP Surging With Adoption Growth? Evernorth CEO Explains
XRP’s price disconnect from real-world usage is raising concern as Evernorth CEO Asheesh Birla signals institutional adoption remains too limited to support sustained demand, despite expanding infrastructure ambitions across the network.
XRP Pricing Disconnect Highlights Institutional Gap
A
Coinpedia1h ago
Ripple-Linked Evernorth Files S-4 to Launch XRP Treasury Firm
Evernorth Holdings filed for a Nasdaq listing via SPAC, targeting over $1B in proceeds. With hundreds of millions of XRP, it plans active management strategies and benefits from recent regulatory clarity classifying XRP as a digital commodity.
CryptoFrontNews4h ago
