
Date: Fri, Dec 26, 2025 | 06:30 PM GMT
The broader cryptocurrency market has been navigating a period of choppy and uncertain price action over the past several weeks, a phase that began after the sharp market-wide sell-off on October 10. During that correction, Ethereum (ETH) dropped nearly 28% over the last 60 days, applying sustained pressure across the altcoin sector — including ether.fi (ETHFI).
ETHFI has mirrored this weakness, sliding more than 31% over the same period. However, despite the sharp downtrend, recent price behavior suggests selling pressure may be easing. The token is now trading near a historically significant demand zone, where buyers have repeatedly stepped in before — raising the possibility that ETHFI could be approaching an inflection point.
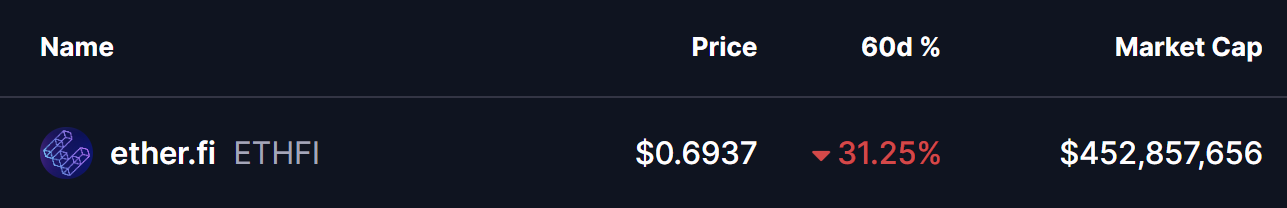
Source: Coinmarketcap
Double Bottom Pattern in Focus
On the daily timeframe, ETHFI appears to be forming a potential double-bottom structure — a classic reversal pattern that often signals exhaustion among sellers. The setup began after ETHFI was rejected from the $0.9233 resistance area, a move that triggered a sharp decline of nearly 28% and pushed price back toward the lower end of its range.
That sell-off dragged ETHFI into the $0.65 support zone, a level that has consistently acted as a strong demand area in the past. The chart now shows price revisiting this same region and stabilizing once again, suggesting buyers are actively defending it. The similarity between the first and second lows strengthens the case that a double-bottom base may be forming.
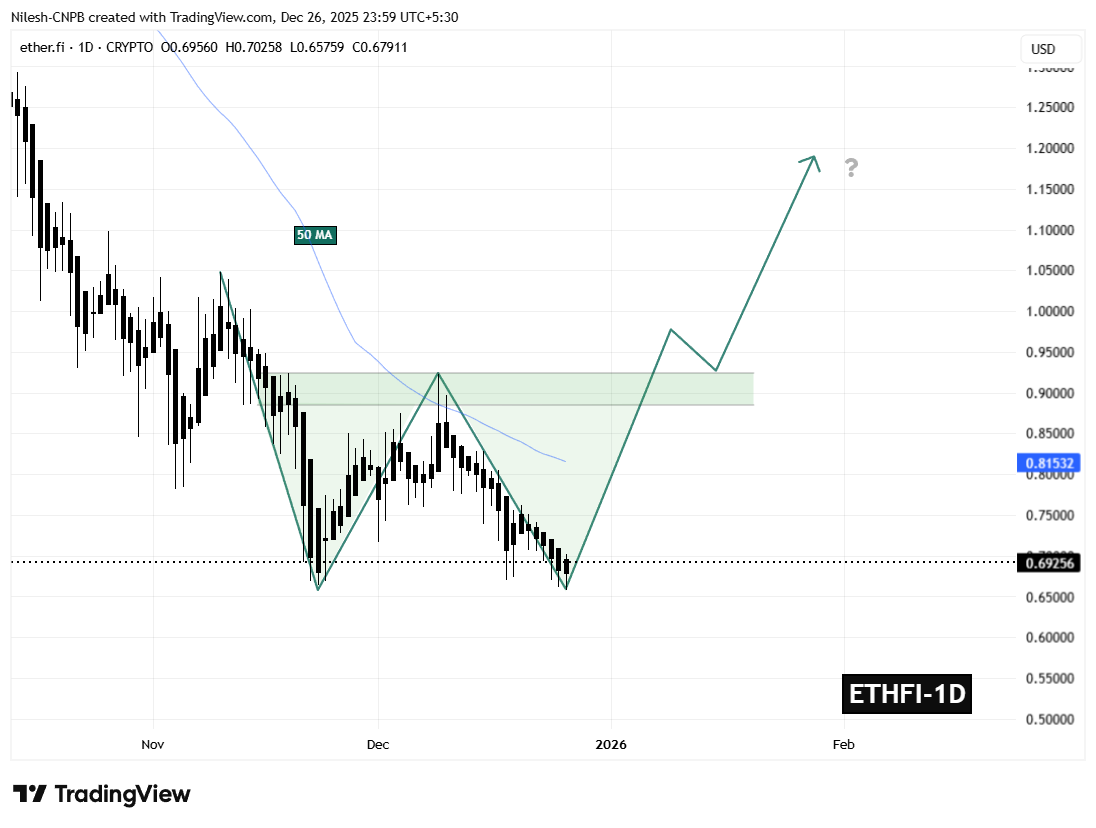
ETHFI Daily Chart/Coinsprobe (Source: Tradingview)
If this support continues to hold, the ongoing consolidation could mark the completion of the second bottom — a critical step in shifting momentum away from sellers and toward a potential trend reversal.
What’s Next for ETHFI?
The $0.65 support zone remains the most important level to monitor in the near term. As long as ETHFI holds above this area, the developing bullish structure remains valid and provides room for momentum to gradually rebuild.
On the upside, the first major challenge sits at the 50-day moving average near $0.8153. This level has repeatedly capped recovery attempts throughout the recent downtrend and now represents the initial test for buyers. A sustained move above this moving average would signal improving market structure and growing bullish confidence.
Beyond that, the $0.9233 neckline stands as the key confirmation level. A decisive breakout above this resistance would complete the double-bottom pattern and significantly strengthen the bullish outlook, potentially opening the door for a broader recovery move in the weeks ahead.
For now, ETHFI finds itself at a technically pivotal zone — one that could either reinforce the existing downtrend or mark the beginning of a meaningful rebound if buyers continue to defend support.
Disclaimer: The views and analysis presented in this article are for informational purposes only and reflect the author’s perspective, not financial advice. Technical patterns and indicators discussed are subject to market volatility and may or may not yield the anticipated results. Investors are advised to exercise caution, conduct independent research, and make decisions aligned with their individual risk tolerance.
Disclaimer: The information on this page may come from third parties and does not represent the views or opinions of Gate. The content displayed on this page is for reference only and does not constitute any financial, investment, or legal advice. Gate does not guarantee the accuracy or completeness of the information and shall not be liable for any losses arising from the use of this information. Virtual asset investments carry high risks and are subject to significant price volatility. You may lose all of your invested principal. Please fully understand the relevant risks and make prudent decisions based on your own financial situation and risk tolerance. For details, please refer to
Disclaimer.
Related Articles
Bitcoin falls below 71,500 USD, U.S.-Iran talks remain deadlocked, and the Strait of Hormuz becomes the biggest point of contention
On April 11, the U.S. and Iran began 20 hours of negotiations in Pakistan. The core issue was freedom of passage through the Strait of Hormuz. After Bitcoin briefly rose to $73,800, it quickly fell back to $71,557. The U.S. side took a hardline stance, demanding that Iran open the strait, while Iran insisted that easing restrictions must wait until a comprehensive agreement is reached. The two sides have not yet reached a consensus.
動區BlockTempo2h ago
Crypto Market Maintains Steady Growth Trajectory As Top Assets Show Gains
The crypto market continues to grow, with a market cap of $2.44T and Bitcoin and Ethereum showing slight increases. Top gainers include $GPM and $BASE. Meanwhile, DeFi TVL declined, NFT sales rose, and notable developments include a trader's significant loss and a push for regulatory clarity in Congress.
BlockChainReporter3h ago
BTC 15-minute chart slightly down 0.57%: leveraged long positions passively cut risk and macro sentiment disturbances drive volatility
2026-04-12 12:45 to 13:00 (UTC), the BTC price range was 71081.7 to 71493.2 USDT, with an amplitude of 0.58%. Within 15 minutes, the return recorded was -0.57%. During the period of unusual activity, market volatility increased somewhat, risk sentiment warmed up, and overall attention rose; however, there was no extreme surge in volume or a sudden drop in liquidity.
The main driver behind this unusual activity is that, under the leverage structure, long positions were reduced passively. Recently, the funding rate for perpetual contracts turned from negative to positive. Leverage among longs in the market accumulated; the price dipped slightly, triggering liquidations of some leveraged long positions and sell orders for position closures, resulting in
GateNews5h ago
Analyst: Bitcoin’s current pullback is relatively mild compared with past ones, but the bottom has not been confirmed yet.
Crypto analyst Axel Adler Jr said the current Bitcoin pullback is smaller than historic bearish-market levels, but a bottom has not yet been confirmed. He believes the market is still in a mild bear phase, and that a true recovery will require patience and waiting.
GateNews7h ago
Bitcoin long-term holdings increased to 12.4 million coins, and the 30-day change has remained positive.
CryptoQuant analyst Darkfost says the Bitcoin market is entering an early stabilization phase, with stronger long-term holding behavior. The amount of BTC held for more than a year has increased, and investors are more inclined to hold than to distribute. This suggests the market is transitioning toward long-term conviction; the current trend is viewed as an early stability signal, but it needs longer-term confirmation.
GateNews8h ago
XRP Payments Fall 77% as Price Eyes End to Rally - U.Today
XRP's on-chain payment volume has dropped 77% to 86 million, signaling bearish momentum as its price stagnates below $1.35. This decline has raised investor concerns about potential volatility in the crypto market.
UToday11h ago
