
The broader cryptocurrency market continues to struggle with uneven and choppy price action, a phase that began following the sharp sell-off on October 10. That correction dragged Ethereum (ETH) lower by nearly 25% over the past 60 days, keeping risk appetite subdued across the altcoin space.
Meanwhile, Bitcoin Cash (BCH) has managed to hold its ground, posting over 11% gains over the same period. More importantly, its price action is beginning to form a structure that often precedes larger trend reversals, suggesting the recent strength may be more than just a short-term bounce.
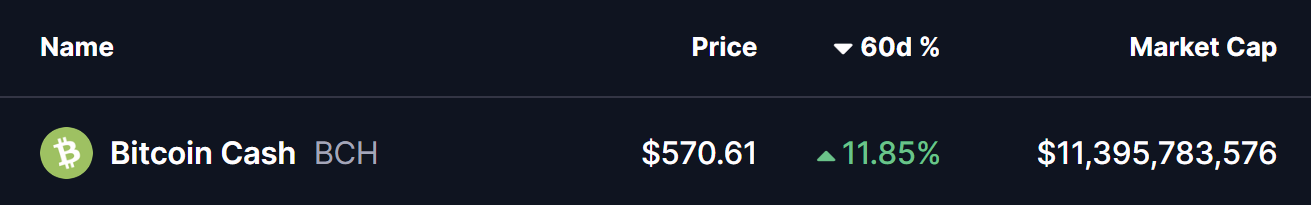
Source: Coinmarketcap
Rounding Bottom Taking Shape
On the daily timeframe, Bitcoin Cash appears to be carving out a rounding bottom formation — a classic bullish reversal pattern that reflects a gradual transition from distribution to accumulation. This type of structure typically forms after an extended correction, as selling pressure slowly fades and buyers begin stepping in with greater conviction.
The pattern began after BCH faced a firm rejection near the $630 region in September 2025. That rejection triggered a sharp decline, dragging price down toward the $446.9 area. Notably, sellers failed to force a deeper breakdown, and strong demand emerged around those lows. As weeks passed, BCH stabilized, volatility compressed, and price gradually curved higher, completing the rounded base visible on the chart.
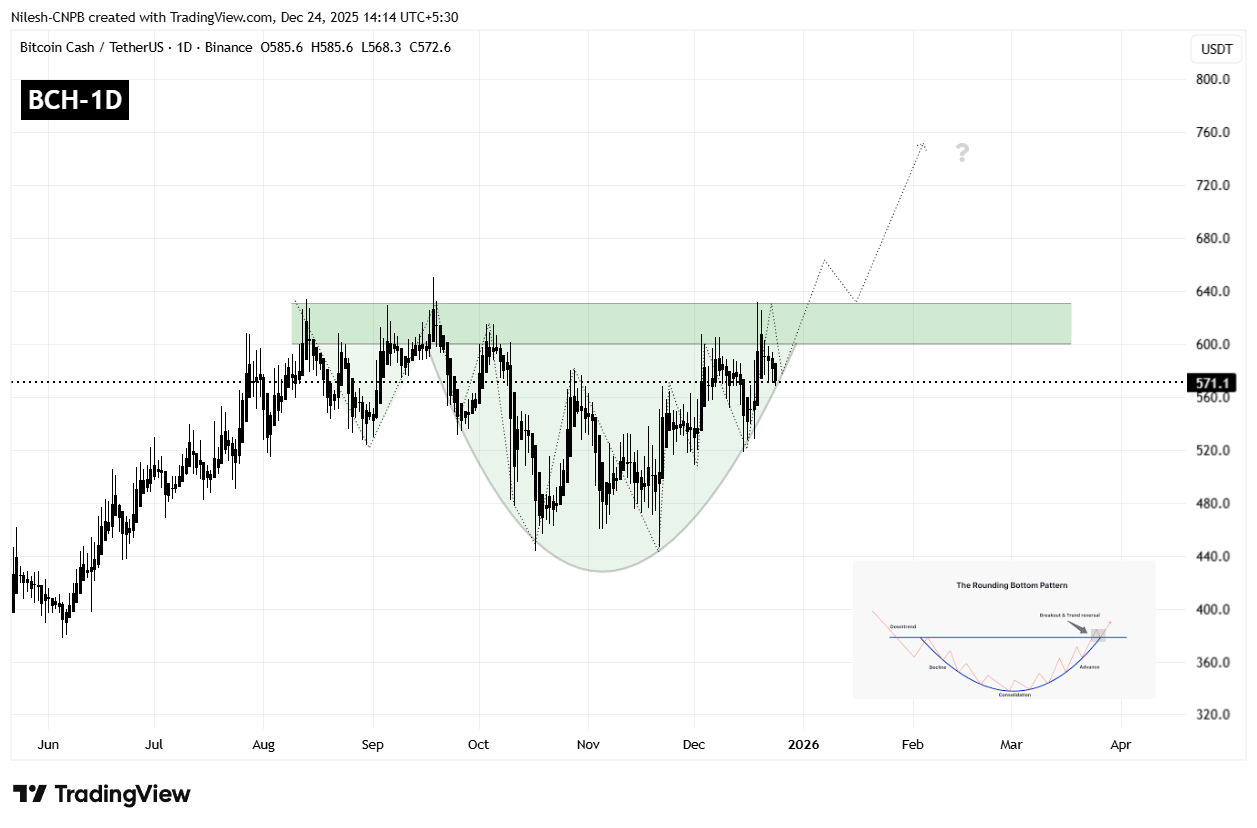
Bitcoin Cash (BCH) Daily Chart/Coinsprobe (Source: Tradingview)
Currently, BCH is trading near the $570 level and testing the lower support of the rounding base structure. This area is acting as a key inflection point, where buyers are attempting to defend the pattern and build momentum for a potential breakout attempt.
What’s Next for BCH?
A sustained bounce from the current zone, followed by a clean daily close above the $600–$630 resistance area, would confirm a bullish rounding bottom breakout. If price then manages to retest this zone and hold it as support, it would significantly strengthen the bullish case and suggest that a new upward leg is underway.
Based on the depth of the rounding structure, the projected upside target points toward the $800–$820 region. Reaching this zone would represent a potential upside of roughly 40% from current levels, aligning with the measured move typically associated with this pattern.
That said, patience remains essential. Before a confirmed breakout, BCH could still experience short-term pullbacks or consolidation below resistance. Until a decisive breakout and successful retest occur, the $600–$630 zone remains the key line in the sand that will determine whether Bitcoin Cash transitions into a sustained bullish phase or continues to trade within a broader range.
Disclaimer: The views and analysis presented in this article are for informational purposes only and reflect the author’s perspective, not financial advice. Technical patterns and indicators discussed are subject to market volatility and may or may not yield the anticipated results. Investors are advised to exercise caution, conduct independent research, and make decisions aligned with their individual risk tolerance.
Disclaimer: The information on this page may come from third parties and does not represent the views or opinions of Gate. The content displayed on this page is for reference only and does not constitute any financial, investment, or legal advice. Gate does not guarantee the accuracy or completeness of the information and shall not be liable for any losses arising from the use of this information. Virtual asset investments carry high risks and are subject to significant price volatility. You may lose all of your invested principal. Please fully understand the relevant risks and make prudent decisions based on your own financial situation and risk tolerance. For details, please refer to
Disclaimer.
Related Articles
BTC breaks through 73,000 USDT, up 2.6% in the past 24 hours
Gate News updates, April 13, market data shows that BTC broke through 73,000 USDT, currently trading at 73,012.4 USDT, with a 24-hour gain of 2.6%.
GateNews21m ago
Fake Ledger App on Apple’s App Store Drains Musician’s 5.9 BTC Retirement Fund
A fake Ledger app on Apple's App Store deceived musician Garrett Dutton into losing 5.9 BTC by entering his seed phrase. This case highlights ongoing wallet scams and the exploitation of trust, as the stolen bitcoin was laundered through KuCoin.
CryptoNewsFlash28m ago
BTC 15-minute rise of 0.74%: Trading volume surges and whale inflows in sync push prices higher
From 19:15 to 19:30 (UTC) on 2026-04-13, the BTC price rose by 0.74% in the short term. The price range was 72,320.5 to 72,907.8 USDT, and the amplitude reached 0.81%. During this period, market attention increased rapidly, trading activity noticeably intensified, and key on-chain and exchange metrics rose in sync.
The main driving force behind this abnormal move was a sharp surge in spot and derivatives trading volume in a short time. Within the anomaly window, BTC spot and derivatives trading volumes reached approximately $350 million and $680 million, respectively, both up about 67% compared with the prior cycle, indicating that the upward momentum was strongly supported.
GateNews50m ago
BTC Breaks Through 73000 USDT
Gate News bot 消息,Gate 行情显示,BTC 突破 73000 USDT,现价 73000 USDT。
CryptoRadar51m ago
Lookonchain Weekly Report: $2.56B Stablecoin Inflows and Institutional Accumulation Drive Market Recovery
Gate News message, according to Lookonchain Weekly Report for April 6-12, 2026, the cryptocurrency market experienced a liquidity recovery with $2.56 billion in stablecoin inflows. Both centralized exchange spot and perpetual contract volumes increased week-over-week. Institutional demand remained r
GateNews3h ago
