
Date: Fri, Dec 26, 2025 | 06:30 PM GMT
The broader cryptocurrency market has been navigating a period of choppy and uncertain price action over the past several weeks, a phase that began after the sharp market-wide sell-off on October 10. During that correction, Ethereum (ETH) dropped nearly 28% over the last 60 days, applying sustained pressure across the altcoin sector — including ether.fi (ETHFI).
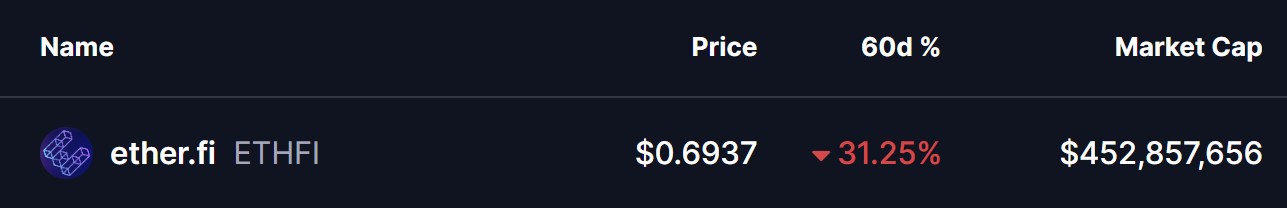
ETHFI has mirrored this weakness, sliding more than 31% over the same period. However, despite the sharp downtrend, recent price behavior suggests selling pressure may be easing. The token is now trading near a historically significant demand zone, where buyers have repeatedly stepped in before — raising the possibility that ETHFI could be approaching an inflection point.
Source: Coinmarketcap
Double Bottom Pattern in Focus
On the daily timeframe, ETHFI appears to be forming a potential double-bottom structure — a classic reversal pattern that often signals exhaustion among sellers. The setup began after ETHFI was rejected from the $0.9233 resistance area, a move that triggered a sharp decline of nearly 28% and pushed price back toward the lower end of its range.
That sell-off dragged ETHFI into the $0.65 support zone, a level that has consistently acted as a strong demand area in the past. The chart now shows price revisiting this same region and stabilizing once again, suggesting buyers are actively defending it. The similarity between the first and second lows strengthens the case that a double-bottom base may be forming.
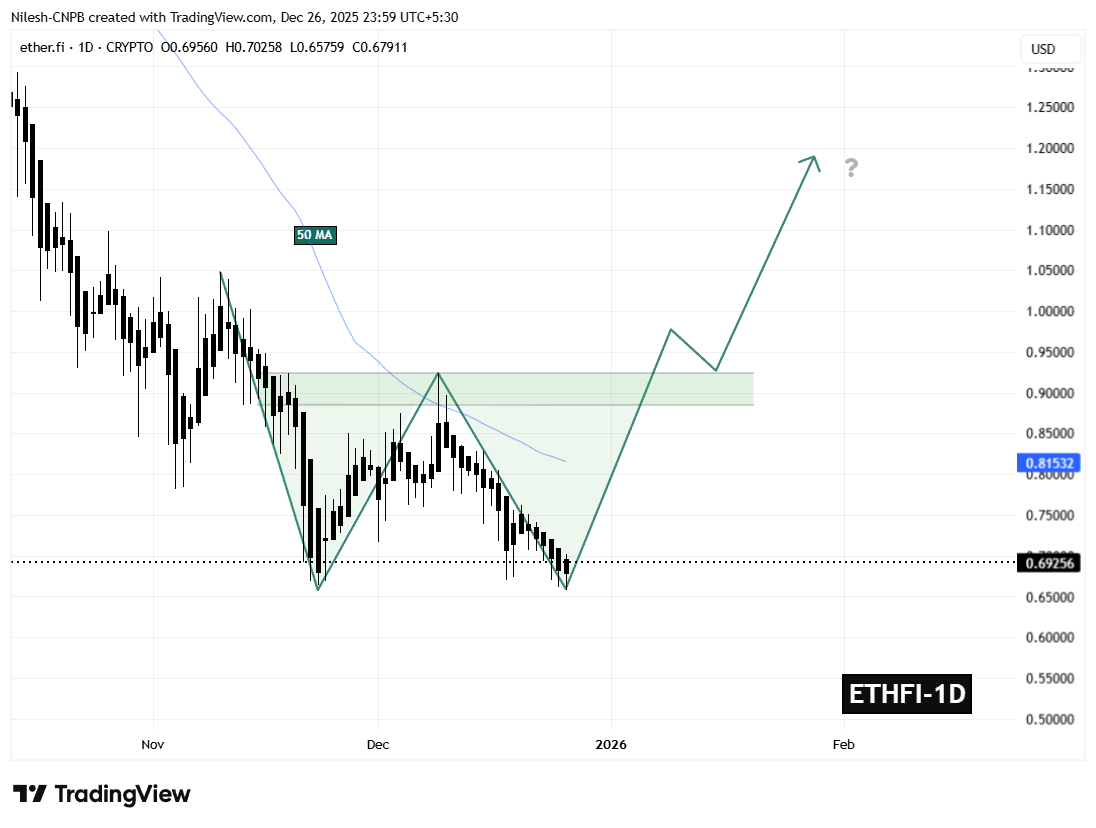
ETHFI Daily Chart/Coinsprobe (Source: Tradingview)
If this support continues to hold, the ongoing consolidation could mark the completion of the second bottom — a critical step in shifting momentum away from sellers and toward a potential trend reversal.
What’s Next for ETHFI?
The $0.65 support zone remains the most important level to monitor in the near term. As long as ETHFI holds above this area, the developing bullish structure remains valid and provides room for momentum to gradually rebuild.
On the upside, the first major challenge sits at the 50-day moving average near $0.8153. This level has repeatedly capped recovery attempts throughout the recent downtrend and now represents the initial test for buyers. A sustained move above this moving average would signal improving market structure and growing bullish confidence.
Beyond that, the $0.9233 neckline stands as the key confirmation level. A decisive breakout above this resistance would complete the double-bottom pattern and significantly strengthen the bullish outlook, potentially opening the door for a broader recovery move in the weeks ahead.
For now, ETHFI finds itself at a technically pivotal zone — one that could either reinforce the existing downtrend or mark the beginning of a meaningful rebound if buyers continue to defend support.
Disclaimer: The views and analysis presented in this article are for informational purposes only and reflect the author’s perspective, not financial advice. Technical patterns and indicators discussed are subject to market volatility and may or may not yield the anticipated results. Investors are advised to exercise caution, conduct independent research, and make decisions aligned with their individual risk tolerance.
Disclaimer: The information on this page may come from third parties and does not represent the views or opinions of Gate. The content displayed on this page is for reference only and does not constitute any financial, investment, or legal advice. Gate does not guarantee the accuracy or completeness of the information and shall not be liable for any losses arising from the use of this information. Virtual asset investments carry high risks and are subject to significant price volatility. You may lose all of your invested principal. Please fully understand the relevant risks and make prudent decisions based on your own financial situation and risk tolerance. For details, please refer to
Disclaimer.
Related Articles
3 Altcoins To Watch In The Third Week Of April 2026
ARB remains bearish, with downside risk below $0.1074 toward all-time low.
INJ shows weak momentum, with potential drop below $3.036 toward $2.500.
BCH attempts recovery, but must break $574.1 to confirm bullish continuation.
The crypto market continues to show mixed signals as April
CryptoNewsLand53m ago
Ethereum Liquid Supply Hits 2024 Low on Binance
Abstract: CryptoQuant reports a notable contraction in Ethereum's liquid supply on Binance, with liquid ETH dropping to about 534,000 from a total reserve of 3.44 million. The trend, termed liquidity dryup, could reduce near-term selling pressure and provide price support if demand improves.
Summary: CryptoQuant notes Binance's ETH liquid supply fell to ~534k of 3.44M total, signaling a liquidity dryup that could ease selling pressure and support prices if demand strengthens.
CryptoFrontier5h ago
$78,000 BTC Price Support Level Reclaimed, Bitcoin Could Be Entering Bullish Reversal Stage
Bitcoin reclaiming $78k fuels a bullish reversal narrative and potential altseason, with bulls eyeing new ATHs up to $126k–$140k while bears warn of a fake pump before a cycle bottom.
Abstract: The article discusses Bitcoin reclaiming the $78,000 level as a potential bullish reversal that could spur altcoin rallies, outlining bullish and bearish forecasts, possible new ATHs, and rising market optimism.
CryptoNewsLand5h ago
Altcoin Trading Volume Share Hits Two-Month High at 51% on Major CEX
Gate News message, April 22 — According to analyst Darkfost, altcoin trading volume share on a major centralized exchange reached 51%, up significantly from 31% in early March, while Bitcoin and Ethereum shares fell to 30% and 17% respectively.
Ethereum's trading volume share declined sharply from
GateNews6h ago
Bitcoin Breaks Through $78,000, Ethereum Hits $2,390: Market Panic Eases
Bitcoin breaks through $78,000, while Ethereum climbs above $2,390. This article reviews the V-shaped reversal trend from April 13 to 22, analyzing the evolution of liquidation data and the Fear and Greed Index.
GateInstantTrends6h ago
SHIB Struggles to Recover as Fresh Developments Fail to Lift Price Action
SHIB trading activity rises, but price stays trapped in a tight consolidation range.
Whale accumulation increases while some long-term holders, including Aoki, exit positions.
Strong derivatives volume and inflows fail
CryptoNewsLand8h ago