
Date: Tue, Dec 23, 2025 | 06:01 PM GMT
The broader cryptocurrency market has remained under pressure over the past several weeks, with the ongoing corrective phase weighing heavily on overall altcoin sentiment. Monad (MON) has also felt the impact of this weakness, as persistent selling pressure has kept price action subdued and volatile.
MON has declined by nearly 32% over the past 30 days, yet a closer look at the chart suggests that the current structure may be more constructive than it appears at first glance. Interestingly, Monad’s recent price behavior is beginning to resemble a bottoming pattern that previously played out on Hyperliquid (HYPE), a setup that eventually led to a powerful upside reversal earlier this year.
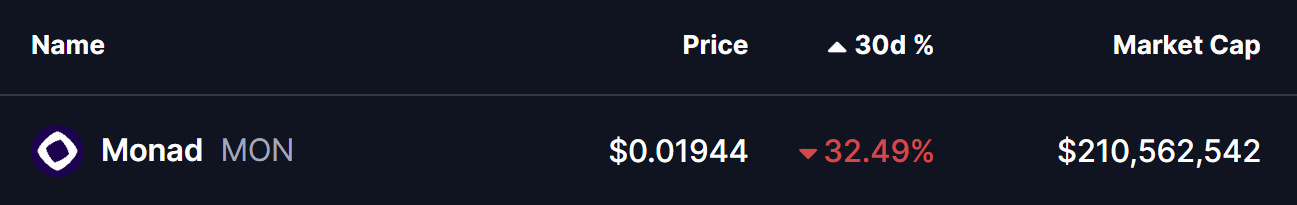
Source: Coinmarketcap
MON Mirrors HYPE’s Fractal Structure
On the comparative charts, MON appears to be tracing a structure strikingly similar to HYPE’s April 2025 fractal. In HYPE’s case, the token endured a deep 73% correction from its all-time high before forming a broadening wedge structure near the bottom. That consolidation phase ultimately resolved to the upside, with price reclaiming its key moving average and triggering a rally of more than 160% in the weeks that followed.
Monad’s decline from its own all-time high has reached roughly 65%, placing it well within the range of historical washout zones often associated with trend exhaustion. The current setup shows MON compressing within a symmetrical broadening wedge, a pattern that frequently precedes strong directional moves once price escapes the structure.
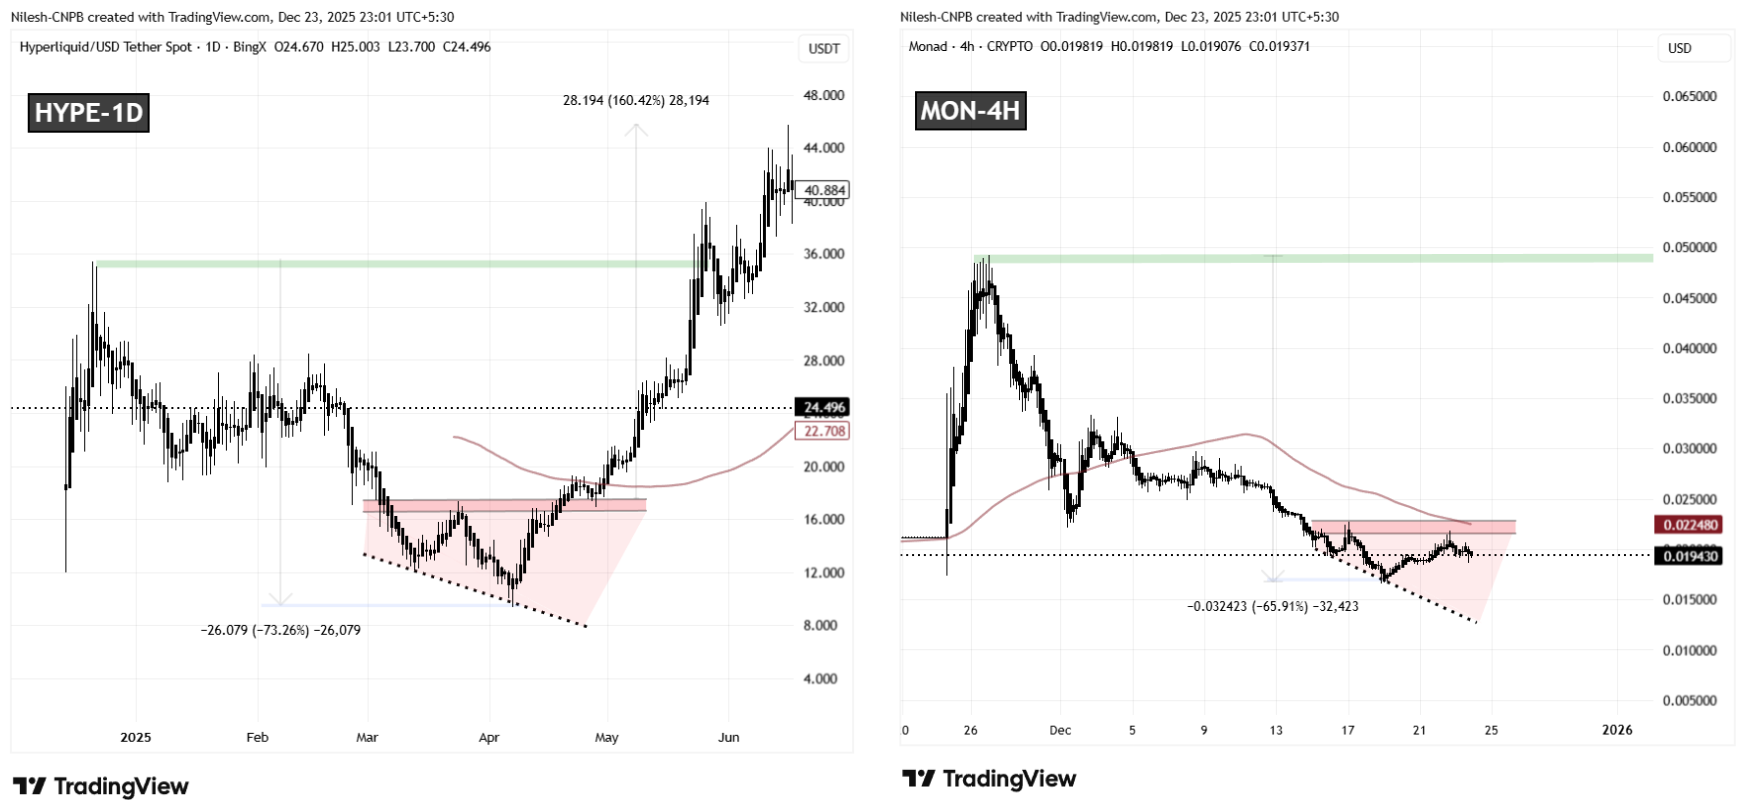
HYPE and MON Fractal Chart/Coinsprobe (Source: Tradingview)
This similarity becomes more compelling when viewed alongside the price behavior around resistance. MON is currently hovering just below a key neckline resistance band between $0.02170 and $0.02268, an area that closely mirrors the zone where HYPE consolidated before its breakout. The alignment between these two structures suggests that MON may be approaching a decision point.
What’s Next for MON?
Despite the growing resemblance to HYPE’s pre-breakout phase, the technical picture has not yet fully shifted in favor of the bulls. Sellers still retain short-term control, and confirmation is needed before a bullish reversal can be considered valid.
For momentum to flip decisively, MON would need to break above the upper boundary of the wedge and reclaim its 100 moving average, which sits near the $0.02248 level. A successful move above this region would signal improving trend strength and increase the probability that the fractal analogy continues to play out.
If such a breakout occurs, the upside potential becomes notable. A sustained bullish reversal could open the door for a broader recovery move toward the $0.049 area, which aligns with MON’s previous all-time high and represents roughly 155% upside from current levels. Until then, price action around resistance will remain critical in determining whether this fractal setup evolves into a full-fledged trend reversal or fails under continued market pressure.
**Disclaimer: **The views and analysis presented in this article are for informational purposes only and reflect the author’s perspective, not financial advice. Technical patterns and indicators discussed are subject to market volatility and may or may not yield the anticipated results. Investors are advised to exercise caution, conduct independent research, and make decisions aligned with their individual risk tolerance.
Disclaimer: The information on this page may come from third parties and does not represent the views or opinions of Gate. The content displayed on this page is for reference only and does not constitute any financial, investment, or legal advice. Gate does not guarantee the accuracy or completeness of the information and shall not be liable for any losses arising from the use of this information. Virtual asset investments carry high risks and are subject to significant price volatility. You may lose all of your invested principal. Please fully understand the relevant risks and make prudent decisions based on your own financial situation and risk tolerance. For details, please refer to
Disclaimer.
Related Articles
Bitcoin 'done' with 85% crashes, says Cathie Wood amid new $34K target
Bitcoin (BTC) is “done” with drawdowns of 85% or more from all-time highs, says ARK Invest CEO, Cathie Wood.
Key points:
Bitcoin will not see another correction of 85% or more versus its latest all-time high, Cathie Wood argues.
A new prediction sees $34,000 becoming the next BTC
Cointelegraph48m ago
Cathie Wood: BTC has entered a mature stage; 85%-95% will either experience a deep drop or become a thing of the past
ARK Invest founder Cathie Wood says Bitcoin has entered a mature phase, and that the large drawdowns of the past may be behind us— even a future 50% pullback would be considered progress. She noted that Bitcoin has grown into a mature monetary system and asset class.
GateNews58m ago
Ripple CTO Emeritus Challenges 'No-Freeze' Stablecoin Idea, What Are Risks? - U.Today
Ripple CTO Emeritus David Schwartz critiqued Omid Malekan's stablecoin prediction, questioning the feasibility of a non-intervention model in complying with legal obligations. Schwartz's inquiries highlighted potential challenges in redeeming stablecoins if issuers don't intervene, as well as implications for fractional reserve practices.
UToday1h ago
BTC is trading in a tight range around $67,000, and SOL futures open interest hits a new two-month high
On April 3, the crypto market continued to trade in choppy conditions. Bitcoin was consolidating around $67,000, maintaining its broader downward trend that began last October. The futures market saw thin trading, with Solana futures open interest hitting a new high, and the volatility index falling to its lowest level since February. Market structure indicates that short positions are increasing.
GateNews2h ago
Crypto consolidates as volatility cools and futures markets tilt bearish
The crypto market continued to exhibit signs of choppiness on Friday, with bitcoin BTC$66,729.05 trading at $67,000 in the middle of a trading range that spans back to early February.
A selection of altcoins picked up during the lower liquidity Asia hours, prompting the likes of ALGO and RENDER to
CoinDesk2h ago
Reputed Crypto Trader Calls the Bottom at $54,000 BTC Price, Bullish Expectations Grow
Reputed crypto trader calls the bottom at $54,000 BTC price.
This led to a massive surge in price pump expectations.
The price of BTC could rally towards new ATH prices after the bottom is set.
The price of Bitcoin (BTC) continues to trade in the $66,000 price range, hinting at
CryptoNewsLand3h ago
