Date: Sun, Dec 28, 2025 | 09:40 AM GMT
The broader cryptocurrency market is showing modest strength, with both Bitcoin (BTC) and Ethereum (ETH) trading in the green. This steady performance among major assets has helped stabilize overall sentiment, allowing select memecoins — including SPX6900 (SPX) — to begin showing constructive technical setups.
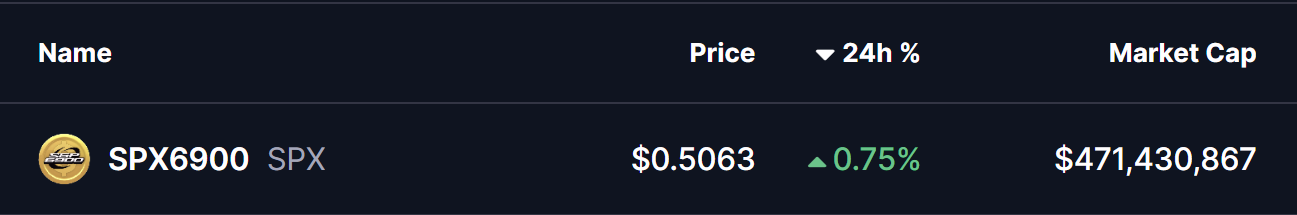
SPX is trading with a modest intraday gain, but more importantly, its price structure is starting to reflect a classic bullish reversal pattern. After weeks of sustained downside pressure, buyers appear to be stepping back in at key levels, hinting that the worst of the correction may already be behind.
Source: Coinmarketcap
Double Bottom Pattern in Play
On the daily timeframe, SPX is forming a double bottom pattern — a widely followed bullish reversal structure that often appears near the end of prolonged downtrends. The first bottom formed in November when SPX dropped toward the $0.45 region, followed by a recovery that carried price back toward the neckline resistance near $0.7389 in early December.
That recovery attempt, however, was rejected, sending SPX back down to retest the same $0.45 support zone. Importantly, sellers failed to push price meaningfully lower on this second attempt. Instead, SPX printed another strong reaction from the same demand area and has since rebounded to trade around $0.5045.

SPX6900 (SPX) Daily Chart/Coinsprobe (Source: Tradingview)
This repeated defense of the same support level is a critical technical signal. It suggests that selling pressure is weakening while buyers are gradually absorbing supply — a behavior typically seen during accumulation phases before trend reversals.
What’s Next for SPX?
For the bullish structure to strengthen, SPX must reclaim the 50-day moving average, currently positioned near $0.5770. A sustained move above this level would mark an important shift in short-term momentum and increase the probability of a continued recovery toward the neckline resistance at $0.7389.
A decisive breakout above the neckline — ideally followed by a successful retest — would confirm the full activation of the double bottom pattern. In that scenario, the technical projection points toward a potential upside target near $1.02, representing a significant expansion from current price levels.
Until then, the $0.45 support zone remains the most important level to watch. As long as SPX continues to hold above this area, the broader bullish setup stays intact and allows room for further upside attempts.
Overall, SPX’s structure appears constructive. The presence of a double bottom, repeated demand at identical lows, and proximity to the 50-day moving average suggest that this could be a pivotal moment as the token attempts to transition from accumulation into a new expansion phase.
Disclaimer
The views and analysis presented in this article are for informational purposes only and reflect the author’s perspective, not financial advice. Technical patterns and indicators discussed are subject to market volatility and may or may not yield the anticipated results. Investors are advised to exercise caution, conduct independent research, and make decisions aligned with their individual risk tolerance.
About Author
Nilesh Hembade is the Founder and Lead Author of Coinsprobe, with over 5 years of experience in the cryptocurrency and blockchain industry. Since launching Coinsprobe in 2023, he has been providing daily, research-driven insights through in-depth market analysis, on-chain data, and technical research.

Disclaimer: The information on this page may come from third parties and does not represent the views or opinions of Gate. The content displayed on this page is for reference only and does not constitute any financial, investment, or legal advice. Gate does not guarantee the accuracy or completeness of the information and shall not be liable for any losses arising from the use of this information. Virtual asset investments carry high risks and are subject to significant price volatility. You may lose all of your invested principal. Please fully understand the relevant risks and make prudent decisions based on your own financial situation and risk tolerance. For details, please refer to
Disclaimer.
Related Articles
BTC falls 0.44% in 15 minutes: ETF fund outflows and derivatives shorts add to the slide
From 21:45 to 22:00 (UTC) on April 19, 2026, the BTC price dropped by 0.44% within 15 minutes. The candlestick range was 74,366.1 to 74,789.3 USDT, with an amplitude of 0.57%. Short-term volatility was concentrated. During this period, the trading volume for large orders rose significantly, market attention increased, and volatility intensified.
The main driving force behind this deviation was that U.S. spot Bitcoin ETFs saw a large net outflow of $291 million over two days from April 18 to April 19. This reflected institutional funds pulling away in the short term, which led to a marked increase in sell pressure in the spot market. At the same time, BTC perpetual contract
GateNews15m ago
Dogecoin Holds $0.094 as X Cashtags Drive Market Attention
Key Insights
Dogecoin holds above $0.094 despite market weakness as Bitcoin and Ethereum stabilize, reflecting resilience and sustained demand across major cryptocurrencies during the consolidation phase.
X launches smart cashtags enabling real-time crypto and stock tracking, improving marke
CryptoNewsLand2h ago
Dogecoin Holds $0.09 Support as $0.10 Breakout Looms
Dogecoin remains around $0.09, showing limited movement as traders await a clear breakout direction. Key support is at $0.08, with resistance at $0.10. Current technical indicators suggest a balanced market, but a decisive move is needed to shift momentum.
CryptoNewsLand3h ago
XRP Price Clears $1.40 While Broader Downtrend Persists
XRP's recent rise above $1.40 indicates a shift in market behavior after a consolidation phase. While momentum indicators show improvement, the broader bearish trend persists, limiting upside potential. Sustained support is crucial for extending its recovery.
CryptoNewsLand3h ago
Chainlink Price Compresses Below $10 as Breakout Pressure Builds
Key Insights
Chainlink maintains higher lows within a tightening range, reflecting steady accumulation as buyers absorb selling pressure and prepare for a potential breakout move
Repeated resistance tests near $10 weaken supply levels while rising support strengthens demand, increasing the p
CryptoNewsLand3h ago
XRP Consolidation Signals Reset as Bullish Setup Emerges
XRP has recently rebounded to $1.39 after trading between $1.20 and $1.40 due to improved market sentiment. A significant drop in futures open interest reflects reduced speculation, while technical indicators suggest a potential bullish breakout, targeting $1.50 and possibly $1.80.
CryptoNewsLand4h ago
