
Date: Mon, Dec 22, 2025 | 06:56 AM GMT
The broader altcoin market has experienced choppy and largely directionless price action over the past several weeks, a phase that began after the sharp sell-off on October 10. That correction dragged Ethereum (ETH) down from the sub-$4,700 region to the $3,000 area, leaving traders cautious and overall risk appetite muted. Over the last 60 days alone, ETH has declined by nearly 21%, reinforcing a short-term bearish narrative across the altcoin space.
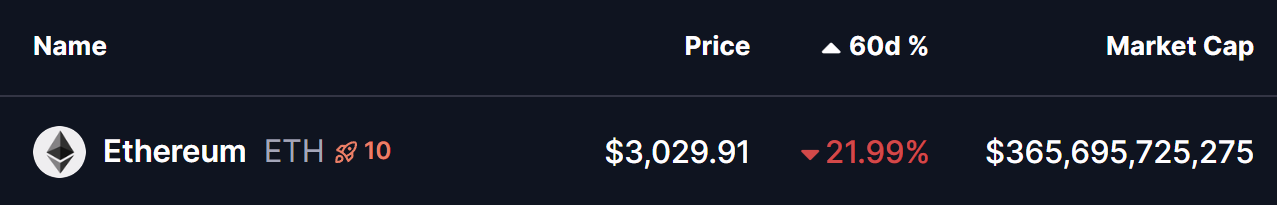
Source: Coinmarketcap
However, beneath the surface, the higher-timeframe technical structure is starting to hint at something far more constructive. Long-term signals on the ETH/BTC chart are now aligning in a way that has historically preceded major altcoin expansions, raising the possibility that the current weakness could be laying the groundwork for a bullish reversal into 2026.
ETH/BTC Chart Hints at a Bullish Altcoin Expansion
According to the latest analysis shared by @el_crypto_prof, the ETH/BTC weekly chart has once again recreated a structure that closely mirrors previous cycle transitions. This setup focuses on the interaction between the SMA100 and EMA100, two moving averages that have historically defined the beginning and end of major altcoin cycles.
In past market cycles, altcoin bull markets have tended to begin when the SMA100 crosses below the EMA100 — a bearish crossover that, counterintuitively, has marked long-term bottoms rather than tops. These moments often coincided with peak pessimism, underperformance of ETH versus BTC, and broad disinterest in altcoins.
Conversely, altcoin bull markets have historically ended when the SMA100 crosses back above the EMA100, signaling overheating conditions and the return of Bitcoin dominance.
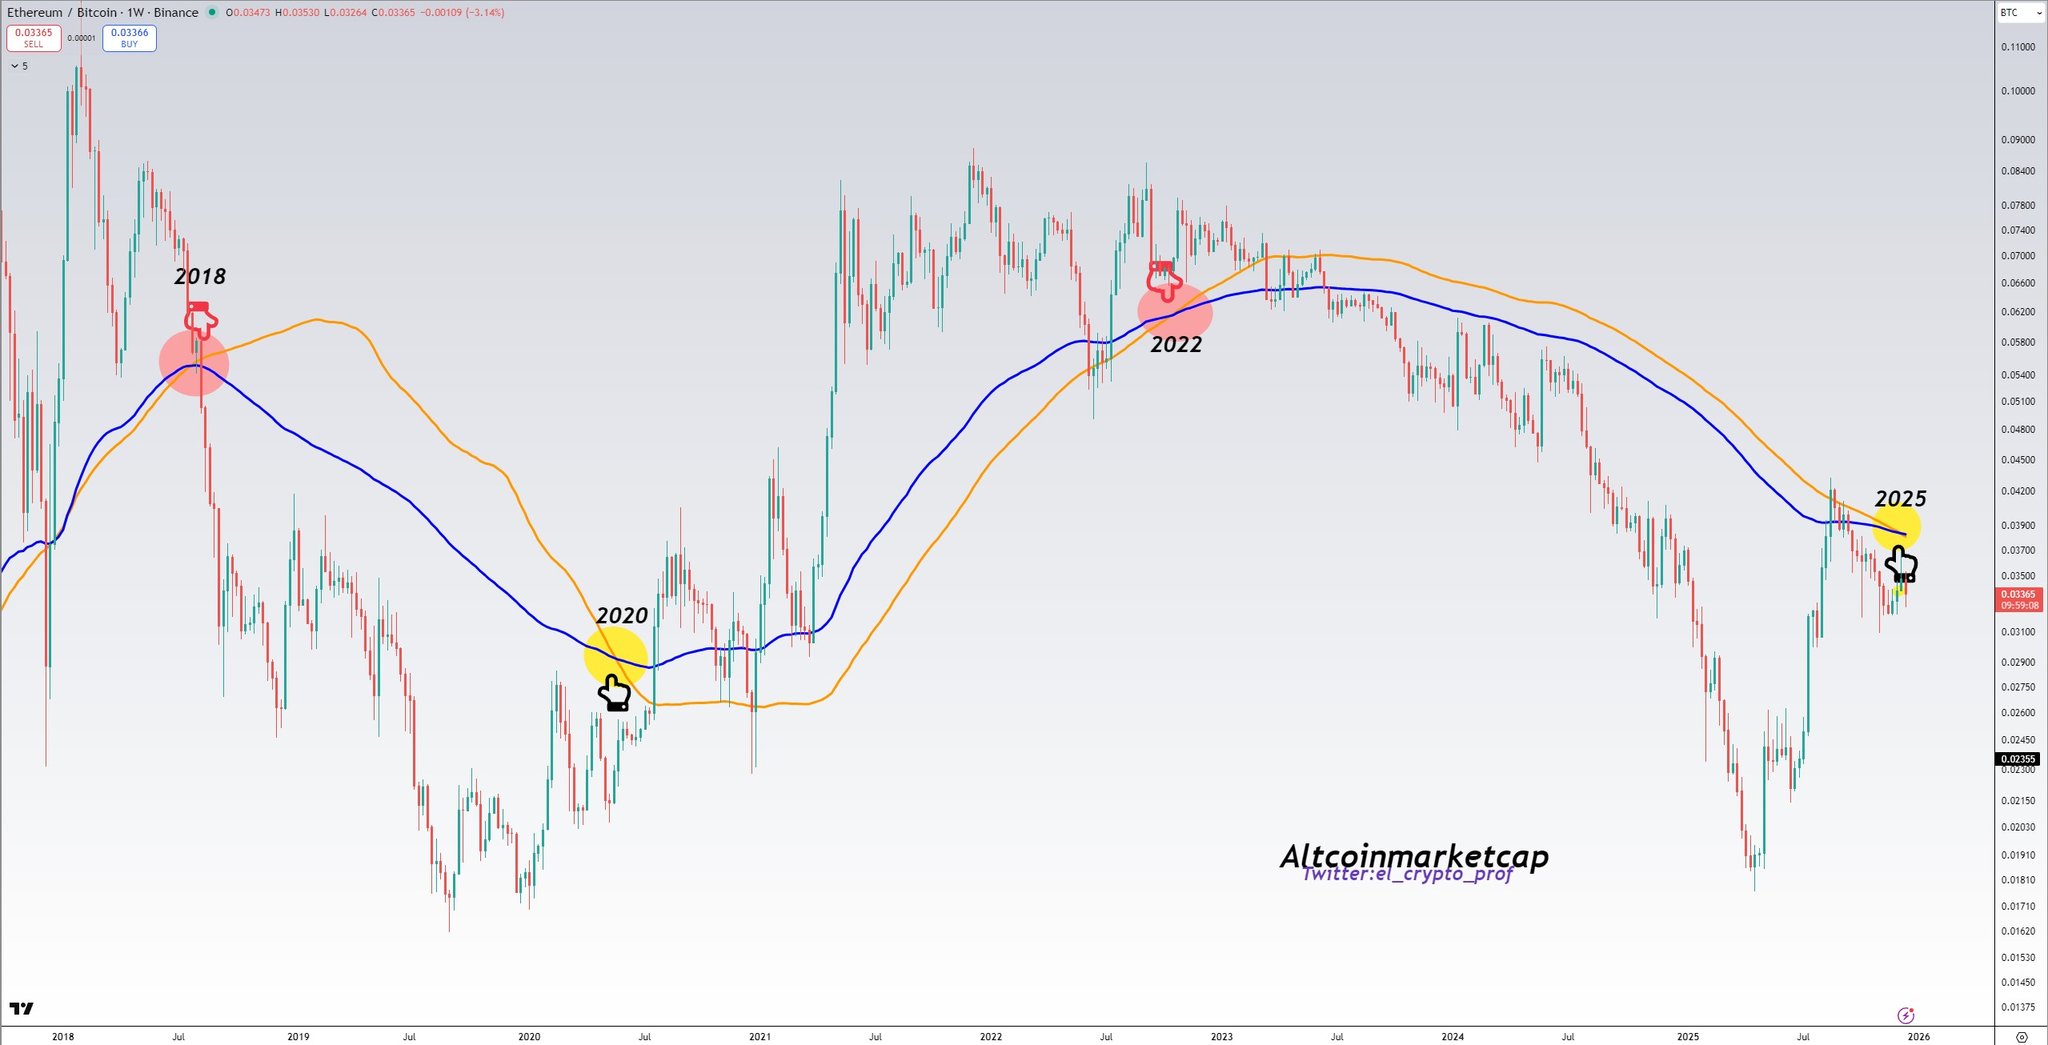
ETH-BTC Pair Chart/Credits: @el_crypto_prof (X)
The chart highlights three key moments:
In 2018, the bullish crossover marked the end of the altcoin cycle and preceded prolonged underperformance.
In 2020, the bearish crossover aligned closely with the start of a powerful altcoin expansion that carried into 2021.
In 2022, the bullish crossover once again signaled exhaustion and the onset of another prolonged correction.
Now, in 2025, the ETH/BTC pair has once again printed a bearish SMA100–EMA100 crossover, placing the market at a familiar inflection point. Historically, this has been the zone where altcoins quietly transition from distribution to accumulation.
What’s Next for Altcoins?
If this long-term setup continues to play out as it has in previous cycles, the coming months could mark the early stages of a broader altcoin recovery rather than the continuation of a downtrend. While short-term volatility and further downside cannot be ruled out, the structural signal suggests that downside risk may be gradually diminishing.
For altcoins, this phase has typically been characterized by range-bound price action, selective accumulation, and patience — followed by a sharp expansion once momentum returns and capital begins rotating out of Bitcoin.
Importantly, this is not a timing signal for immediate upside. Long-term moving average crossovers operate on a macro scale and often precede major rallies by months. But they do provide context: historically, these moments have offered some of the best risk-reward conditions for long-term altcoin exposure.
As 2026 approaches, the ETH/BTC chart suggests the altcoin market may be closer to a structural reset than many currently expect. If history repeats, today’s consolidation could ultimately be remembered as the calm before the next major altcoin cycle.
Disclaimer: The views and analysis presented in this article are for informational purposes only and reflect the author’s perspective, not financial advice. Technical patterns and indicators discussed are subject to market volatility and may or may not yield the anticipated results. Investors are advised to exercise caution, conduct independent research, and make decisions aligned with their individual risk tolerance.
Disclaimer: The information on this page may come from third parties and does not represent the views or opinions of Gate. The content displayed on this page is for reference only and does not constitute any financial, investment, or legal advice. Gate does not guarantee the accuracy or completeness of the information and shall not be liable for any losses arising from the use of this information. Virtual asset investments carry high risks and are subject to significant price volatility. You may lose all of your invested principal. Please fully understand the relevant risks and make prudent decisions based on your own financial situation and risk tolerance. For details, please refer to
Disclaimer.
Related Articles
Bitcoin, ether, solana slide further as Trump threatens to hit Iran 'extremely hard'
Bitcoin and major cryptocurrencies fell sharply after Trump's address threatened escalated military action against Iran, reversing a previous rally. The ongoing conflict continues to create volatility in the market. Despite historical April gains, optimism is tempered by geopolitical tensions.
CoinDesk15m ago
Trump makes a tough statement to pressure Iran, Bitcoin falls below a key level, and the crypto market is under pressure again
Driven by the impact of Trump’s hardline remarks toward Iran, the crypto market weakened, with Bitcoin and Ethereum falling to $66,609 and $2,056, respectively. Market panic sentiment intensified, and the Fear & Greed Index dropped to 8. War risk pushed energy prices up, suppressing the valuations of risk assets, and in the short term volatility in crypto assets could increase.
GateNews24m ago
Trump’s “Stone Age” speech threatens to seriously hit the market; Bitcoin’s price gives back its gains
U.S. President Trump threatened in a speech to launch even harsher strikes against Iran. The market reacted sharply: Bitcoin and the stock market fell significantly, and oil prices surged. Iran has no intention of backing down and is pushing for legislation on permanent tolls, showing that tensions between the two countries have not eased. The market believes a ceasefire cannot be achieved quickly.
MarketWhisper36m ago
Trump says the Strait of Hormuz will be made “naturally open,” and the market shows disagreement through selling off
Trump expressed optimism in his speech about Iran’s military actions, saying the Strait of Hormuz will be “naturally open,” but he did not provide a specific plan, leading markets to sell off. Iran, in turn, made no concessions and plans to pass legislation to collect transit fees, further increasing uncertainty. The market reaction shows that risk assets underwent broad repricing.
MarketWhisper1h ago
Monad locks in $350 million, and its low fee rate and FDV being halved release a cautious signal
Monad blockchain reached a total value locked (TVL) of $355 million within about four months, setting a record for rapid growth, but its daily transaction fees are less than $3,000, indicating a disconnect between locked capital and real trading activity. At the same time, the fully diluted valuation of the MON token fell from $4.7 billion to about $2.2 billion, reflecting the market’s lack of confidence in its continued ability to attract users.
MarketWhisper1h ago
Pi Network RPC server startup, supply pressure obstructs a technical rebound for PI
Pi Network announced that its testnet remote procedure call (RPC) servers are now live, laying the groundwork for building a smart contract ecosystem. Although this news is seen as a positive, the core team’s selling of more than 21.8 million PI tokens, along with the ongoing supply pressure stemming from user top-ups, has still exerted downside pressure on the market. Technical analysis shows that the support level for the PI token is $0.1736; the future price action needs to be closely watched.
MarketWhisper2h ago
