
Date: Tue, Dec 23, 2025 | 07:30 AM GMT
Bitcoin (BTC) has spent the past several weeks moving through a corrective and largely sideways phase after its sharp pullback from record highs near $126,000. The correction pushed BTC into the $87,000 region, cooling momentum with 17% 60 days drop and keeping traders cautious as 2025 approaches its final days.
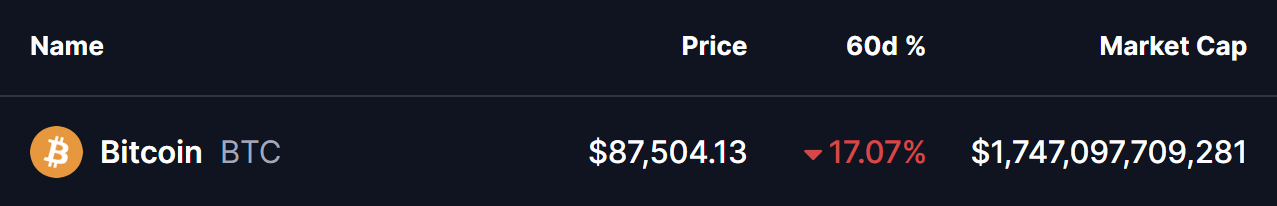
Source: Coinmarketcap
While short-term price action remains uncertain, a powerful long-term signal is flashing from the traditional markets—one that has historically preceded major Bitcoin bull runs heading into the following year.
That signal is coming from the Russell 2000.
A Pattern That Has Repeated Before Every Major BTC Bull Run
A long-term comparative chart shared by crypto analyst @AO_btc_analyst highlights a recurring pattern between Bitcoin and the Russell 2000 Index. Each time the Russell 2000 has successfully broken above a major horizontal resistance level, Bitcoin has gone on to deliver a sustained bullish expansion in the months that followed.
This relationship has played out consistently across multiple market cycles. During previous breakouts in 2013, 2017, and 2021, the Russell 2000’s move higher signaled a shift toward risk-on conditions—an environment that historically benefits Bitcoin.
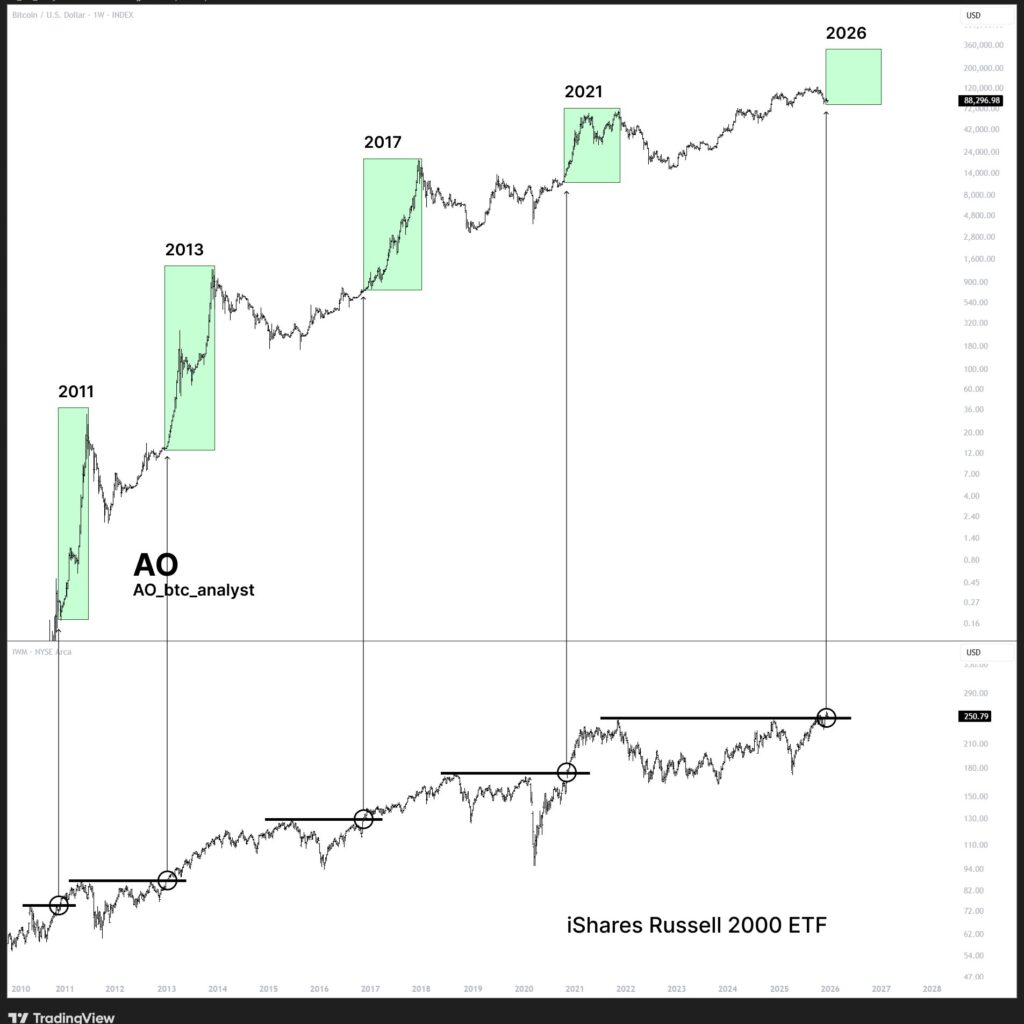
BTC and RUSSELL Fractal Chart/Credits: @AO_btc_analyst (X)
In each of those cycles, Bitcoin lagged initially before accelerating sharply once liquidity and investor confidence expanded.
Russell 2000 Breakout Strengthens the 2026 BTC Case
What makes the current setup especially notable is that the Russell 2000 has now decisively broken above its long-term horizontal resistance. This breakout confirms bullish momentum in small-cap equities and signals improving risk appetite across global markets.
Bitcoin’s current structure closely mirrors earlier cycle setups. Despite the recent correction, BTC continues to hold its broader range, suggesting the market may be building a base rather than transitioning into a prolonged bearish phase.
If this long-term pattern continues to hold, the Russell 2000 breakout could act as an early confirmation that Bitcoin is positioning for another expansion phase in 2026.
What’s Next for Bitcoin?
From a higher-timeframe perspective, Bitcoin’s outlook remains constructive as long as key support zones around the $80,000–$85,000 region remain intact. A sustained recovery and acceptance above major resistance levels would further validate the bullish thesis.
While historical patterns are never guarantees, the consistency of this signal across multiple market cycles makes it difficult to ignore. As 2026 approaches, the Russell 2000 breakout could emerge as one of the most important macro clues pointing toward renewed upside for Bitcoin, potentially setting the stage for a move toward significantly higher—though still debatable—price targets ahead.
Disclaimer: The views and analysis presented in this article are for informational purposes only and reflect the author’s perspective, not financial advice. Technical patterns and indicators discussed are subject to market volatility and may or may not yield the anticipated results. Investors are advised to exercise caution, conduct independent research, and make decisions aligned with their individual risk tolerance.
Disclaimer: The information on this page may come from third parties and does not represent the views or opinions of Gate. The content displayed on this page is for reference only and does not constitute any financial, investment, or legal advice. Gate does not guarantee the accuracy or completeness of the information and shall not be liable for any losses arising from the use of this information. Virtual asset investments carry high risks and are subject to significant price volatility. You may lose all of your invested principal. Please fully understand the relevant risks and make prudent decisions based on your own financial situation and risk tolerance. For details, please refer to
Disclaimer.
Related Articles
ETFs Face Liquidity Headwinds – Bitcoin and Ethereum Record Deepening Net Outflows
The crypto market is currently experiencing the effects of increased volatility amid waning industry interest in new spot exchange-traded funds (ETFs). Recent data from SoSoValue shows that the market experienced a huge drop on March 27, with U.S. Bitcoin spot ETFs suffering a massive outflow of $22
BlockChainReporter19m ago
Traders assign 53% odds BTC under $66K by Apr 24
Bitcoin traded lower into Friday, sliding to around $65,530 after Thursday’s peak near $71,300 and erasing roughly $210 million in leveraged long exposure as the market faced an about $18.6 billion monthly options expiry. The Deribit options market priced in a bearish tilt, placing a 53%
CryptoBreaking39m ago
Bitcoin’s Most Dangerous Pattern Just Triggered: Will BTC Dump to $26K Next?
Although bitcoin has already dumped by over 50% from its all-time high of over $126,000 marked in October to a multi-year low of $60,000, the asset’s troubles might not be over, warned Merlijn The Trader.
The popular analyst indicated that the “most dangerous bitcoin pattern just completed phase
CryptoPotato50m ago
Bitcoin’s Price Slips Below $70K, but GCOIN by Playnance Eyes $100M Milestone
Bitcoin’s price was heavily rejected at $76,000 a couple of days ago, and the correction accelerated today. The cryptocurrency is now trading below $70,000, sending the entire market sentiment to extreme fear.
Major altcoins like Ethereum and Ripple’s XRP are also on the downside, both losing
CryptoPotato54m ago
Bitcoin ETFs Cap Week With $225 Million Outflow as Ether Hits 8-Day Slide
Crypto ETFs closed the week under heavy pressure, with bitcoin posting a sharp outflow and ether extending its losing streak. Solana declined further, while XRP remained inactive.
Bitcoin, Ether ETFs Deepen Losses as Weekly Selling Peaks
The week did not end quietly. Instead, it closed with
Coinpedia1h ago
