Date: Fri, Dec 19 2025 | 12:45 PM GMT
The broader cryptocurrency market is showing relative strength despite concerns around the Japan rate hike. Cooling U.S. inflation has helped both Bitcoin (BTC) and Ethereum (ETH) hold in the green, and this stability is beginning to spill over into select altcoins, including Stellar (XLM).
XLM has posted modest gains today, but beyond the short-term price move, the daily chart is starting to reveal an emerging technical structure that could set the stage for a more meaningful recovery if key levels continue to hold.
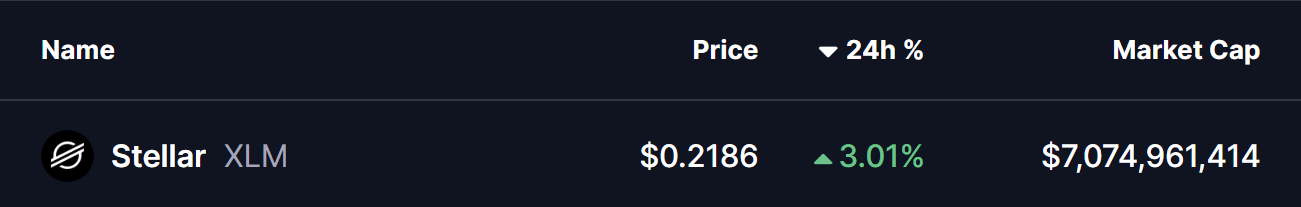
Source: Coinmarketcap
Harmonic Pattern Signals Potential Upside
On the daily timeframe, XLM appears to be forming a Bearish Cypher harmonic pattern — a setup that often generates upside momentum during its final CD leg before price reaches the Potential Reversal Zone (PRZ).
The pattern began at point X near the $0.3113 region, where XLM topped out before entering a sharp corrective phase. Price then declined into point A, followed by a rebound toward point B. From there, XLM rolled over again and extended lower into point C around the $0.2029 area, completing the core structure of the pattern.
Since tagging this low, XLM has started to stabilize and grind higher, currently trading near the $0.2188 level. This slow but steady recovery suggests that selling pressure may be fading, with buyers beginning to defend the recent lows more aggressively.
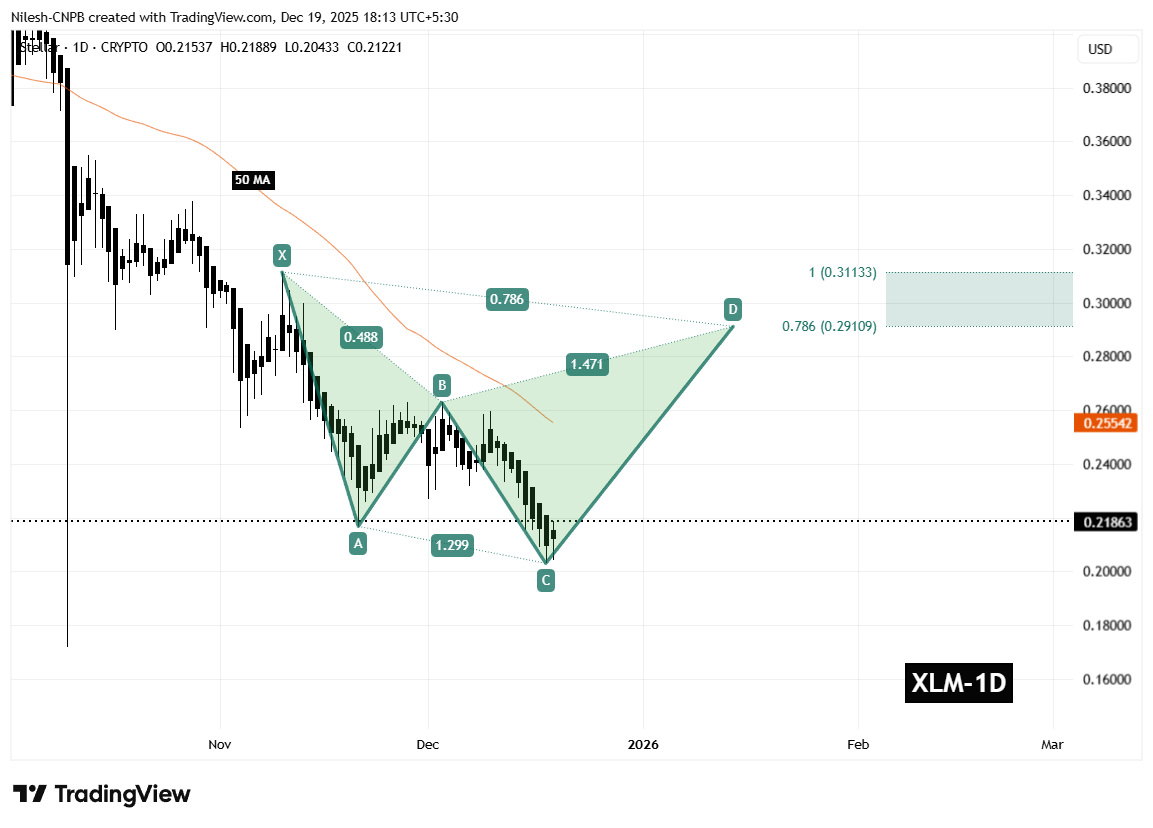
Stellar (XLM) Daily Chart /Coinsprobe (Source: Tradingview)
A key technical factor aligning with this structure is the 50-day moving average, currently positioned near $0.2554. This moving average has consistently acted as dynamic resistance throughout the downtrend and represents an important hurdle for bulls to overcome in the near term.
What’s Next for XLM?
In the short term, the most critical level to monitor is the C-leg support around $0.2029. As long as XLM holds above this zone, the harmonic pattern remains valid and the bullish CD-leg scenario stays intact.
If price continues to build strength from this base, the next major test will be a reclaim of the 50-day moving average near $0.2554. A decisive break and close above this level would signal improving momentum and could accelerate upside continuation.
Based on the harmonic structure, the projected upside targets sit within the Potential Reversal Zone, defined between the 0.786 Fibonacci extension near $0.2910 and the 1.0 extension around $0.3113. Reaching this zone would represent a potential upside of roughly 40–45% from current price levels, making it a key area where profit-taking or stronger resistance could emerge.
On the downside, failure to hold above the $0.2029 support would significantly weaken the bullish setup. A breakdown below this level could invalidate the harmonic structure and expose XLM to deeper downside pressure before any sustainable recovery attempt develops.
For now, the chart suggests Stellar is sitting at an important technical crossroads. While confirmation is still needed, the presence of a well-defined harmonic pattern indicates that a short- to medium-term bounce remains a realistic possibility if buyers continue to defend current levels and reclaim key resistance zones.
Disclaimer: The views and analysis presented in this article are for informational purposes only and reflect the author’s perspective, not financial advice. Technical patterns and indicators discussed are subject to market volatility and may or may not yield the anticipated results. Investors are advised to exercise caution, conduct independent research, and make decisions aligned with their individual risk tolerance.
Disclaimer: The information on this page may come from third parties and does not represent the views or opinions of Gate. The content displayed on this page is for reference only and does not constitute any financial, investment, or legal advice. Gate does not guarantee the accuracy or completeness of the information and shall not be liable for any losses arising from the use of this information. Virtual asset investments carry high risks and are subject to significant price volatility. You may lose all of your invested principal. Please fully understand the relevant risks and make prudent decisions based on your own financial situation and risk tolerance. For details, please refer to
Disclaimer.
Related Articles
Here’s Why Siren (SIREN) Price Is Exploding
SIREN's price surged by 135% due to speculation, fueled by increased futures trading and leveraged investments. Despite a bullish chart pattern, significant risks arise from supply concentration. Caution is advised as the volatile price may reverse.
CaptainAltcoin22m ago
Bitcoin Nears a Fragile Bottom As CryptoQuant Warns of Bull Traps
Bitcoin (BTC) is entering another tense stretch, with CryptoQuant warning that the market’s supply-demand imbalance has sharpened in recent weeks and now looks less like a clean reset and more like the kind of messy deterioration that can trap late buyers. In its latest note, the analytics firm
BlockChainReporter1h ago
Did Donald Trump Just Kill Crypto Innovation? Here’s What Happened With Stablecoin Yield
The crypto market is reacting strongly to new political news, and this time it’s about stablecoin yield. Many traders believe a new draft of the U.S. Clarity Act could seriously limit how stablecoins generate returns, and that has already started to affect the market.
One of the biggest reacti
CaptainAltcoin1h ago
FTX Bankruptcy Liquidation's Unexpected Creation of a "Hedge Fund Harvesting Manual": Why Altcoins Lost to Bitcoin in Nearly Every Way from 2023-2025
FTX's bankruptcy liquidation created a new type of asset trading, where hedge funds achieve stable high returns by purchasing locked tokens at a discount and shorting them in the futures market, while retail investors become liquidity providers, leading to poor cryptocurrency market performance from 2023-2025. Bitcoin benefits from structural advantages due to its transparent supply and absence of locked tokens.
ChainNewsAbmedia1h ago
ETH SuperTrend Turns Green but $2,400 Stays Unbroken
_Ethereum’s daily SuperTrend flipped bullish for the first time since May 2024, but $2,400 resistance keeps blocking any real breakout attempt. Is ETH ready?_
Ethereum ran into a wall. Again. After weeks of grinding between $1,750 and $2,150, ETH finally broke above the range ceiling, pushed into t
LiveBTCNews1h ago
