Date: Fri, Dec 19 2025 | 12:45 PM GMT
The broader cryptocurrency market is showing relative strength despite concerns around the Japan rate hike. Cooling U.S. inflation has helped both Bitcoin (BTC) and Ethereum (ETH) hold in the green, and this stability is beginning to spill over into select altcoins, including Stellar (XLM).
XLM has posted modest gains today, but beyond the short-term price move, the daily chart is starting to reveal an emerging technical structure that could set the stage for a more meaningful recovery if key levels continue to hold.
Source: Coinmarketcap
Harmonic Pattern Signals Potential Upside
On the daily timeframe, XLM appears to be forming a Bearish Cypher harmonic pattern — a setup that often generates upside momentum during its final CD leg before price reaches the Potential Reversal Zone (PRZ).
The pattern began at point X near the $0.3113 region, where XLM topped out before entering a sharp corrective phase. Price then declined into point A, followed by a rebound toward point B. From there, XLM rolled over again and extended lower into point C around the $0.2029 area, completing the core structure of the pattern.
Since tagging this low, XLM has started to stabilize and grind higher, currently trading near the $0.2188 level. This slow but steady recovery suggests that selling pressure may be fading, with buyers beginning to defend the recent lows more aggressively.
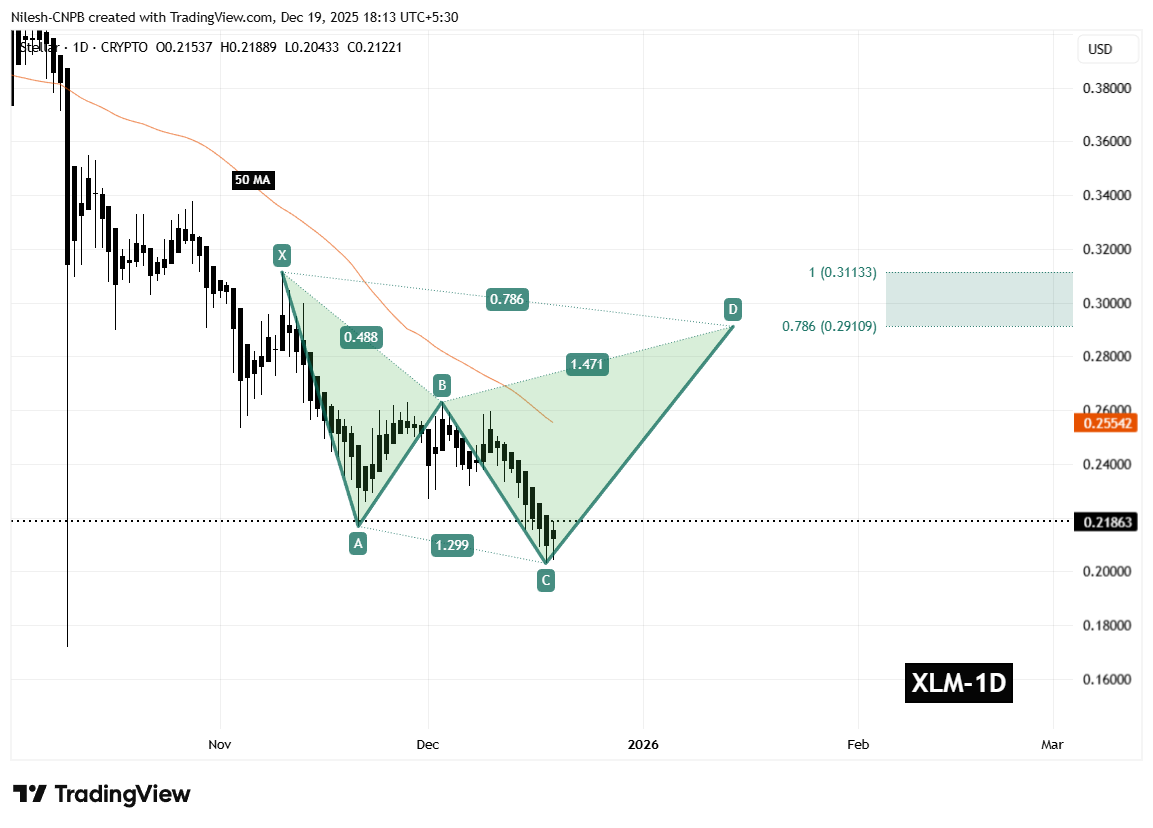
Stellar (XLM) Daily Chart /Coinsprobe (Source: Tradingview)
A key technical factor aligning with this structure is the 50-day moving average, currently positioned near $0.2554. This moving average has consistently acted as dynamic resistance throughout the downtrend and represents an important hurdle for bulls to overcome in the near term.
What’s Next for XLM?
In the short term, the most critical level to monitor is the C-leg support around $0.2029. As long as XLM holds above this zone, the harmonic pattern remains valid and the bullish CD-leg scenario stays intact.
If price continues to build strength from this base, the next major test will be a reclaim of the 50-day moving average near $0.2554. A decisive break and close above this level would signal improving momentum and could accelerate upside continuation.
Based on the harmonic structure, the projected upside targets sit within the Potential Reversal Zone, defined between the 0.786 Fibonacci extension near $0.2910 and the 1.0 extension around $0.3113. Reaching this zone would represent a potential upside of roughly 40–45% from current price levels, making it a key area where profit-taking or stronger resistance could emerge.
On the downside, failure to hold above the $0.2029 support would significantly weaken the bullish setup. A breakdown below this level could invalidate the harmonic structure and expose XLM to deeper downside pressure before any sustainable recovery attempt develops.
For now, the chart suggests Stellar is sitting at an important technical crossroads. While confirmation is still needed, the presence of a well-defined harmonic pattern indicates that a short- to medium-term bounce remains a realistic possibility if buyers continue to defend current levels and reclaim key resistance zones.
Disclaimer: The views and analysis presented in this article are for informational purposes only and reflect the author’s perspective, not financial advice. Technical patterns and indicators discussed are subject to market volatility and may or may not yield the anticipated results. Investors are advised to exercise caution, conduct independent research, and make decisions aligned with their individual risk tolerance.
Disclaimer: The information on this page may come from third parties and does not represent the views or opinions of Gate. The content displayed on this page is for reference only and does not constitute any financial, investment, or legal advice. Gate does not guarantee the accuracy or completeness of the information and shall not be liable for any losses arising from the use of this information. Virtual asset investments carry high risks and are subject to significant price volatility. You may lose all of your invested principal. Please fully understand the relevant risks and make prudent decisions based on your own financial situation and risk tolerance. For details, please refer to
Disclaimer.
Related Articles
Bitcoin Faces Crucial Supply Test – Understanding the URPD Cluster Near $73,000
The cryptocurrency industry is currently experiencing a very high psychological and technical level of consolidation. Most of the news relating to the market will typically focus on price movement. Well-established analysts are analyzing on-chain statistics to identify the current strength of the pr
BlockChainReporter20m ago
Market is overly panicked? MicroStrategy founder: Bitcoin has already hit bottom, and the quantum threat is needless worry
Michael Saylor asserts that Bitcoin has already finished bottoming at $60k, and he believes concerns about threats from quantum computers are overblown. He predicts that in the future, Bitcoin will become the core of a digital credit system, and he notes that there is limited selling pressure in the market, which could help drive the next bull cycle. Mizuho also has a positive assessment of the company’s future performance.
CryptoCity50m ago
$LINK and $PIPPIN Outshine AI Agent Projects By Social Activity
The article discusses the Top 10 AI Agent Projects in cryptocurrency based on social activity, revealing Chainlink ($LINK) as the leader. It highlights engagement and interaction metrics for various projects, indicating strong interest and demand in the market.
BlockChainReporter3h ago
Ethereum Network Activity Claims New ATH Indicating Bullish Divergence
The Ethereum network has reached a new all-time high in activity, signaling its growing utility beyond speculation. Factors like L2 scaling and DeFi are driving this surge, suggesting strong long-term growth potential for Ethereum ($ETH).
BlockChainReporter4h ago
FLOW Recovers From Prolonged Downtrend As Buy-Side Liquidity Builds, Triggering a Potental 22% Br...
The Flow (FLOW) coin is attracting investor interest as its on-chain market continues to pick up fresh momentum, according to a revelation disclosed today by financial analyst Crypto Patel. As per the data posted today, the cryptocurrency has developed a clear bull structure and is displaying a
BlockChainReporter4h ago
PEPE Price Holds Support as Bearish Bets Build Pressure
Key Insights:
PEPE price stabilizes near strong support despite sustained negative funding rates, highlighting a clear divergence between trader sentiment and actual market behavior.
Declining open interest and reduced liquidation activity indicate leverage reset, suggesting the market has c
CryptoNewsLand5h ago
