On Friday, the strong volatility wave of Bitcoin triggered widespread selling pressure in the market, causing Litecoin (LTC) to plummet by 7.5% within just 5 hours. This downward momentum pushed LTC to a new low at $72.64 before the coin attempted to recover. At the time of recording, LTC is trading around $75.89.
In the past two weeks of trading, Litecoin bulls have completely lost control of the important long-term support zone between $80–$84. Previously, a report from Coin Photon emphasized that this area plays a key role in maintaining LTC’s long-term price structure.
Notably, the report also pointed out that the bulls are weakening significantly, almost exhausted of momentum, and are only maintaining a defensive stance. Even with Litecoin being included in the Bitwise 10 Crypto Index ETF (BITW), it was not enough to generate a significant boost to the price on the trading chart.
Assessing the strength of Litecoin’s next downward trend
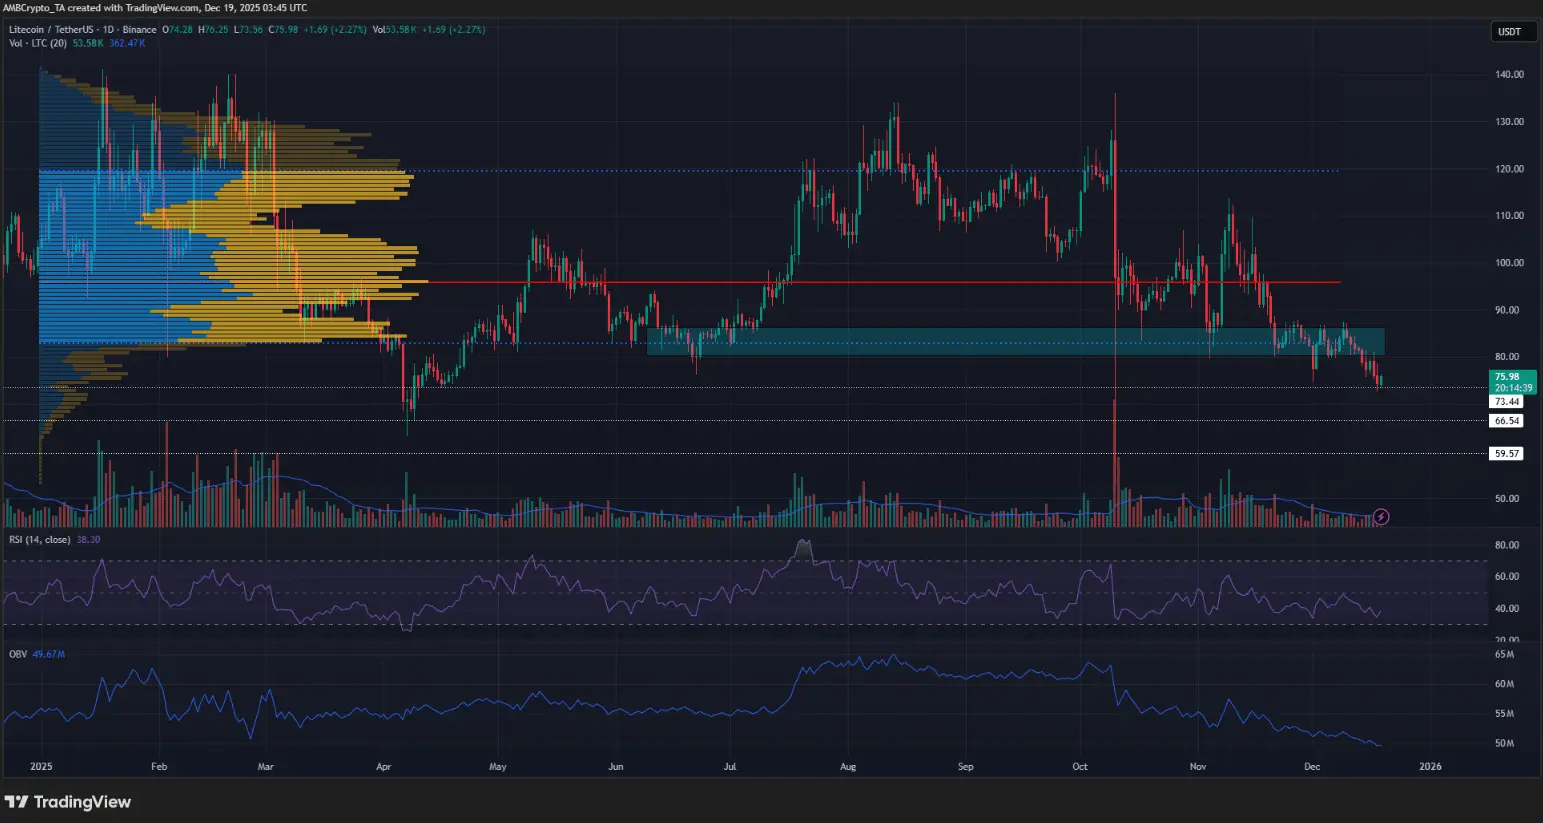 Daily LTC/USDT chart | Source: TradingView Using the Fixed Range Volume Profile tool for the entire 2025, the Value Area High (VAH) and Value Area Low (VAL) are identified at $120 and $83 respectively. After the first week of October, when Litecoin continued trading above the year’s VAH, the market experienced a sharp decline on October 10, marking an important turning point in the trend structure.
The OBV (On-Balance Volume) indicator shows that the supply-demand balance at that time had clearly tilted in favor of the bears, reflecting overwhelming selling pressure. In November, Litecoin entered a period of high volatility and attempted to defend the psychological support zone of $80, but weak demand was insufficient to reverse the downward trend forming.
When the $80 level was officially broken, the situation became more unfavorable for the bulls. The next long-term support zones that the bears might target are at $73.4, $66.5, and deeper at $59.6.
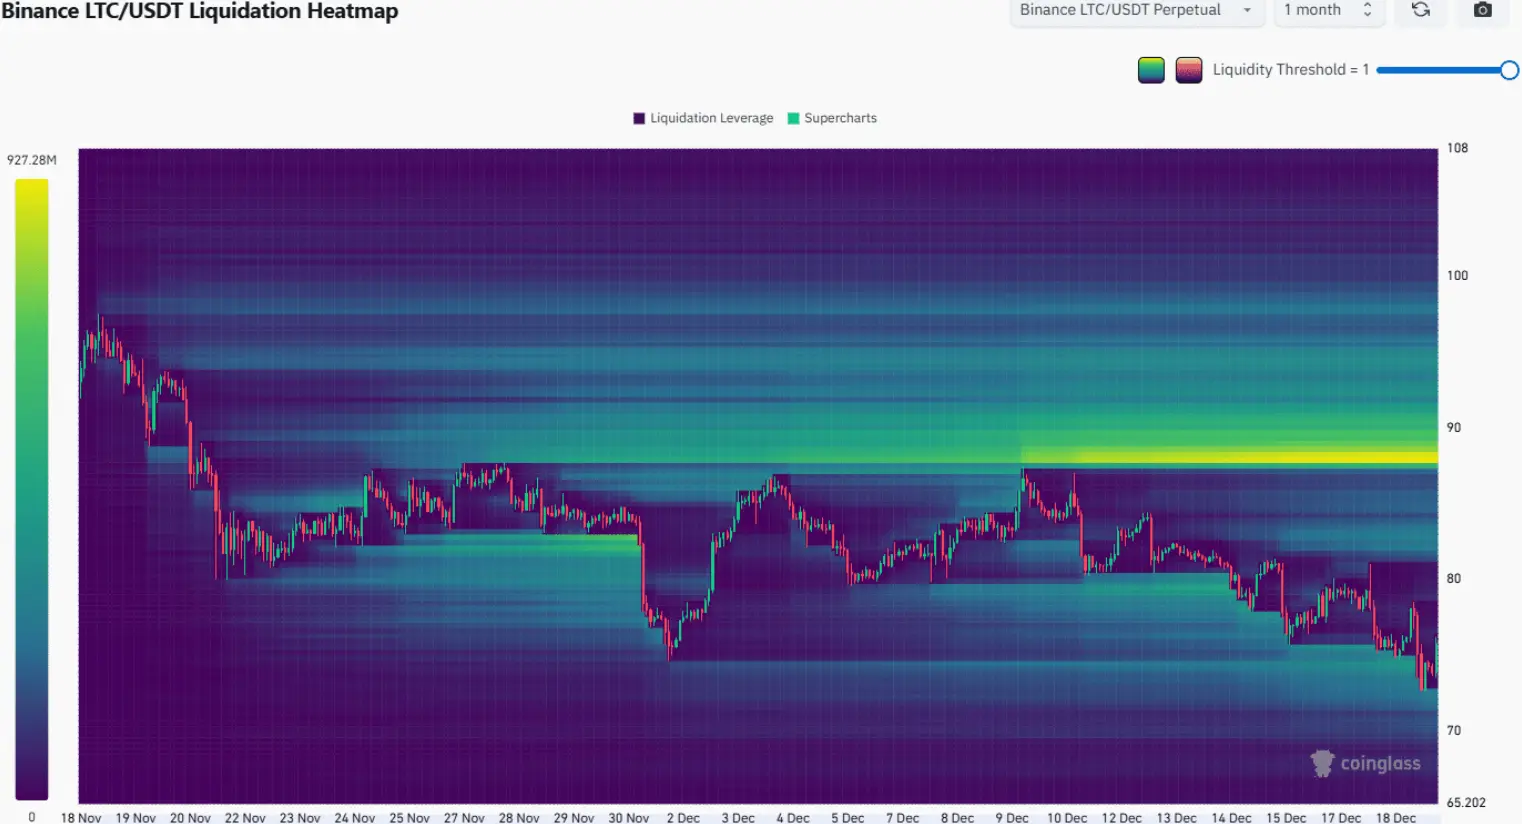 Source: CoinGlass Notably, the monthly liquidation heatmap shows that the liquidity around the $73 zone has been wiped out. In this context, a technical rebound could occur, and the price is likely to be pulled back toward the “magnet” zone of $82–$83, where supply and demand may continue to struggle in the short term.
Less likely scenarios for Litecoin
This is a notable bullish scenario. The $88 zone currently acts as a “liquidity magnet,” where a large concentration of short position liquidations (Short) is focused, potentially attracting the price gradually toward this area. If the overall market sentiment turns positive, triggering a chain reaction of short squeeze effects, LTC could break above $90, thereby reaffirming and strengthening the medium-term bullish trend.
Trader recommendations – Continue to maintain a bearish outlook
This altcoin has just lost a key support zone, signaling a clear market weakening. The main trend and price structure remain entirely bearish, while buying pressure on higher timeframes is almost absent, indicating that the bulls are not yet strong enough to regain control.
In a recovery scenario, the $80–$84 zone is likely to serve as a very strong resistance area that is difficult to conquer. Therefore, traders may consider short-selling on rebounds, with target prices around the support zones of $66 and deeper at $59.
Disclaimer: The information on this page may come from third parties and does not represent the views or opinions of Gate. The content displayed on this page is for reference only and does not constitute any financial, investment, or legal advice. Gate does not guarantee the accuracy or completeness of the information and shall not be liable for any losses arising from the use of this information. Virtual asset investments carry high risks and are subject to significant price volatility. You may lose all of your invested principal. Please fully understand the relevant risks and make prudent decisions based on your own financial situation and risk tolerance. For details, please refer to
Disclaimer.
Related Articles
DOGE Defends Key Support While On-Chain Activity Increases
DOGE active addresses jumped 28% in one week, showing growing network engagement.
Price holds critical levels near $0.0912–$0.0928 despite minor dips.
Breaking above $0.0930 could target $0.0950, $0.0980, and potentially $0.10.
Dogecoin — DOGE, has shown interesting movements this week,
CryptoNewsLand42m ago
Is Bitcoin mispricing a prolonged Iran war? Ex-hedge fund manager weighs in
James Lavish warns Bitcoin holders that continued conflict in Iran could trigger inflation and market downturns. While Bitcoin may face further declines, he sees potential long-term opportunities. He discusses the impact of global economic pressures on investments.
Cointelegraph1h ago
10x Research: Tether’s USDT issuance on Ethereum surpasses Tron—ETH could become the main beneficiary of stablecoin growth
10x Research noted that over the past five years, Ethereum (ETH) has performed lackluster, with its price trading around $2,000, mainly due to weak on-chain activity leading to insufficient demand. After falling 57% from its 2025 peak, ETH’s current valuation remains low, while capital accumulation is still ongoing; USDT’s issuance has surpassed Tron, sparking discussion that ETH could become a leading beneficiary of stablecoin growth. Analysts are now re-evaluating ETH’s potential turning point.
GateNews1h ago
Bitcoin Holds Steady Near $67K Amid Bullish and Geopolitical Tension
This weekend, Bitcoin ($BTC) has shown a steady performance in line with a blend of technical and geopolitical outlook. In this respect, Bitcoin ($BTC) is changing hands at $67K with significant support levels at $64K and $65K and notable resistance at $74K. As per the data from CRYPTO Damus, the
BlockChainReporter1h ago
XRP Trading Volume Drops by 50% as the Altcoin Records Six Consecutive Red Monthly Closes
XRP trading volume drops by 50%, feeding bearish expectations.
The altcoin records six consecutive red monthly closes.
Could this be the longest coil for XRP before the biggest launch?
The crypto community is disheartened to see the
CryptoNewsLand4h ago
VanEck Research Head: BTC derivatives protection demand hits the 99th percentile, releasing a contrarian long setup signal
VanEck research chief Matthew Sigel noted that protective demand in the Bitcoin derivatives market has reached a historical high, suggesting the market may be suitable for establishing long positions. At the same time, he warned that high spending in the AI sector without returns could put pressure on the market.
GateNews4h ago
