Bitcoin (BTC) is still being “held back” within a narrow trading range from $89,260 to $94,588, clearly reflecting intense struggle but lacking the momentum for a breakout between the bulls and bears. Market predictions indicate that confidence in the bulls regaining control soon remains fragile, with only a 30% chance that BTC will reach $100,000 before January 1.
According to cryptocurrency analyst Darkfost, Bitcoin’s recovery is being restrained by a lack of new liquidity, especially from stablecoins. This suggests the cryptocurrency market needs a fresh wave of sufficiently strong liquidity if BTC is to establish a sustainable upward trend.
Conversely, some experts offer a less optimistic scenario, suggesting BTC risks breaking through its nearest support around $80,600. Trader Roman stated on X that Bitcoin is likely to retreat further to the $76,000 zone, emphasizing that interest rate cuts alone are unlikely to reverse the current weakening trend.
In this context, what are the key support and resistance levels that investors should monitor for BTC and top altcoins? Let’s delve into the charts of the 10 largest cryptocurrencies to find answers.
Technical Analysis of BTC
BTC’s recovery is facing resistance at the 50% Fibonacci retracement level at $94,050, indicating that bears remain active at higher price levels.
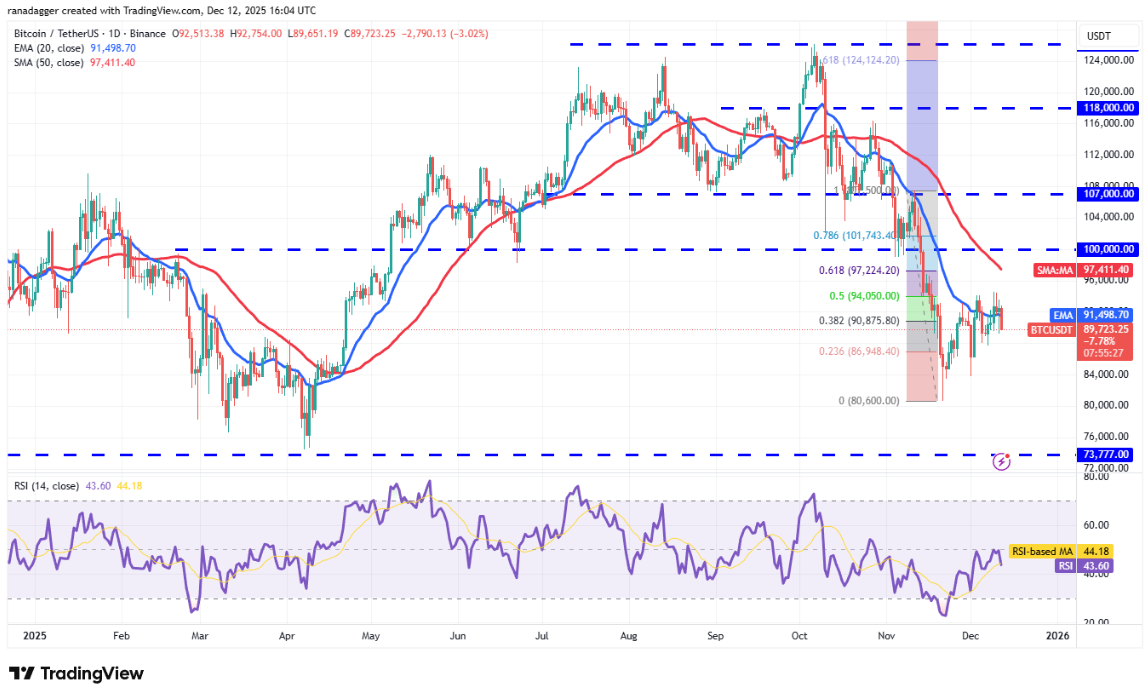 Daily BTC/USDT Chart | Source: TradingView Support levels currently sit at $87,700, then $84,000. If the price breaks below $84,000, it opens the door for a retest of the November 21 low at $80,600.
Bulls need to push the price above the resistance at $94,050 to signal strength. If successful, BTC/USDT could rise to the 50-day simple moving average (SMA) at $97,411.
The upward movement is expected to face significant selling pressure between the 50-day SMA and the psychological level of $100,000. A daily close above $100,000 would confirm that the bulls have re-entered the game.
Technical Analysis of ETH
Ether (ETH) started declining from the $3,350 level on Thursday, with bears attempting to keep the price below the 20-day exponential moving average (EMA) at $3,125.
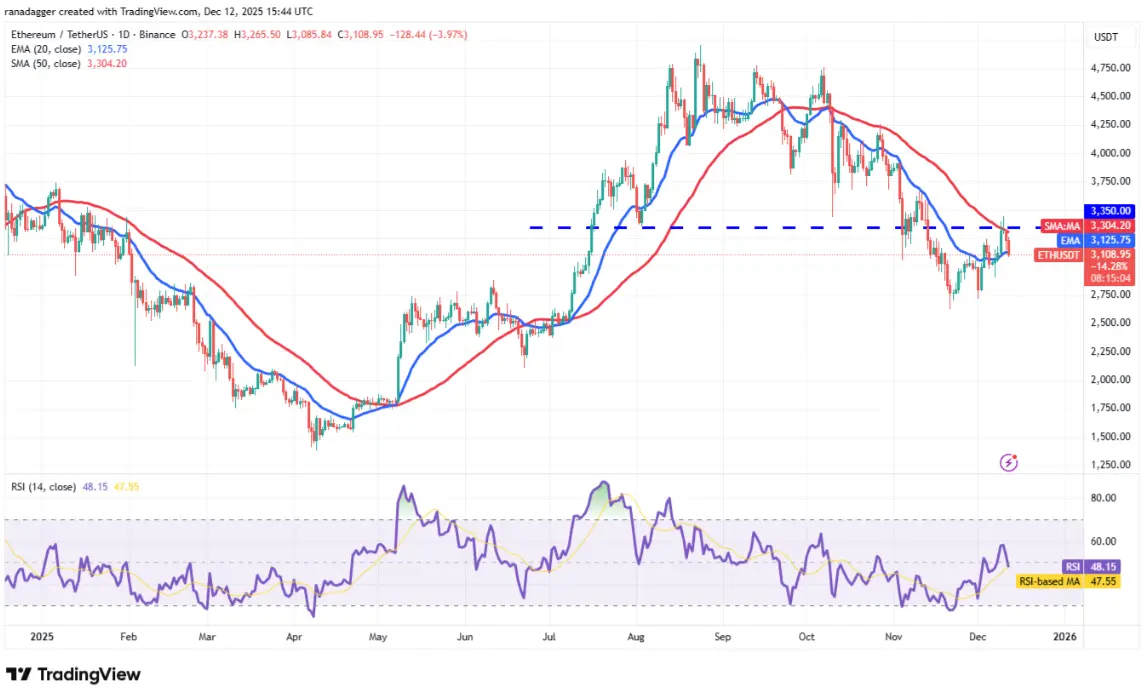 Daily ETH/USDT Chart | Source: TradingView If this occurs, it indicates that bears are selling on every recovery. ETH could then drop to $2,907, then to $2,716. ETH/USDT might resume its downtrend if it closes below $2,623.
Conversely, if the price rebounds from the current zone and breaks above $3,350 resistance, it signals the start of a new uptrend. The pair could then rise to $3,918 and subsequently to $4,250.
Technical Analysis of BNB
BNB has been trading around the 20-day EMA at $892 for several days, suggesting a balance between buyers and sellers.
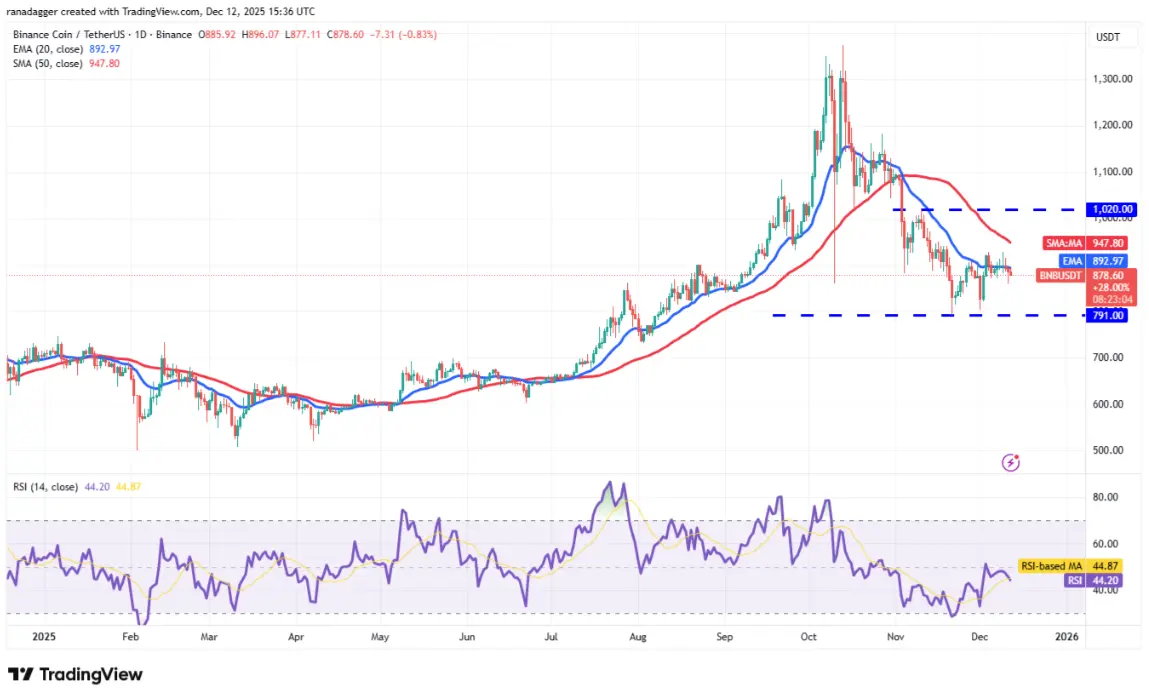 Daily BNB/USDT Chart | Source: TradingView The sideways movement of the 20-day EMA along with RSI just below the neutral mark indicates that the price may remain range-bound between $791 and $1,020 in the near term.
Bears need to push BNB below $791 to initiate the next decline. This could lead to a drop toward $730. On the other hand, a daily close above $1,020 would suggest the correction may be over, and the price could rise to $1,182, a likely resistance zone.
Technical Analysis of XRP
XRP remains trapped within a descending channel pattern, showing that bears are in control of the trend.
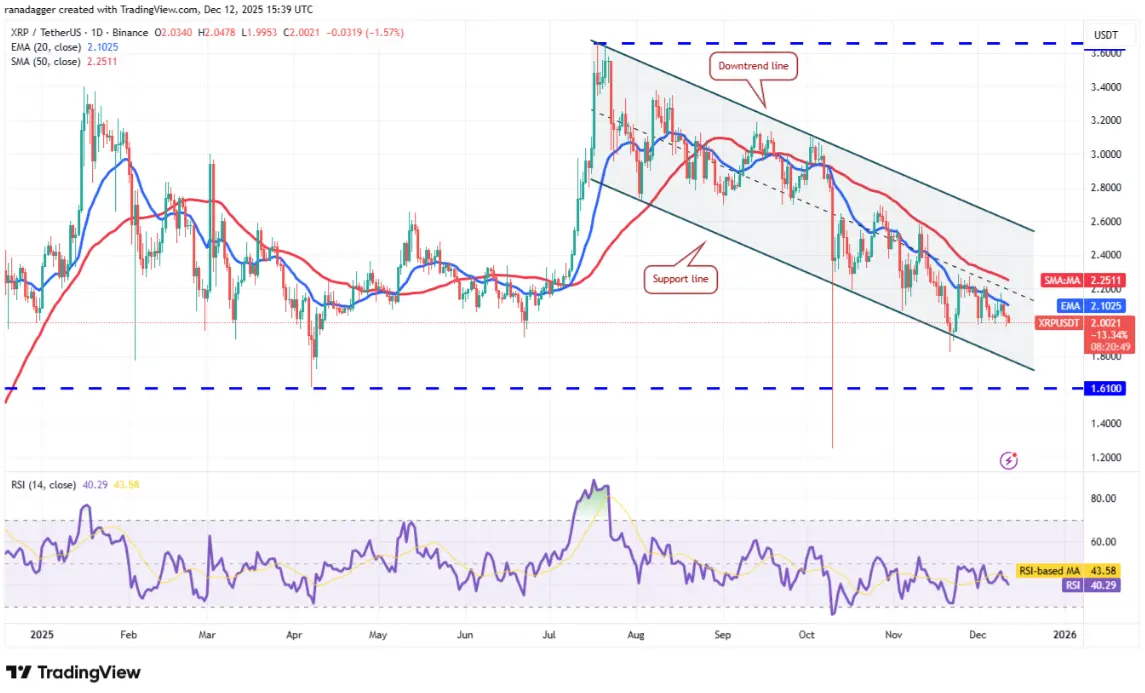 Daily XRP/USDT Chart | Source: TradingView Bulls need to push XRP above the 50-day SMA at $2.25 to send a positive signal. This could lead to an upward move back toward the descending trendline, a key technical level to watch. A daily close above this downtrend would confirm that the bulls have regained control.
Conversely, bears need to drag the price below $1.98 to open the way for a decline toward the support level, then the critical $1.61 mark.
Technical Analysis of SOL
The long wick on Solana’s (SOL) Thursday candle indicates that bulls are defending the $126 zone aggressively.
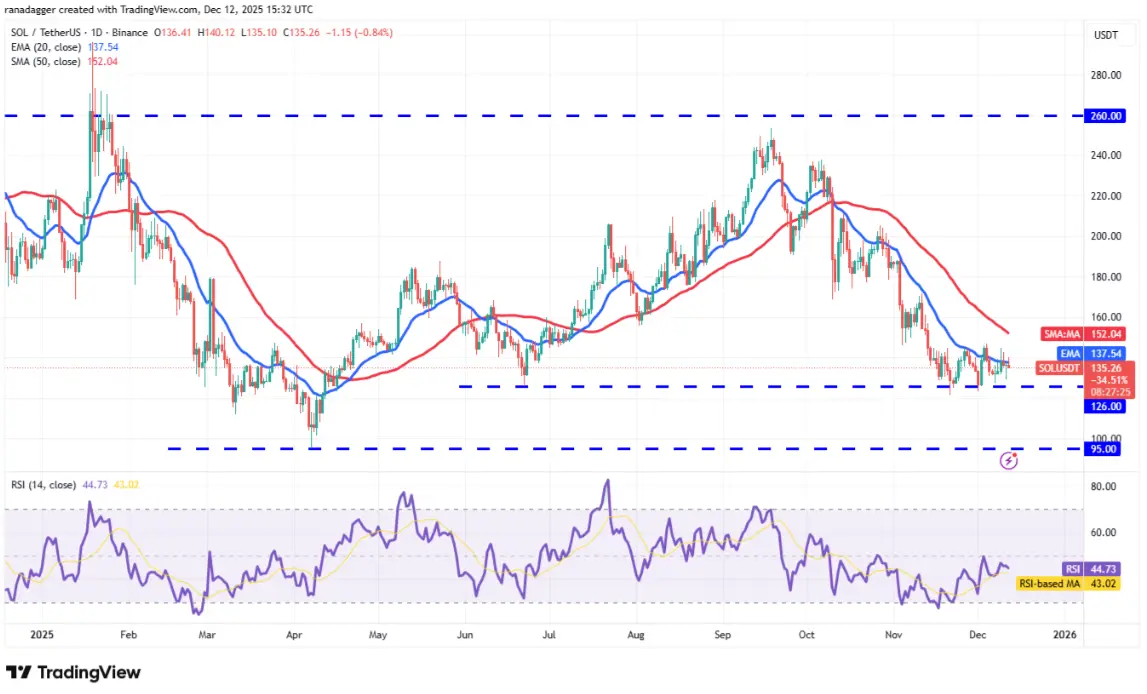 Daily SOL/USDT Chart | Source: TradingView To signal a potential trend change in the short term, bulls need to push SOL above the 50-day SMA at $152. This could lead to a move toward $172 and then toward $190.
A break and close below $126 would confirm the continuation of the downtrend, with a possible decline to $100 and then the strong support zone at $95.
Technical Analysis of DOGE
Dogecoin (DOGE) reversed from the 20-day EMA at $0.14 on Wednesday, indicating that bears are selling on every minor rebound.
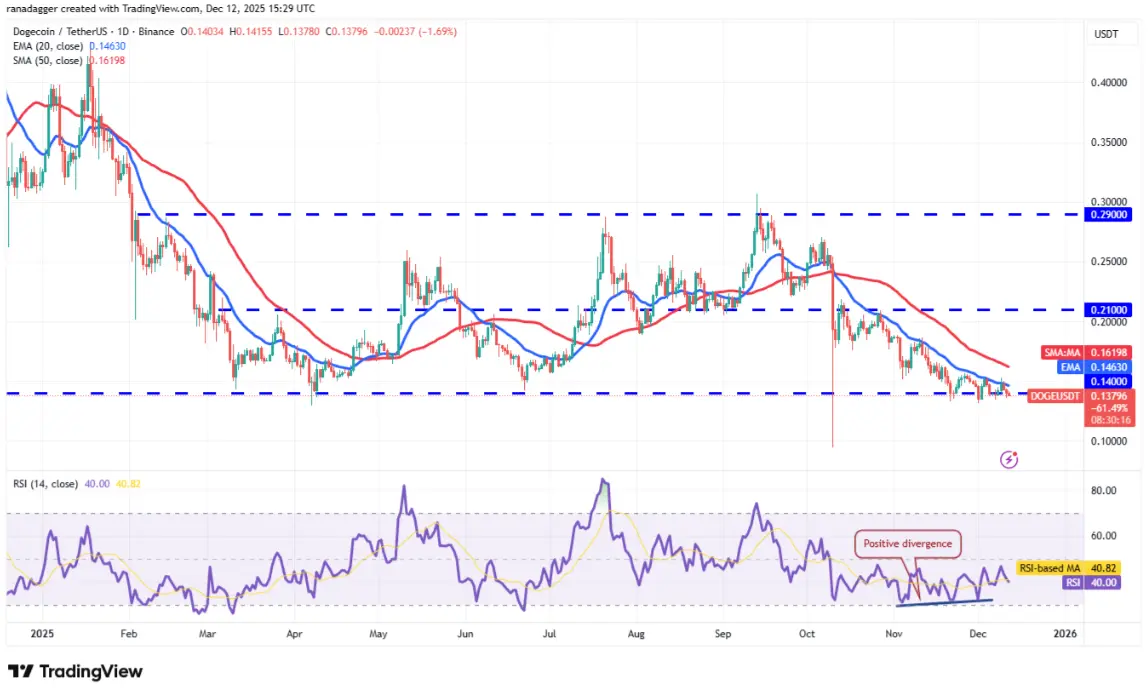 Daily DOGE/USDT Chart | Source: TradingView If the price continues downward and closes below the support zone at $0.13, it would confirm the start of a new decline. Dogecoin could then fall to the October 10 low at $0.10, where buying interest is expected to emerge.
The first sign of strength would be a break and close above the 20-day EMA, showing that bulls are defending the $0.14 level strongly. This could push DOGE toward the 50-day SMA at $0.16, then possibly to $0.19.
Technical Analysis of ADA
Cardano (ADA) reversed from the breakout level at $0.50 on Wednesday, indicating bears are trying to turn this zone into resistance.
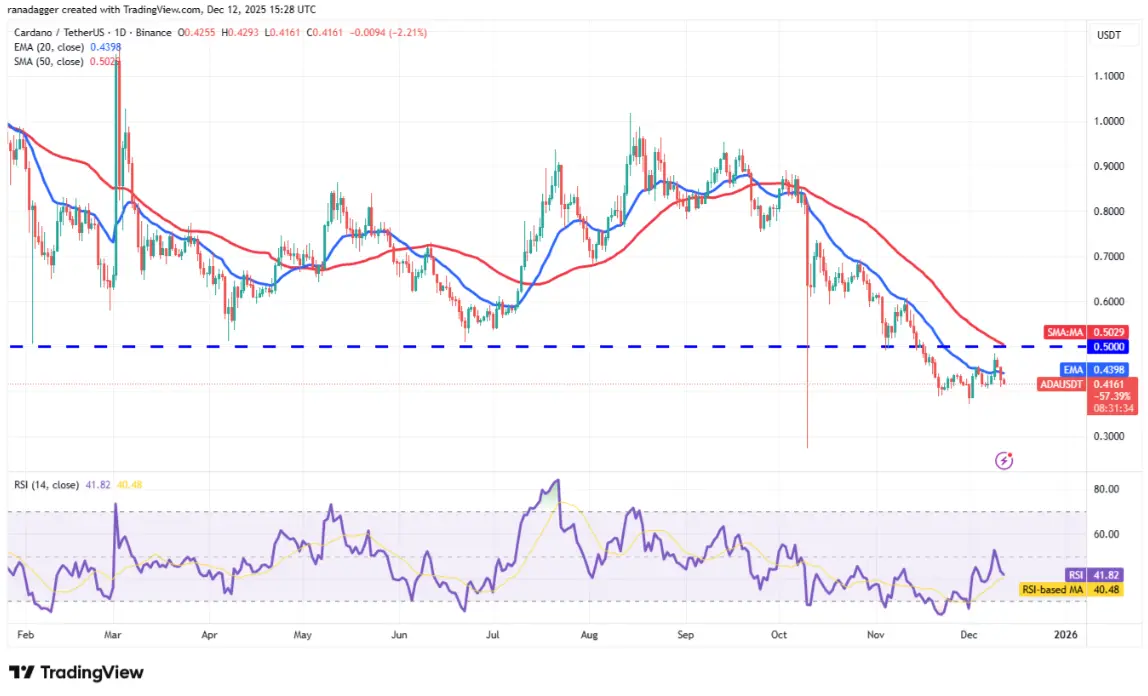 Daily ADA/USDT Chart | Source: TradingView The 20-day EMA is sideways at $0.44, with RSI in the negative zone, suggesting bears hold a slight advantage. Support levels are at $0.40 and then $0.37. A move below $0.37 could push ADA/USDT sharply down to $0.31 and even the October 10 low at $0.27.
Bulls need to push and maintain above $0.50 to signal a recovery. If successful, the pair could rise to $0.60 and then to $0.70.
Technical Analysis of BCH
Bitcoin Cash (BCH) bounced from the 20-day EMA at $560 on Thursday, reflecting a bullish market sentiment.
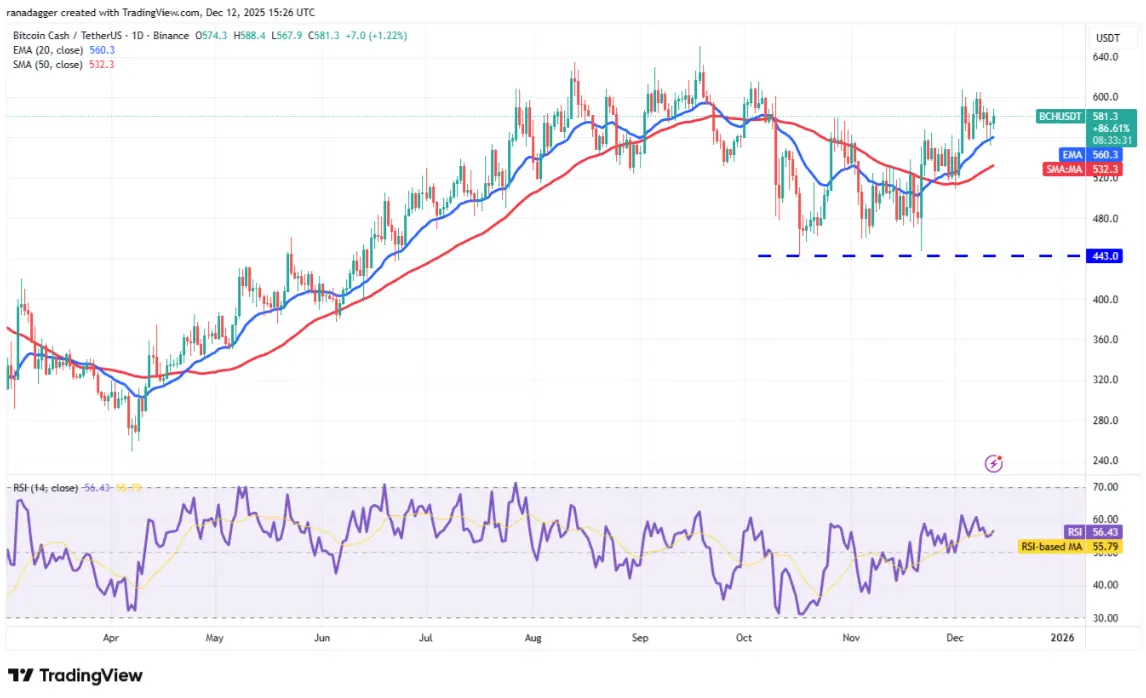 Daily BCH/USDT Chart | Source: TradingView Bulls will attempt to push BCH above $607 and challenge the resistance zone at $651. The bears are likely to defend the $651 level strongly, but if it’s broken, a rally toward $720 could ensue.
Conversely, bears need to pull the price below the moving averages to regain advantage. Doing so would suggest BCH/USDT may fluctuate within a range from $607 down to $443 over some time.
Technical Analysis of HYPE
Bears attempted to push Hyperliquid (HYPE) lower on Thursday, but the long wick indicates buying pressure from bulls.
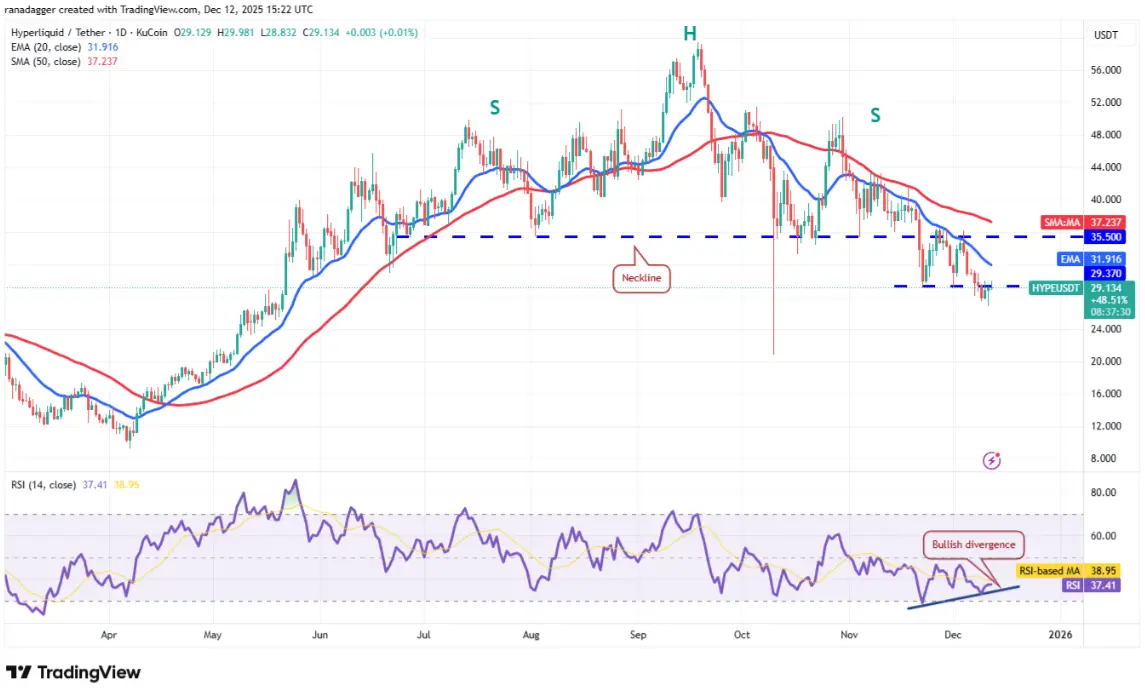 Daily HYPE/USDT Chart | Source: TradingView The HYPE/USDT pair could move toward the 20-day EMA at $31.91, an important level to watch. A sharp reversal from this level would suggest that the bears are regaining control, and the downtrend could continue.
On the other hand, a breakout and close above the 20-day EMA would indicate weakening selling pressure. This could push HYPE toward the 50-day SMA at $37.23. A daily close above this level would signal that the correction phase may be over.
Technical Analysis of LINK
Chainlink (LINK) is currently trading around $13.64 and has been oscillating between moving averages for several days, reflecting a balance between supply and demand.
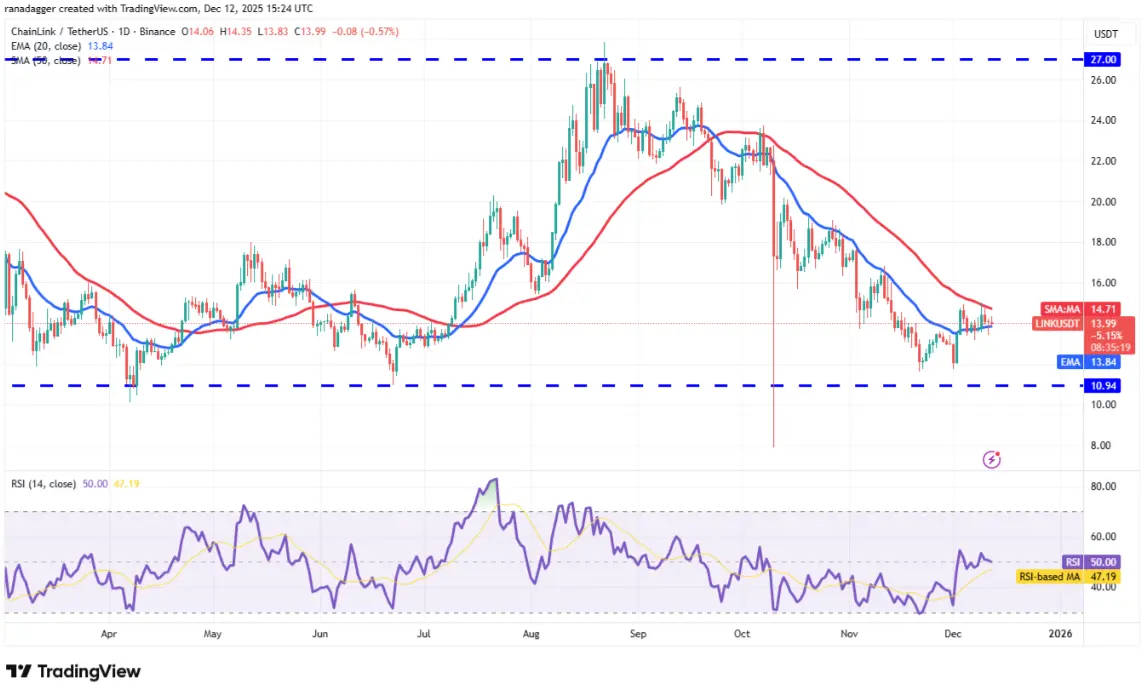 Daily LINK/USDT Chart | Source: TradingView This narrow trading range is likely to be followed by an expansion breakout. If the price breaks above the 50-day SMA at $14.71 and closes, it would indicate that bulls have overtaken bears. Then, LINK/USDT could rise to $19.06.
Alternatively, if the price drops sharply below the 20-day EMA at $13.84, it would show that bears are still in control. In that case, LINK could fall toward strong support at $10.94, where buying interest is expected to emerge.
