Zcash (ZEC) extended its recovery on Tuesday, rising 10.29% in the past 24 hours to over $425, or 41.50% up from the lows of around $300 just a week ago.
Key takeaways:
- ZEC eyes $500 as double-bottom signals and whale accumulation support the recovery.
- Bear-flag risks persist, with overbought RSI hinting at a possible pullback toward $260–$280.
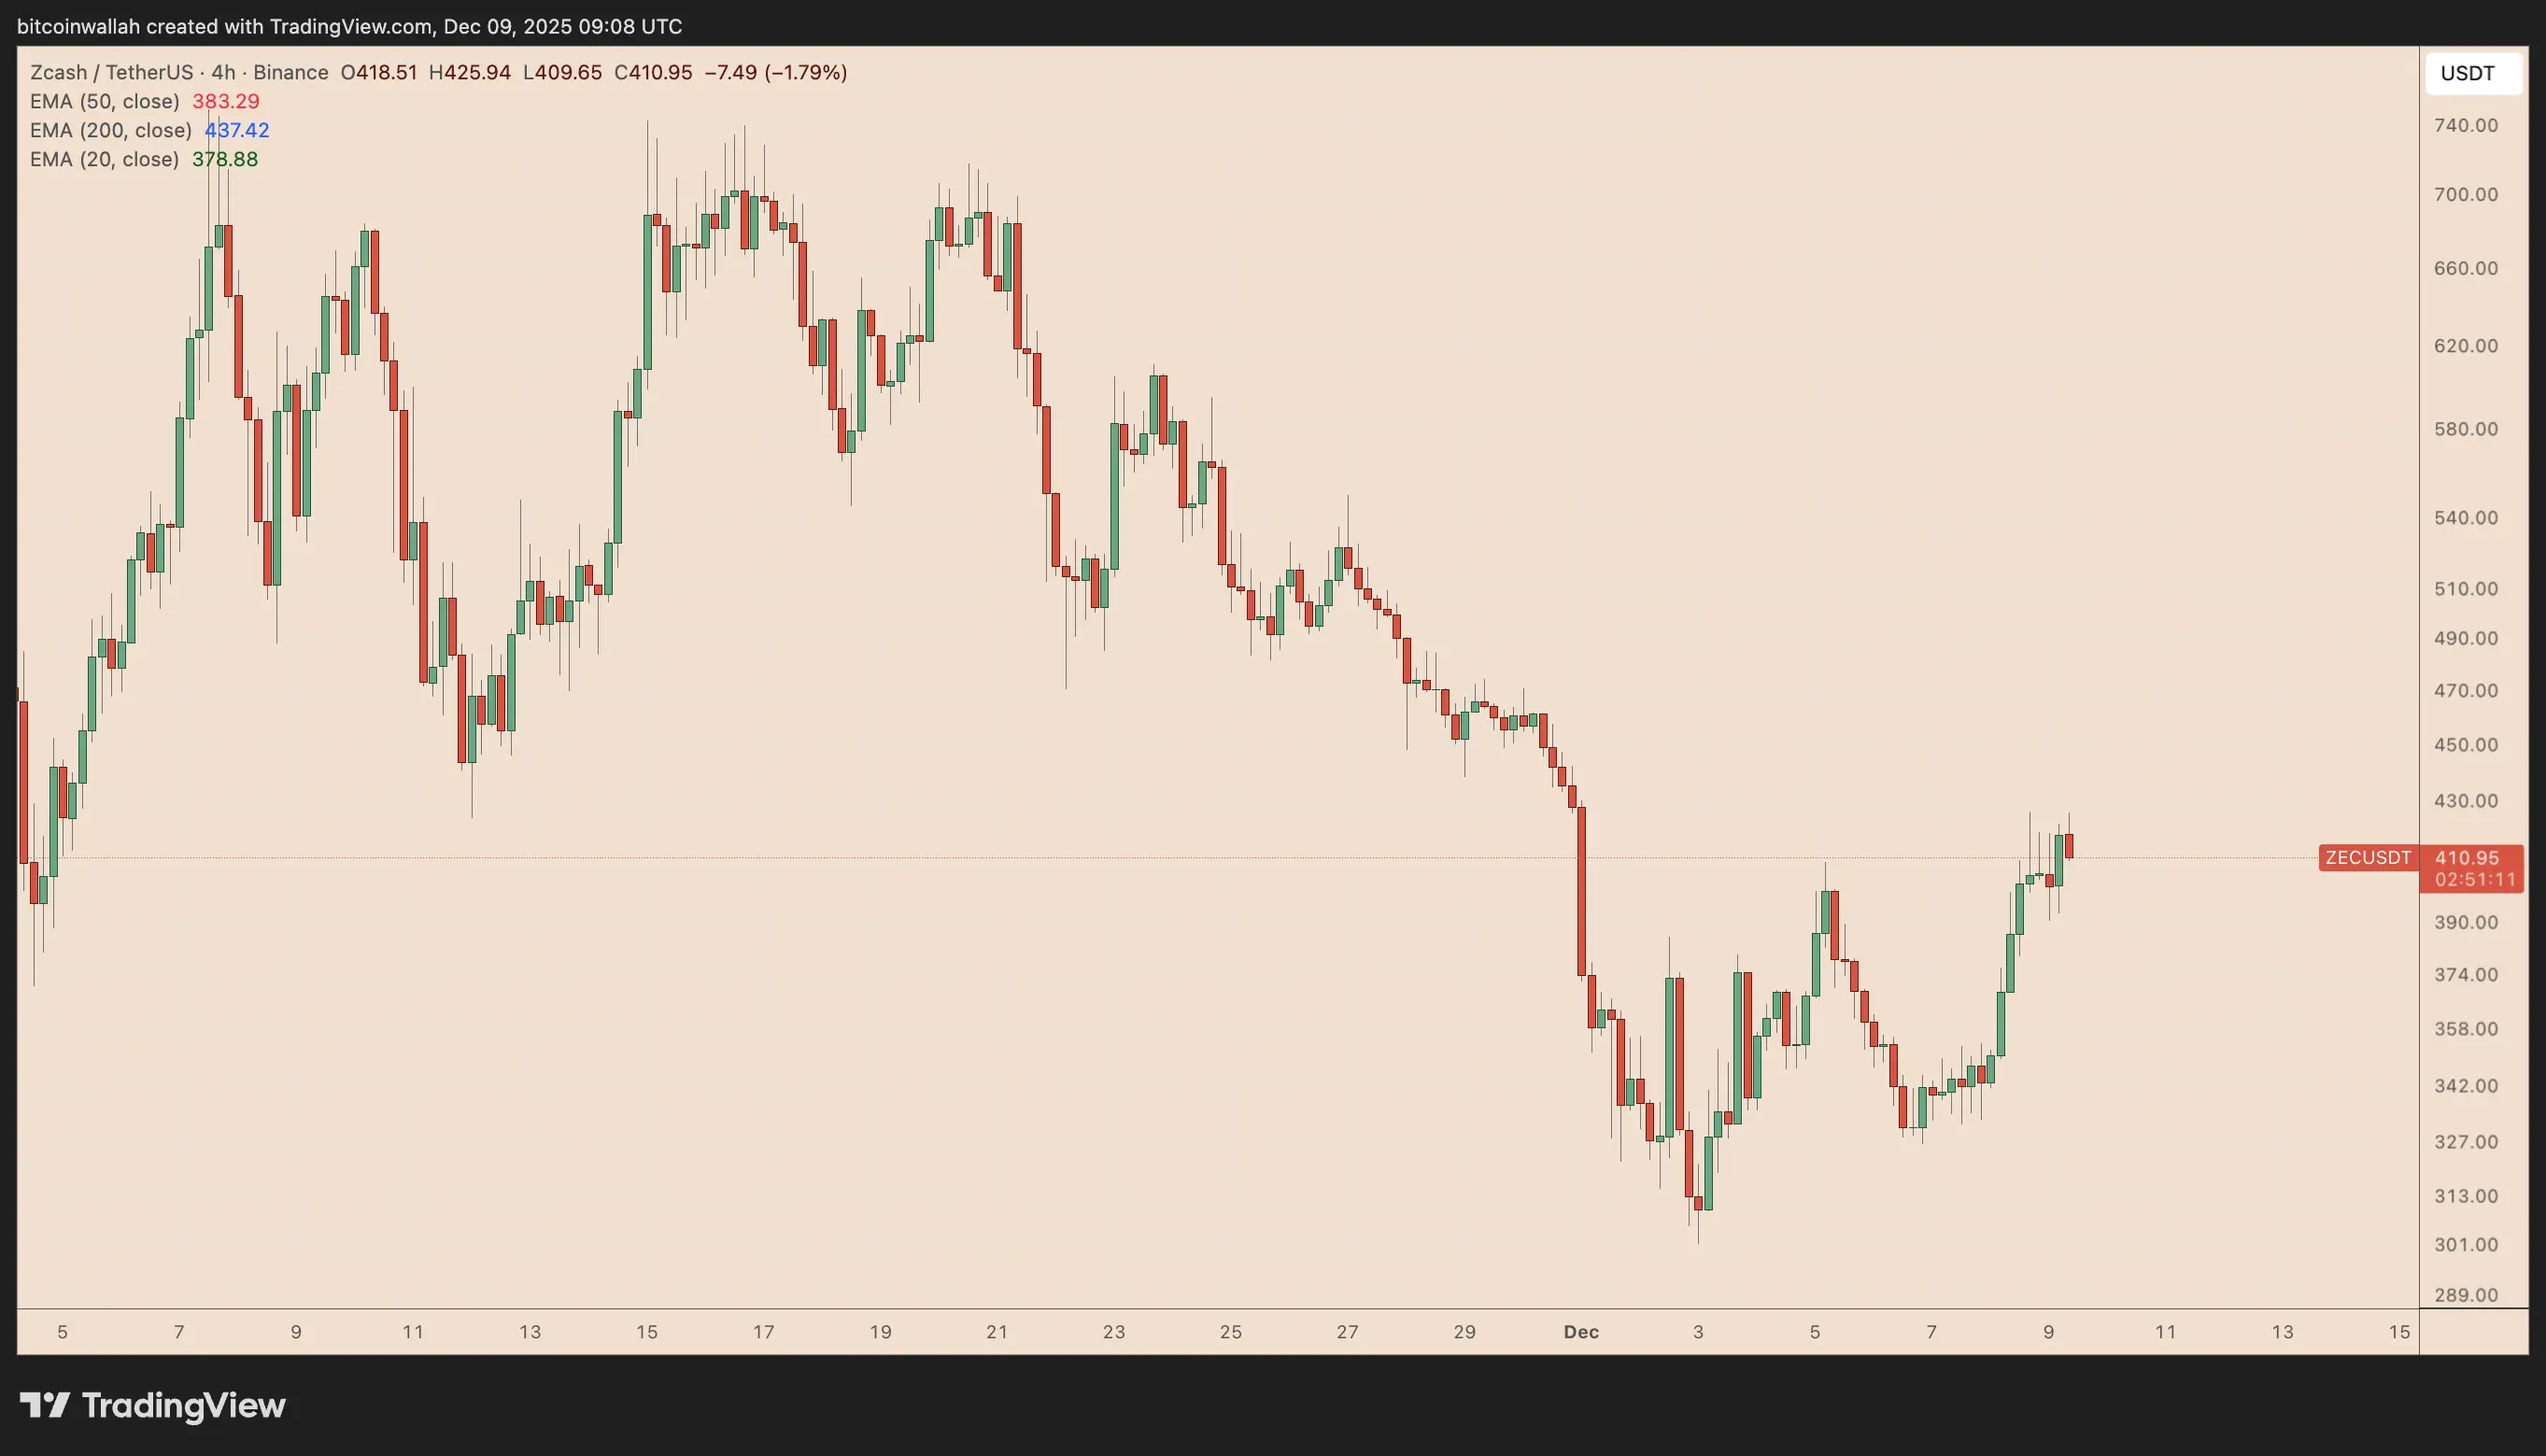 ZEC/USDT four-hour price chart. Source: TradingViewThe sharp rebound prompted some analysts to anticipate a further rally to or above $500 in the coming days.
Can Zcash retest the psychological resistance?
From double bottom to $500 ZEC next?
Trader Goomba identified Zcash’s recent swing lows as a potential double-bottom structure.
The pattern appeared to develop in the $300–$310 region, where ZEC recorded two similar troughs within a short time frame. The subsequent move above the interim resistance near $380 marked what the trader described as a neckline breakout.
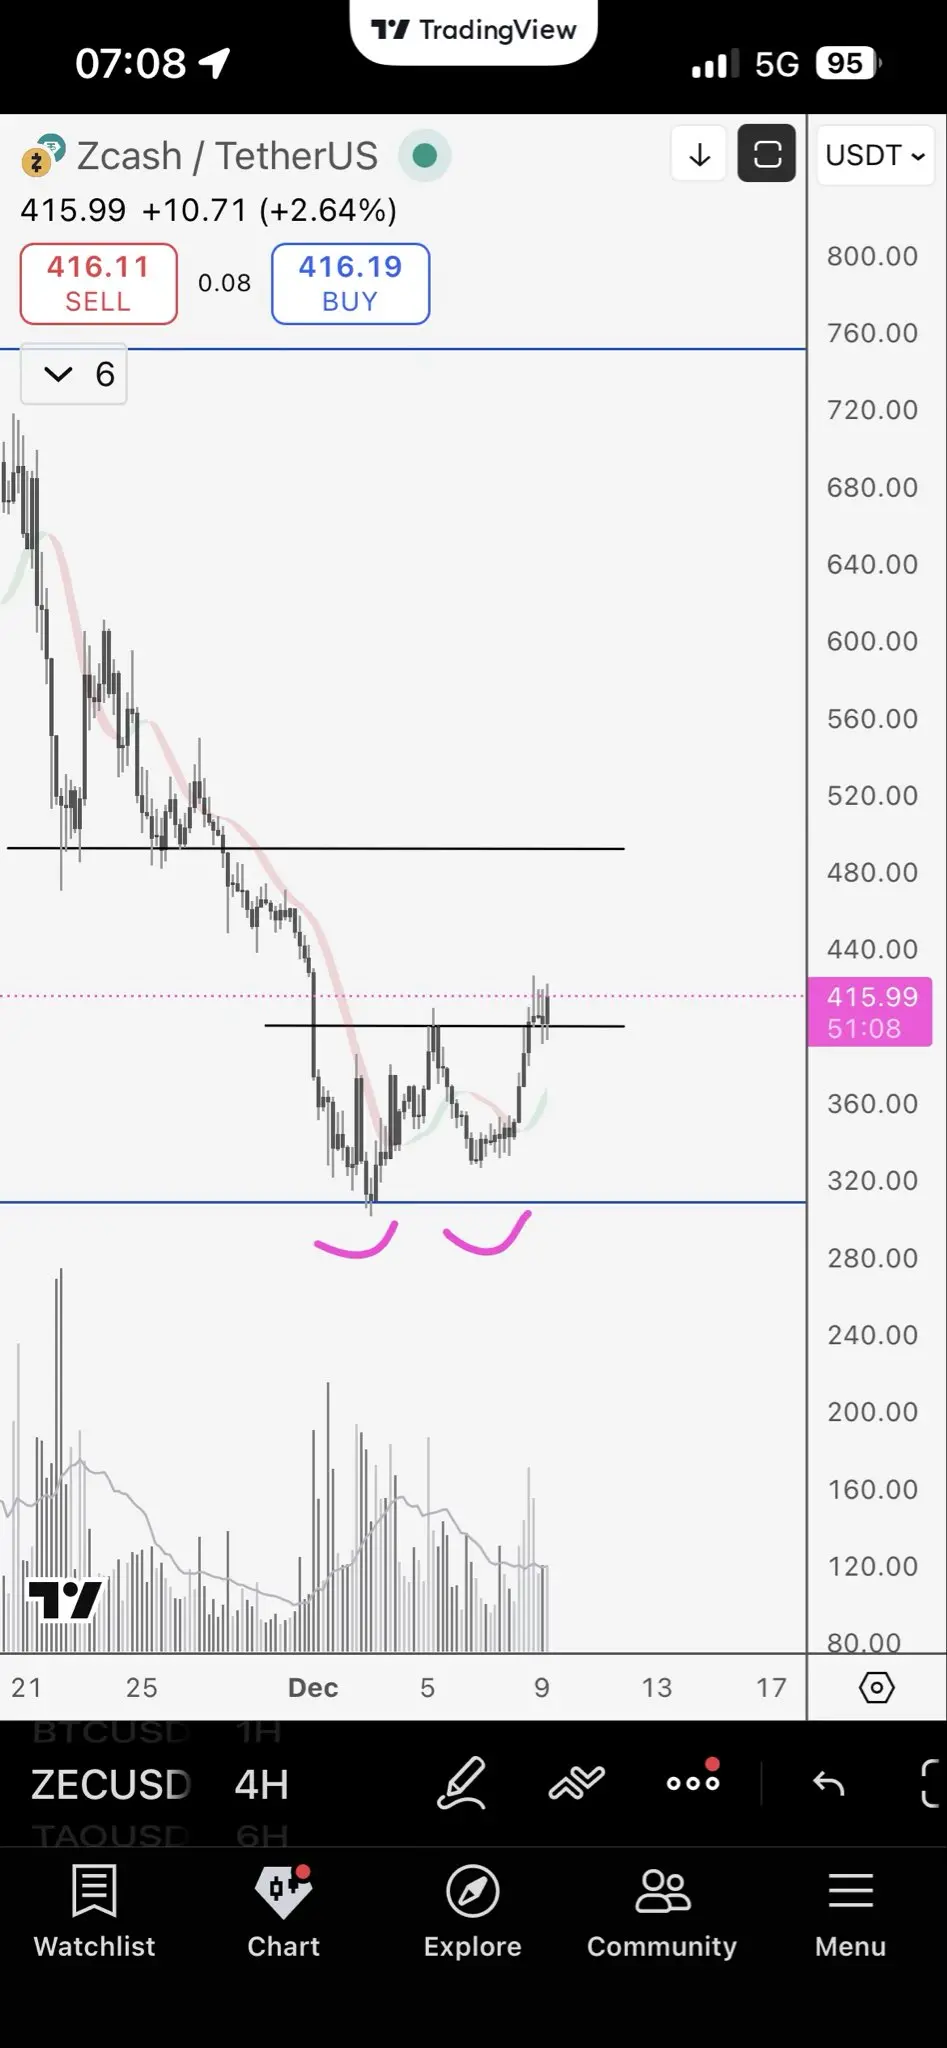 ZEC/USDT daily price chart. Source: TradingView/Goomba Such formations carry a measured objective that places the next notable target in the $480–$500 range, coinciding with a previous supply zone.
Goomba noted that the structure remained valid as long as ZEC held above the reclaimed neckline level.
Zcash whales are absorbing selling pressure
ZEC’s retail holders ($0–$1,000) and mid-sized traders ($1,000–$100,000) cut more than $30 million in net exposure during the latest rebound, according to data highlighted by trader Ardi.
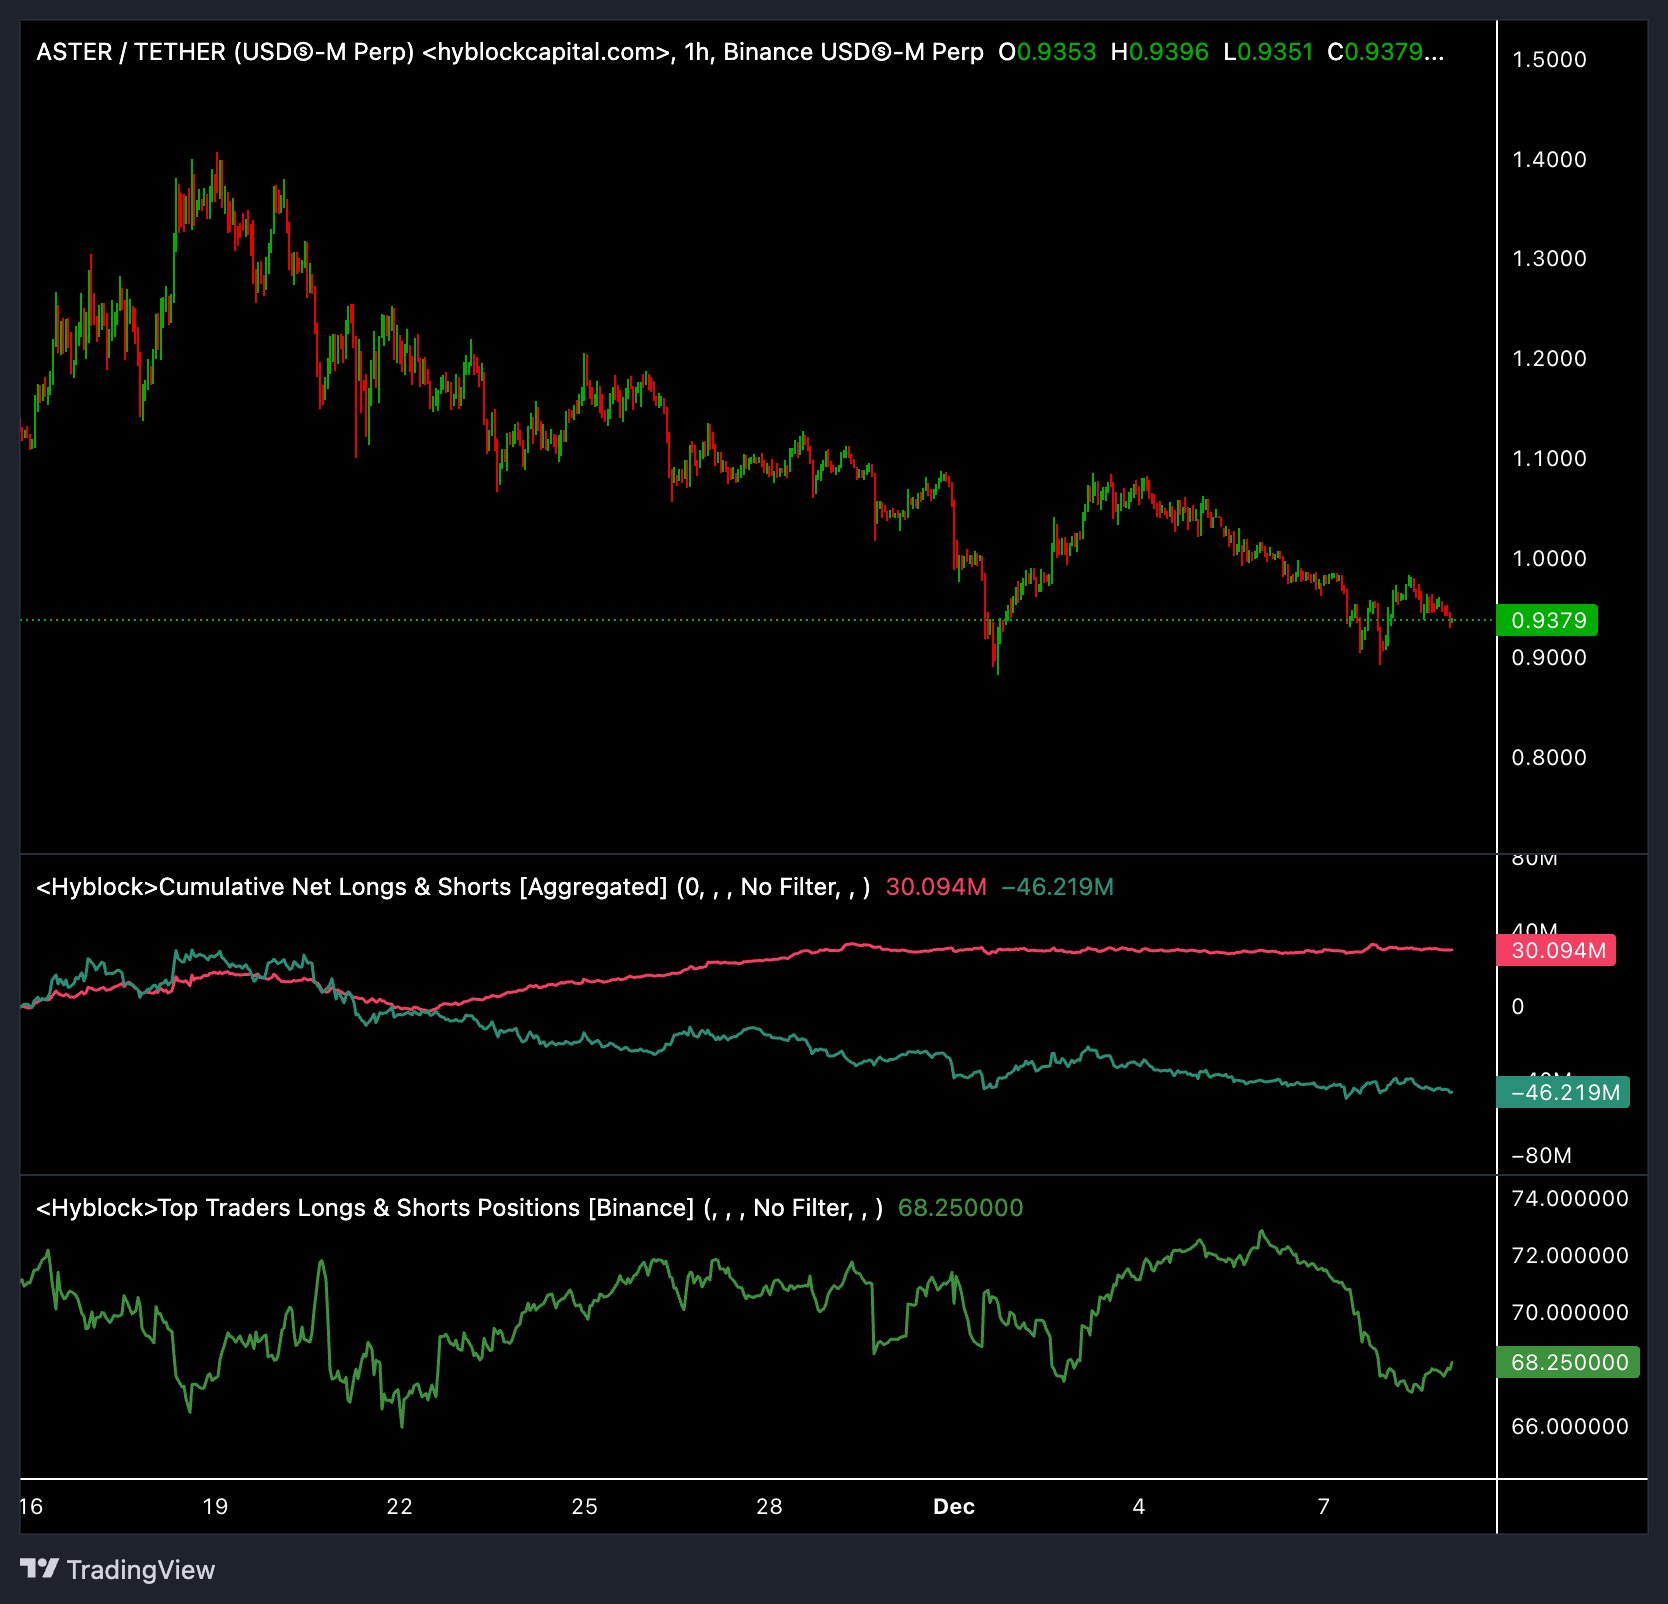 ZEC/USDT hourly chart. Source: TradingView/ArdiIn contrast, larger whale accounts ($100,000–$10 million) added over $100 million in the same period, suggesting a divergence in behavior.
Simply put, smaller participants appeared to sell into the rally while higher-capital accounts increased their exposure.
Related: What’s behind the surge in privacy tokens as the rest of the market weakens?
That raises ZEC’s potential to continue its rebound toward the $500 level, given that the larger investors are looking forward to higher prices.
Bear flag may spoil party for ZEC bulls
Zcash’s latest rebound unfolded inside what still appeared to be a classic bear flag pattern, a weakening relief channel that formed after a steep November sell-off.
Historically, these rising channels resolved to the downside, and ZEC’s failure to hold above the flag’s upper trendline suggested that sellers were already regaining control as of Tuesday.
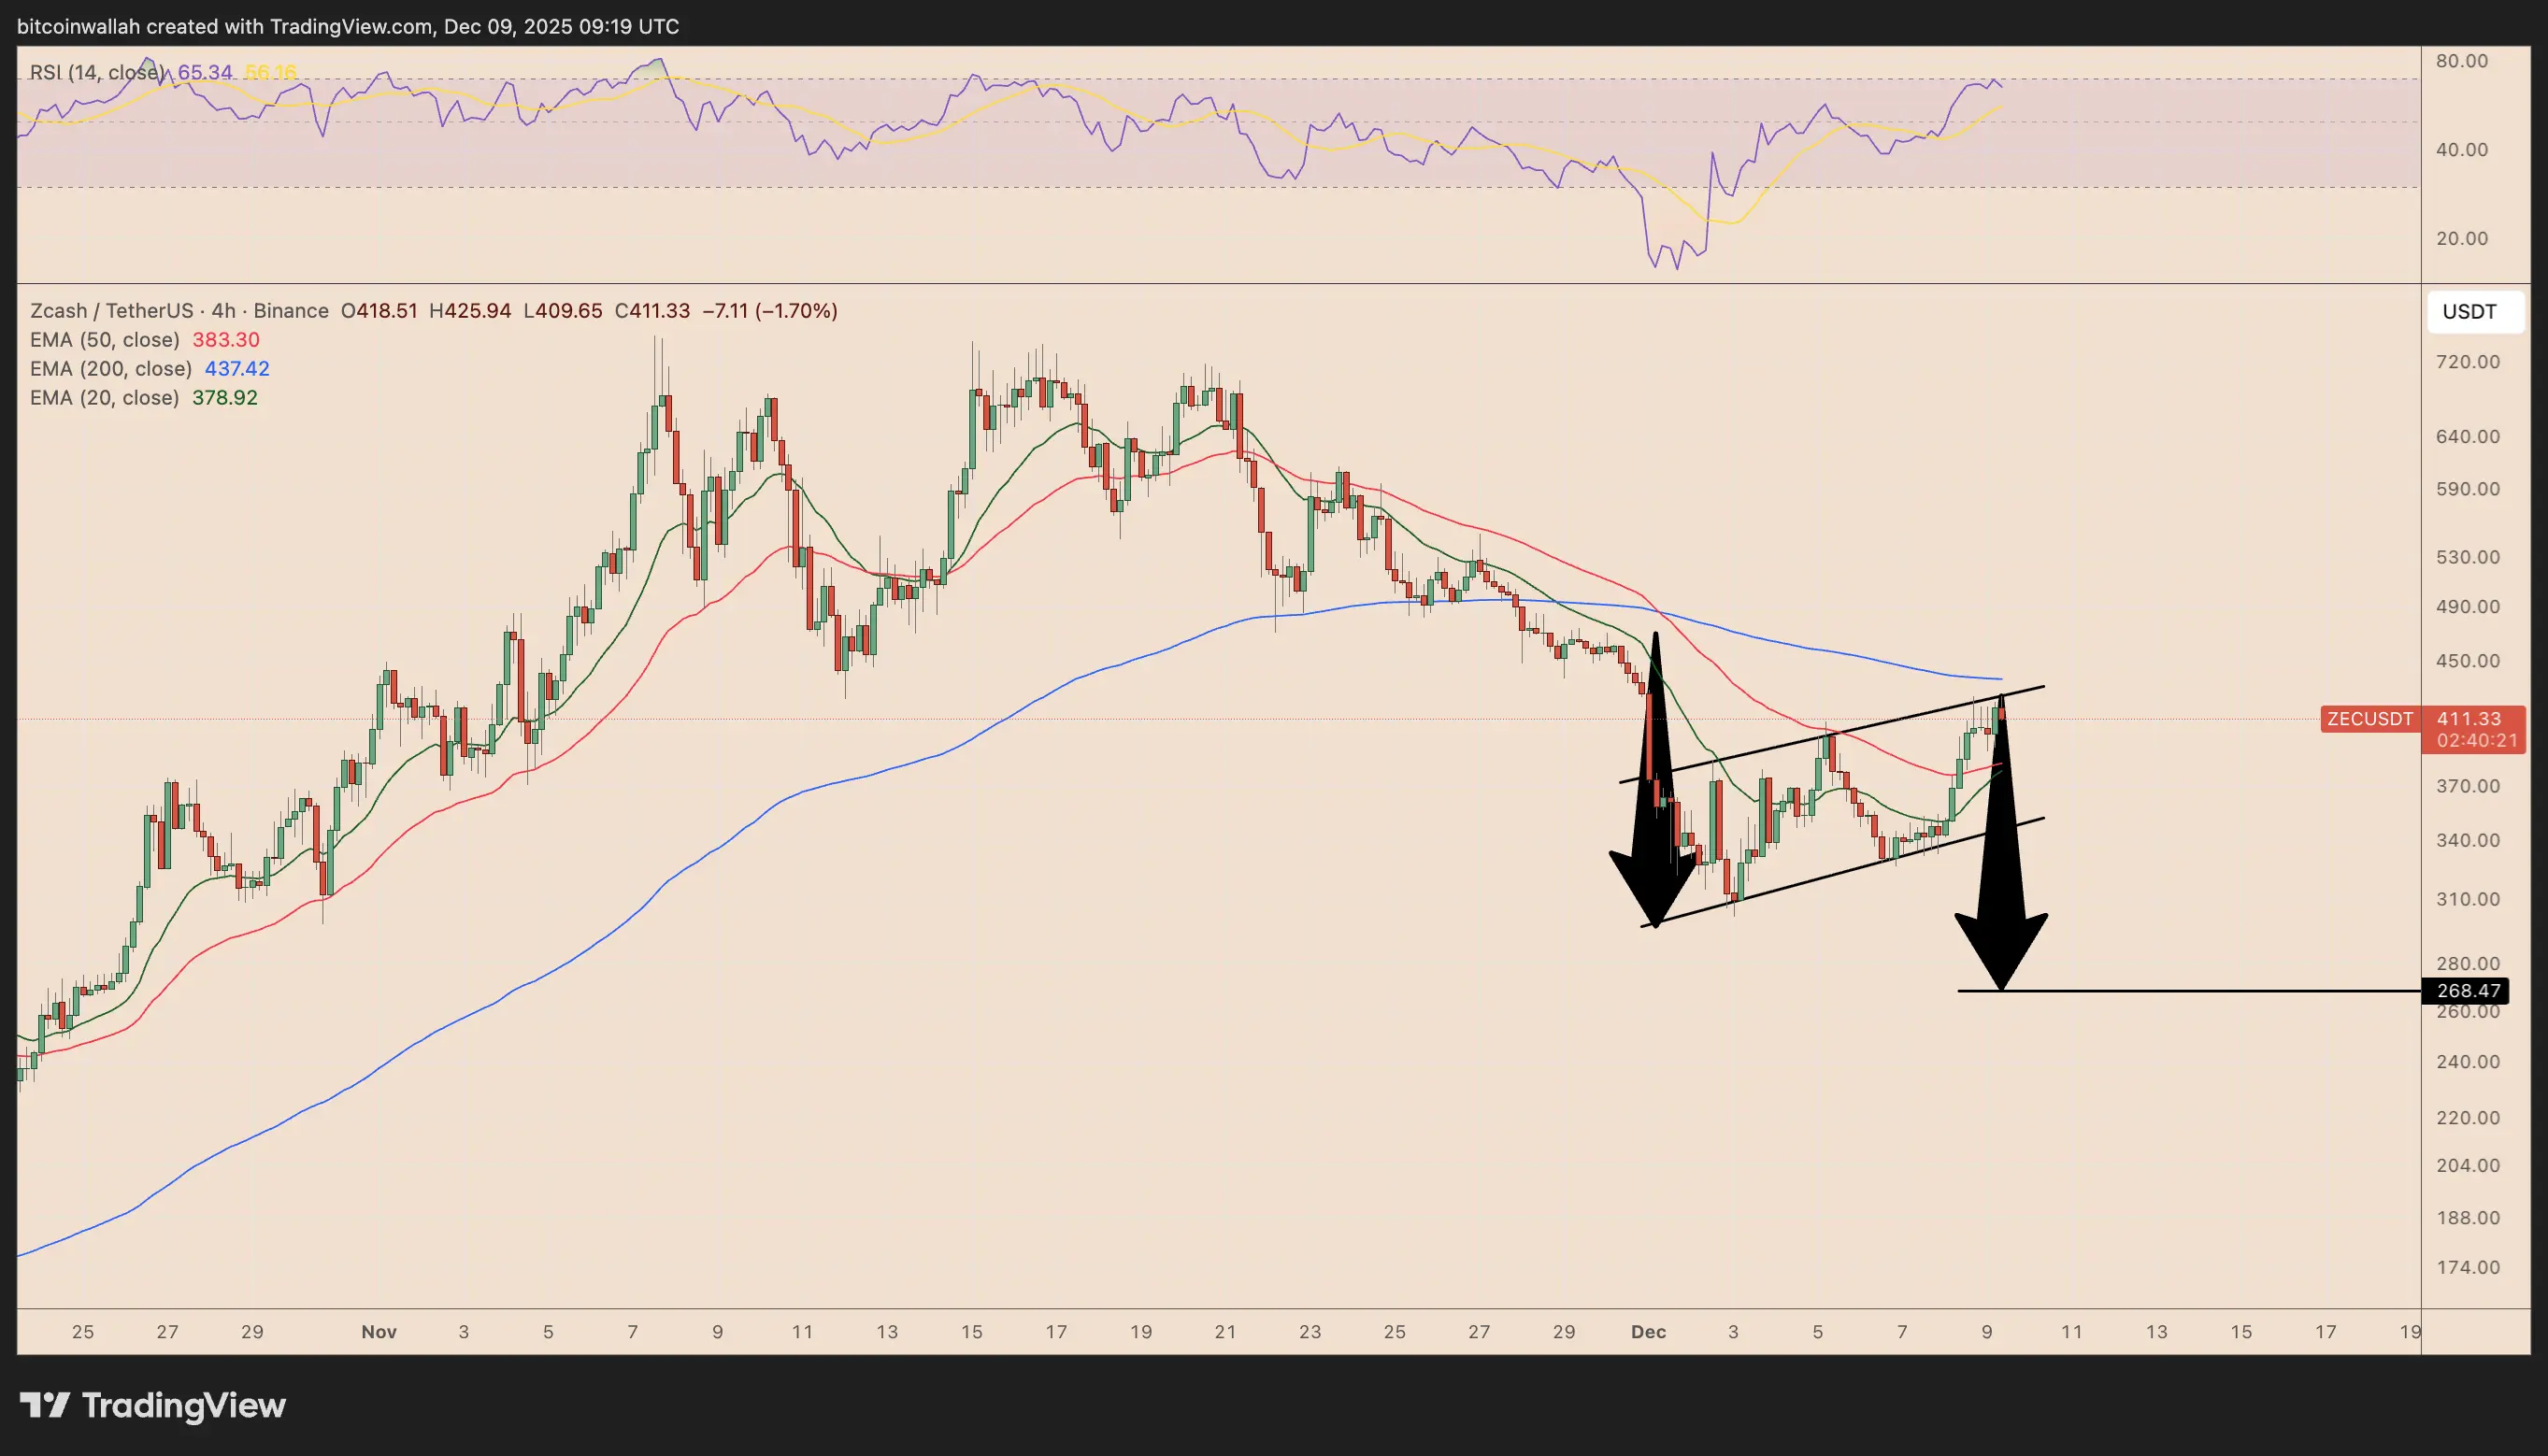 ZEC/USDT four-hour price chart. Source: TradingViewPrice also struggled to break above the 200-day exponential moving average (200-4H EMA; the blue wave), reinforcing the bearish continuation setup.
At the same time, ZEC’s relative strength index (RSI) had pushed above the overbought threshold of 70, a region where upside momentum often fades.
Together, these signals suggested that a breakdown from the flag could have opened the door to a move toward the $260–$280 zone, which is approximately 35% below current price levels.
This article does not contain investment advice or recommendations. Every investment and trading move involves risk, and readers should conduct their own research when making a decision.
This article does not contain investment advice or recommendations. Every investment and trading move involves risk, and readers should conduct their own research when making a decision. While we strive to provide accurate and timely information, Cointelegraph does not guarantee the accuracy, completeness, or reliability of any information in this article. This article may contain forward-looking statements that are subject to risks and uncertainties. Cointelegraph will not be liable for any loss or damage arising from your reliance on this information.
- #Altcoins
- #Privacy
- #Markets
- #Zcash
- #Market Analysis
- #Altcoin Watch
Add reaction
![]()
Disclaimer: The information on this page may come from third parties and does not represent the views or opinions of Gate. The content displayed on this page is for reference only and does not constitute any financial, investment, or legal advice. Gate does not guarantee the accuracy or completeness of the information and shall not be liable for any losses arising from the use of this information. Virtual asset investments carry high risks and are subject to significant price volatility. You may lose all of your invested principal. Please fully understand the relevant risks and make prudent decisions based on your own financial situation and risk tolerance. For details, please refer to
Disclaimer.
Related Articles
Pi Network mainnet migration triggers CEX deposits, bulls defend the 0.1736 USDT support line to the death
After Pi Network’s second mainnet migration, about 119,000 users completed KYC verification, resulting in more than 1.12 million PI tokens flowing into centralized exchanges and creating short-term selling pressure. Technical analysis shows that $0.1736 is a key support level, and the Protocol 21 upgrade on April 6 will affect token stability and application expansion.
MarketWhisper1h ago
The PI bulls remain steadfast at the critical support level that marks the decisive point between the second phase of the migration wave
Pi Network saw a 2% rise on Tuesday, maintaining key support amid US-Iran tensions. The second mainnet migration led to increased PI deposits on exchanges, highlighting ecosystem challenges. Technical indicators show potential recovery, but resistance remains at $0.1872.
TapChiBitcoin1h ago
Bitcoin Greed Index hits the bottom: retail investors panic, but long-term holders quietly accumulate coins
The Bitcoin Fear and Greed Index recorded a score of 8 on March 30, indicating extreme pessimism in the market. Maintaining this state for 59 days, it is the longest fear period since the 2022 FTX collapse. Despite subdued retail sentiment, long-term holders have moved Bitcoin to self-custody accounts for protection, with no sign of selling pressure—showing behavior consistent with historical bottom characteristics. With the current market influenced by multiple macro factors and lacking a clear rebound catalyst, the timeline for recovery remains difficult to predict.
MarketWhisper1h ago
Michael Saylor “Laser Eyes” post surpasses 1 million views, billionaires follow up by buying crypto
MicroStrategy Executive Chairman Saylor has restarted the laser eyes symbol, expressing his bullish conviction in Bitcoin, and contrasting it with the current market’s fear sentiment. MicroStrategy holds 761,068 Bitcoins and plans to increase that to 1,000,000 by 2026. Real estate billionaire Grant Cardone has also announced additional Bitcoin purchases, strengthening market confidence and signaling a long-term hold.
MarketWhisper2h ago
Hyperliquid whale puts on a short position in Bitcoin worth 53 million, the market is wary of downside risk
On the decentralized sustainable derivatives exchange Hyperliquid, a whale trader opened a leveraged short Bitcoin position worth $53.0 million, with a liquidation price of $80,630. At the same time, the trader also holds short positions in silver and multiple altcoins, as well as a long position in Brent crude oil, reflecting its bearish outlook on the current market. Geopolitics, regulatory uncertainty, and the upcoming employment data make up the threefold pressure weighing on this week’s market.
MarketWhisper2h ago
BTC 15-minute surge 0.80%: spot incremental buy orders and changes in the order book structure drive a price breakout
From 2026-03-31 01:15 to 2026-03-31 01:30 (UTC), BTC showed a clear breakout move. The candlestick data indicates a return rate of +0.80%, with the price ranging between 67,241.1 and 67,884.3 USDT, and a recorded amplitude of 0.96%. During this period, trading activity in the market was active, risk appetite rebounded, and short-term bullish sentiment dominated, driving the price to break through local resistance.
The main driving forces behind this breakout were the synchronized rise in trading volume across the spot and derivatives (futures/perpetual) markets, along with a significant net inflow of funds into exchanges. The spot trading volume surged sharply compared with the average value of the previous hour.
GateNews3h ago
