Fartcoin has broken out of a multi-month descending channel, marking its first breakout from this structure in months. Currently, Fartcoin’s price has risen to $0.2989, up 6.9% for the week. This breakout has shifted market attention to the established range between the $0.2362 support and the $0.3002 resistance. The token is now trading between these two key price levels, defining the recent market range.
Technical Breakout from Multi-Month Downtrend Channel
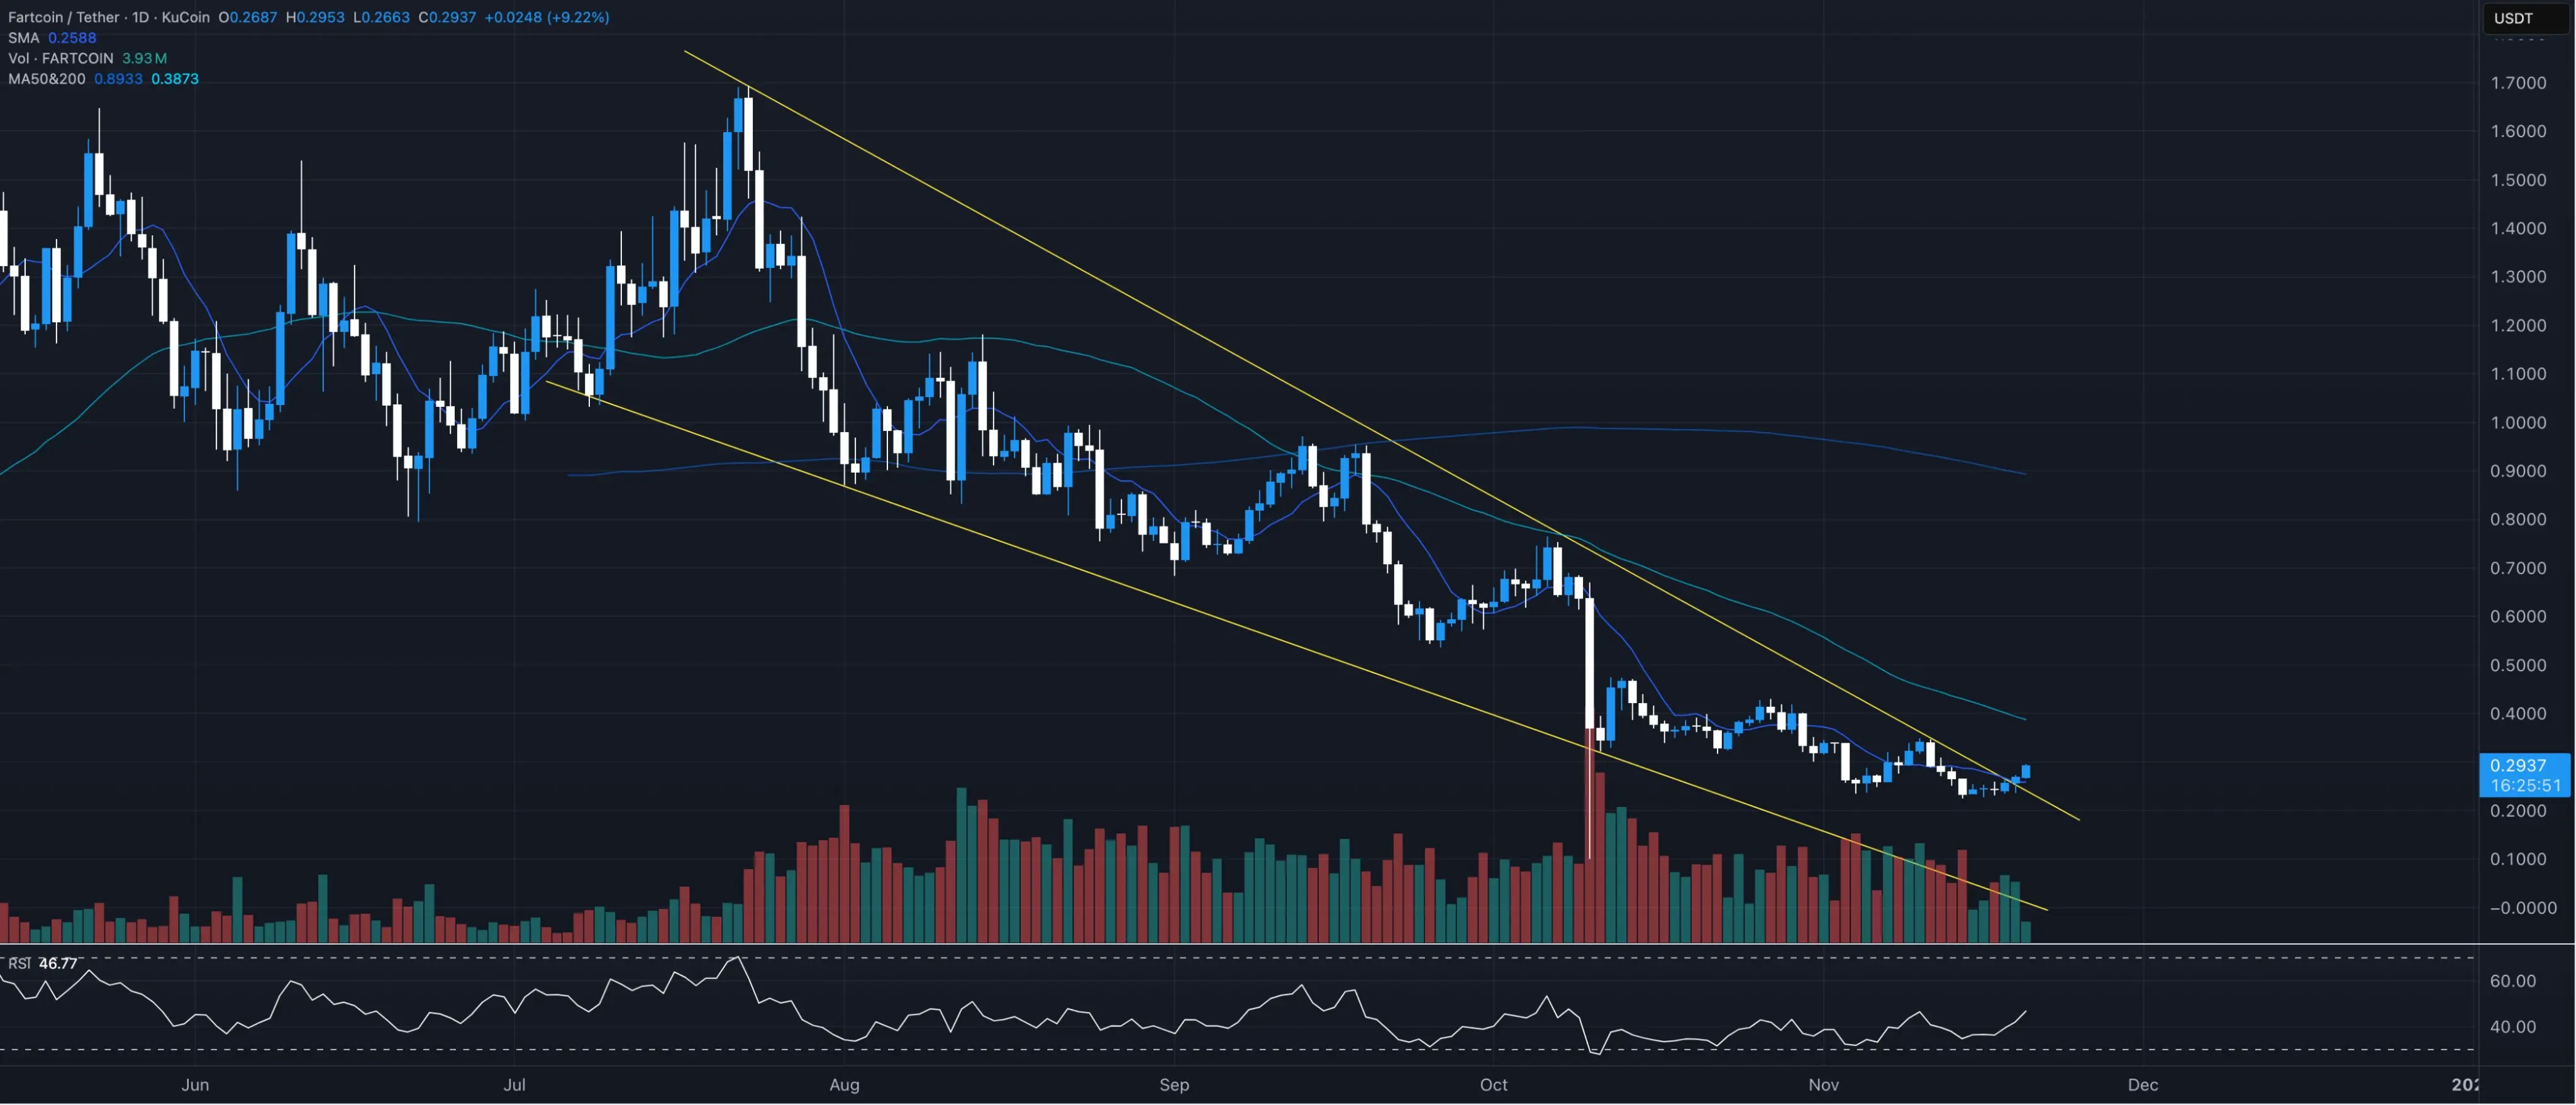
(Source: Trading View)
This Fartcoin breakout occurred after several months of decline, during which the price stayed within a clear channel. Throughout the downtrend, trading volume remained active, and charts showed the price repeatedly interacting with the upper and lower boundaries of the channel. Notably, the recent candlestick closed above the upper trendline, signaling the end of this structure.
The descending channel is one of the most classic patterns in technical analysis. When the price fluctuates between two parallel downward sloping trendlines, a descending channel is formed. The upper boundary represents resistance, where price faces selling pressure and turns down each time it touches the line; the lower boundary represents support, where price typically gets buying support and rebounds when touched. Fartcoin had been trapped in this channel for several months, with every attempt to break upwards suppressed by the upper boundary.
Such a prolonged channel structure is significant. The longer the duration, the more valid the channel, and the greater the technical significance when it breaks. When price finally breaks above the upper boundary, it often signals a potential trend reversal. Fartcoin’s breakout happened after the candlestick clearly closed above the upper trendline, rather than just intraday touches, adding reliability to the breakout.
This shift is directly related to Fartcoin’s rebound to the current level. The rebound occurred as the price neared the $0.2362 support, which had limited declines in previous tests. Technically, this support is located near the lower boundary of the descending channel. After receiving strong support here, the price rebounded and eventually broke through the upper boundary, forming a complete “channel breakout” pattern.
Currently, Fartcoin’s price is moving from the support to the resistance, forming a clear short-term trading range that traders continue to monitor closely. This $0.2362 to $0.3002 range, about 27% wide, provides a clear operational framework for short-term traders.
Key Test at $0.3002 Resistance Level
Traders are watching the $0.3002 resistance, as the token is testing the upper boundary of the recent pattern. The market has noted that the token’s trading price is nearing the area where long positions were reportedly established earlier this year. This area, slightly below $0.3002, now serves as resistance. Approaching this area provides another benchmark for evaluating Fartcoin’s post-breakout price action.
Why is $0.3002 so critical? Historical price action shows this level was a major volume area earlier this year. When heavy trading occurs within a zone, it often becomes significant support or resistance in the future. If the price approaches from below, that zone acts as resistance; if approached from above, it acts as support. Fartcoin is currently testing this area from below, so it acts as resistance.
The price returning to these levels also highlights the importance of new perpetual market positions. The decision to re-enter the market has increased attention on the current trend, and traders are now closely watching how the token stabilizes near the upper boundary of the recent pattern. If Fartcoin can consolidate around $0.3002, absorb the selling pressure, and then break out with increased volume, it would confirm the start of a new upward trend.
Conversely, if the price faces strong resistance near $0.3002 and quickly retreats, it may signal a failed breakout, with the price potentially retesting the $0.2362 support. Such “false breakouts” are not uncommon in technical analysis when market momentum is insufficient to clear key resistance.
Fartcoin Current Technical Key Levels
Upper Resistance: $0.3002 (early-year long position area, high-volume node)
Current Price: $0.2989 (near resistance test)
Lower Support: $0.2362 (rebound starting point before channel breakout, proven in multiple tests)
Short-Term Range: $0.2362 to $0.3002 (about 27% swing)
Market Structure and the Reference Value of Long-Term Moving Averages
The active range between the $0.2362 support and $0.3002 resistance continues to shape market expectations. Having broken out of the range, Fartcoin is now near its upper boundary, trading around the resistance. However, whether it can break through depends on how the market absorbs the recent upward momentum.
On a broader chart, Fartcoin’s current price remains below long-term moving averages, which are themselves above the current price. These moving average levels provide additional reference points for upcoming trading sessions. Moving averages are among the most used trend indicators in technical analysis, smoothing price fluctuations and offering clearer trend direction.
When price is below long-term moving averages (such as the 200-day MA), it is typically seen as a long-term downtrend. Even if there is a short-term rebound, unless the long-term MA is broken, a trend reversal is not confirmed. This is Fartcoin’s current situation: although it has broken out of the descending channel, it is still below its long-term moving averages, meaning the overall downtrend has not been fully reversed.
This technical setup offers traders a multi-layered analytical framework. In the short term, the $0.2362 to $0.3002 range defines the volatility band. In the mid-term, long-term moving averages provide higher resistance, possibly in the $0.35 to $0.40 range (exact location depends on the MA parameters). Only when the price breaks through these long-term MAs can a trend reversal from down to up be confirmed.
As the breakout develops, traders will continue to reference the short-term range and early structural factors influencing prior trends. The channel breakout gives a preliminary bullish signal, but further confirmation is needed. Volume confirmation, performance at key resistance, and interaction with long-term MAs will all provide important clues in the coming weeks.
Trading Strategy and Risk Management Recommendations
For traders considering entering Fartcoin, the current technical setup offers a relatively clear operational framework. Conservative traders might wait for a decisive breakout above $0.3002 and a confirmed hold before entering, thus confirming the breakout’s validity and reducing the risk of a false breakout. Aggressive traders may open small positions near the current price of $0.2989, with stops set below $0.2362.
If Fartcoin successfully breaks above $0.3002, the next target may be in the $0.35 to $0.40 range, where the long-term moving averages may be located. From the current price to that range, the potential upside is about 17% to 34%. Conversely, if it falls below the $0.2362 support, it may retest lower support levels, with a risk of around 21%.
