Gate Cryptocurrency Market Analysis for November 11th shows Bitcoin at a current price of $106,655.3, with a 24-hour volatility of 0.61%, and a trading volume exceeding 10,003 BTC, totaling approximately $1.059 billion. The Fear and Greed Index has fallen to 26, indicating fear, and investor sentiment remains cautious. Altcoins are showing signs of rotation, with ORO surging by 32.14%, suggesting capital flow shifts.
Mainstream Coins: Bitcoin Holds 100K Level, ETH Trading Volume Rebounds
Bitcoin (BTC) is currently priced at $106,655.3, with a 24-hour volatility of only 0.61%, indicating price consolidation around the $110,000 mark. Data shows a 24-hour trading volume of over 10,003 BTC, with a total transaction value of about $1.059 billion, reflecting active market trading amid intensified bullish and bearish battles. Notably, the number of corporate holdings has surpassed 1 million coins, with ongoing institutional inflows providing solid support for BTC.
From a technical perspective, BTC has been oscillating near $110,000 for several days. Volume distribution reveals significant accumulation between $106,000 and $107,000, forming a short-term support zone. If the price can hold above the critical support at $105,000, BTC may challenge resistance at $110,000. Conversely, a drop below $105,000 could lead to a retest of the $100,000 level.
Ethereum (ETH) is currently priced at $3,612.06, with a 24-hour volatility of 1.23%, slightly higher than BTC. The most notable aspect of this analysis is ETH’s 24-hour trading volume of approximately 174,000 coins, with a total transaction value of about $625 million, surpassing BTC’s spot trading volume. This historic milestone indicates increased activity within the ETH ecosystem and growing institutional liquidity.
The fact that ETH’s trading volume exceeds BTC’s is significant. Historically, when ETH’s trading volume share rises, it often signals the start of a altcoin season. Currently oscillating around $4,300, a breakout above this resistance could open upward space toward $5,000. Technical advice suggests gradually building positions in the $3,600-$3,650 range, with a stop-loss at $3,500 and a take-profit target of $3,750.
Altcoin Rotation Initiated: ORO Leads with 32% Surge, Capital Outflows Evident
Data indicates a notable rotation in the altcoin market. ORO is trading at $0.00105, with a 24-hour increase of 32.14%, and a trading volume of approximately 1.924 billion coins, leading the entire altcoin sector. DOGEGOV is priced at $0.006457, up 23.29% in 24 hours, with a volume of about 136 million coins, showing that meme coins still attract interest. FERC is at $0.010005, up 21.68%, with a volume of roughly 1.128 million coins.
Such collective surges in altcoins typically occur in late-stage bull markets, when BTC and ETH prices enter consolidation phases, prompting capital to seek high-volatility assets. The 32% daily gain of ORO is particularly noteworthy; such rapid increases are usually accompanied by high risk and high reward. Investors should be cautious, as altcoin volatility can lead to sharp swings within hours.
In terms of liquidity, DOGEGOV’s volume of 136 million coins indicates relatively good liquidity, while FERC’s 1.128 million coins suggest higher risk due to lower liquidity. The analysis recommends strict position control when trading altcoins: no single coin should exceed 5% of total portfolio, and tight stop-losses should be set to mitigate sudden reversals.
Fear and Greed Index at 26: Is it a Bottoming Opportunity or a Trap?
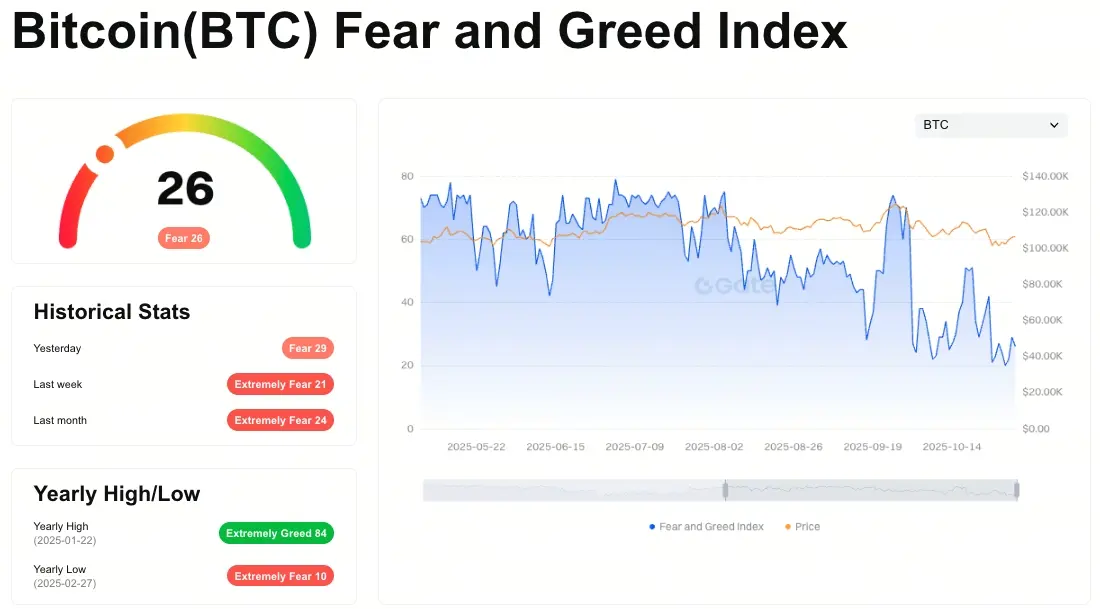
(Source: Gate)
The Bitcoin Fear and Greed Index has fallen to 26, indicating a “fear” zone, which is a critical sentiment indicator in crypto analysis. Historical data shows that when the fear and greed index drops below 30, it often signals a medium- to long-term buying opportunity, as market pessimism can lead to undervaluation. However, caution is warranted, as the index could decline further to 20 or lower.
The cautious market sentiment is driven by multiple factors. First, BTC repeatedly tests the $110,000 resistance but fails to break through, indicating strong overhead pressure. Second, global macroeconomic uncertainties persist, with unclear Federal Reserve rate policies. Third, expectations of increased SEC regulation have caused some investors to adopt a wait-and-see approach.
Nevertheless, a fear index of 26 also presents tactical opportunities. For risk-tolerant investors, current levels can be used to initiate partial positions. A “pyramid” buying strategy is suggested: purchase 30% of intended position at current prices; if BTC retests $104,000, buy an additional 30%; and at $102,000, buy the remaining 40%. This approach helps average down costs and reduces risk from single-entry points.
Strategies for a Fear Index of 26
Conservative Investors: Prefer to wait, monitoring for the index to fall below 20 or for clear bottoming signals in price.
Moderate Investors: Allocate 20-30% of their position, gradually building in the $106,000-$107,000 range.
Aggressive Investors: Allocate 40% of their position plus 10% in altcoins to capture rotation opportunities.
Liquidity and Technical Indicators: Combined Assessment
The overall health of market liquidity remains good. BTC and ETH prices are relatively stable, with 24-hour volatilities of 0.61% and 1.23%, respectively, well below the historical average of 3-5%. This low volatility suggests market maturity and may precede larger swings.
Market depth on major exchanges like Coinbase and Binance remains strong, with buy/sell orders exceeding 1000 BTC for BTC and over 10,000 ETH for ETH. Such liquidity ensures that large trades are unlikely to cause significant slippage. Arbitrage opportunities are minimal, indicating efficient pricing across platforms.
Technical indicators show that BTC and ETH are at critical levels. BTC’s RSI hovers around 50, indicating a balanced state without overbought or oversold signals. MACD shows a slight bearish crossover but with limited momentum, implying limited downside pressure. ETH’s technicals are slightly stronger, with RSI near 55 and a bullish MACD trend.
Investment Strategies and Risk Management
For short-term trading, entry points are suggested at BTC $106,000-$107,000 and ETH $3,600-$3,650. Stop-loss levels are set at $105,000 for BTC and $3,500 for ETH; take-profit targets are $110,000 and $3,750, respectively. Position sizes should be conservative (20-30%) for most, with more aggressive traders allocating up to 40%. The risk level is moderate; gradual position building is recommended over full deployment.
For medium-term positioning, the trend remains cautiously bullish, favoring a 60% BTC and 40% ETH allocation to balance stability and growth potential. Key factors to monitor include SEC regulation developments, institutional investment flows, and macroeconomic data. Maintaining flexible positions and adjusting based on market changes is advised.
Core risk factors include four main categories: systemic risks from macroeconomic uncertainties, individual coin risks from regulatory changes, liquidity risks from rapid capital outflows, and regulatory risks from SEC enforcement. Investors should establish comprehensive risk management protocols, including stop-loss discipline, position control, and diversification.
