

TrendCatcher
No content yet
TrendCatcher
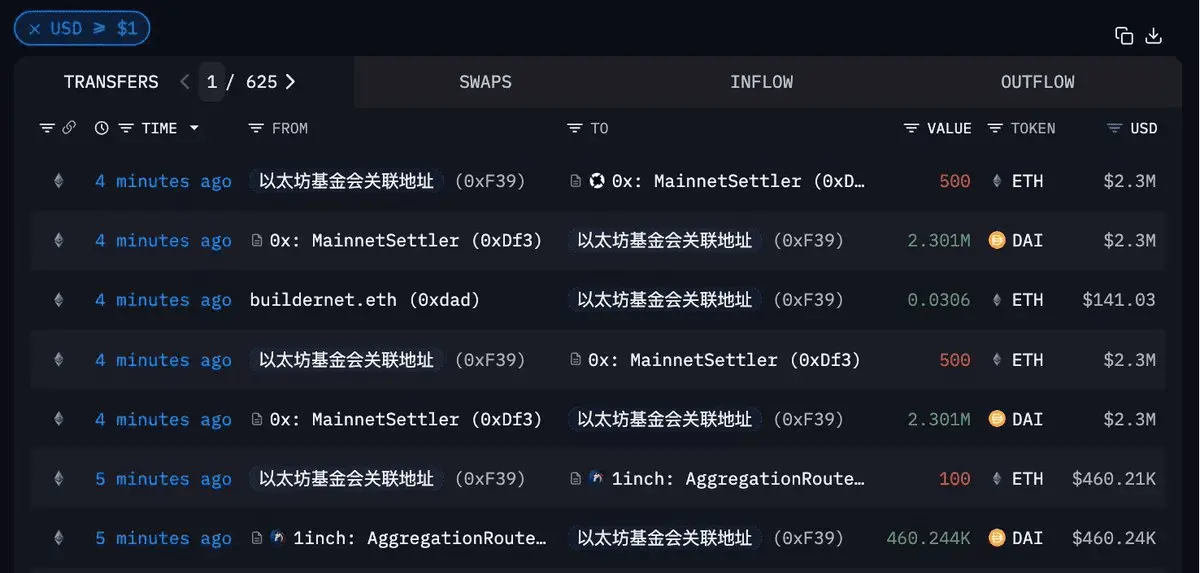
Update: In the past 5 minutes, Ethereum Foundation affiliated Address sold 1100 ETH at an average price of $4602.1, approximately 5.06 million dollars.
In the past two hours, a total of 2794.87 ETH (worth 12.78 million USD) has been sold, at an average selling price of $4574.4.
The good news is that the current market and its sentiment are no longer affected by such a large sell-off.
In the past two hours, a total of 2794.87 ETH (worth 12.78 million USD) has been sold, at an average selling price of $4574.4.
The good news is that the current market and its sentiment are no longer affected by such a large sell-off.
ETH5.06%
- Reward
- like
- Comment
- Repost
- Share
What should we do today about btcbtcbtc?
BTC Yesterday Market Review: Yesterday morning, BTC continued to rise, reaching a high of 122348. When it approached the previous high, we decisively laid out short positions near 121800. During the noon period, the 2-hour TD indicator showed a 9 signal, clearly indicating a trend reversal to bearish, further solidifying our short strategy. In the early hours, BTC dipped to around 118000, and we exited our short position with a solid profit of 3800 points. Throughout yesterday, we adhered to the short strategy, perfectly capturing the one-sided downward
BTC Yesterday Market Review: Yesterday morning, BTC continued to rise, reaching a high of 122348. When it approached the previous high, we decisively laid out short positions near 121800. During the noon period, the 2-hour TD indicator showed a 9 signal, clearly indicating a trend reversal to bearish, further solidifying our short strategy. In the early hours, BTC dipped to around 118000, and we exited our short position with a solid profit of 3800 points. Throughout yesterday, we adhered to the short strategy, perfectly capturing the one-sided downward
BTC1.8%

- Reward
- like
- Comment
- Repost
- Share
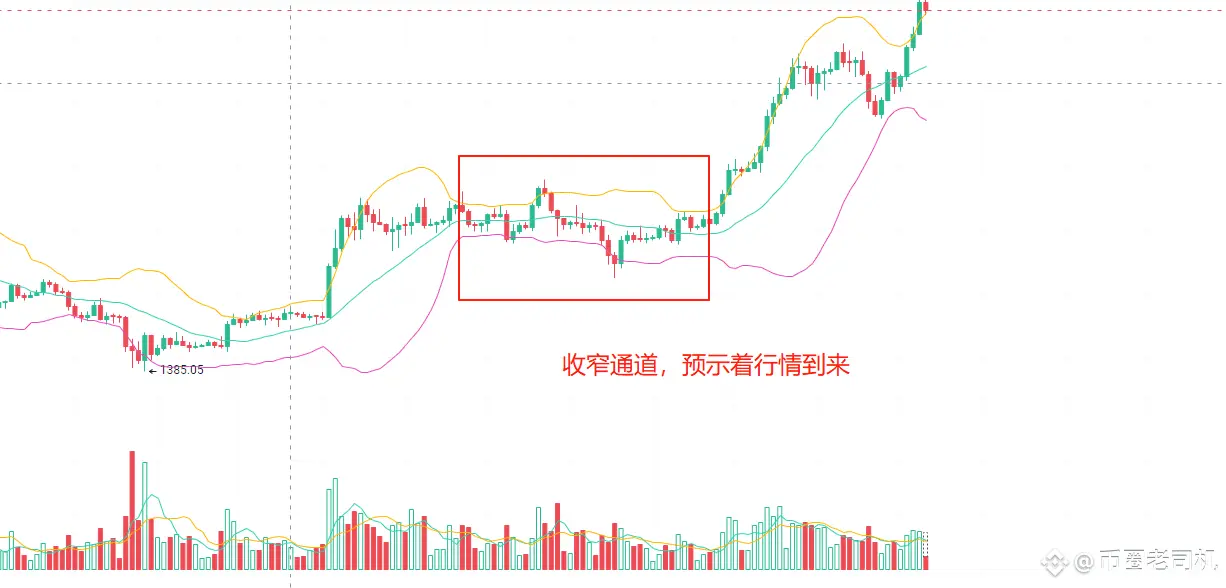
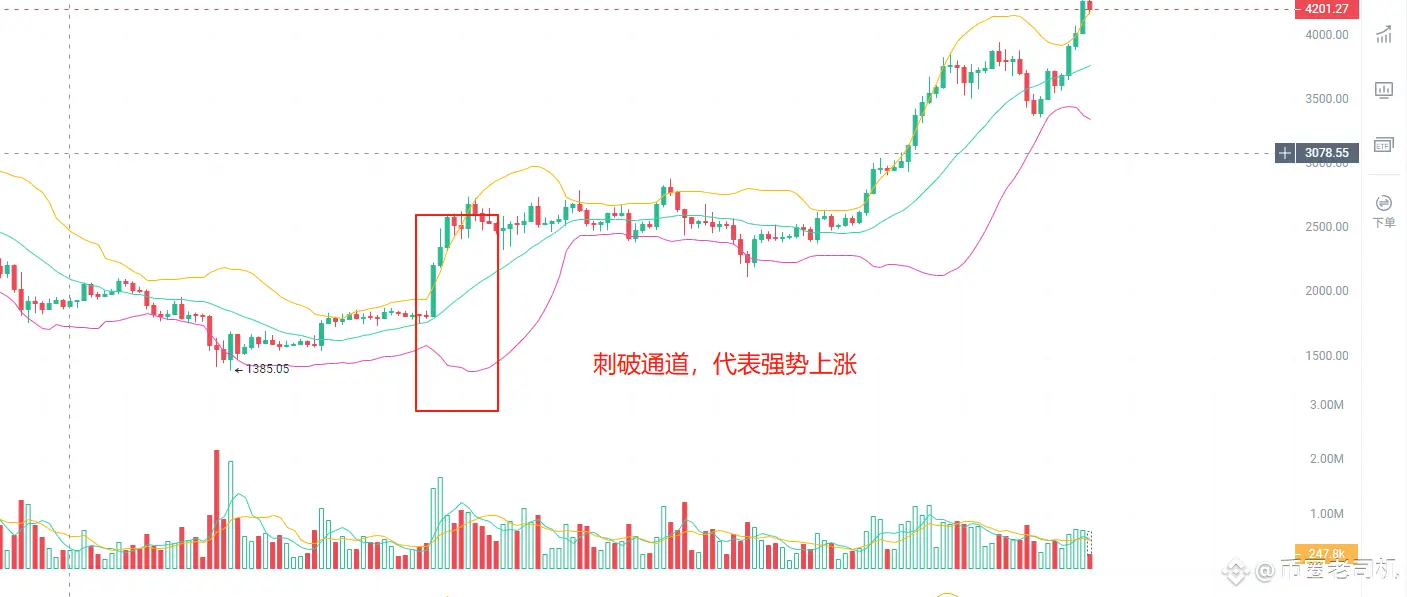
How to use the short-term indicator Bollinger Bands?
What is the Bollinger Bands indicator?
The Bollinger Bands indicator (BB) was created by financial analyst and trader John Bollinger in the early 1980s. The Bollinger Bands indicator is widely used as a tool in technical analysis (TA); fundamentally, it is an oscillation measure used to indicate the high and low volatility in the market, as well as overbought or oversold conditions.
The main principle of the Bollinger Bands indicator is to emphasize how prices fluctuate around an average value. More specifically, the indicator consists of an
View OriginalWhat is the Bollinger Bands indicator?
The Bollinger Bands indicator (BB) was created by financial analyst and trader John Bollinger in the early 1980s. The Bollinger Bands indicator is widely used as a tool in technical analysis (TA); fundamentally, it is an oscillation measure used to indicate the high and low volatility in the market, as well as overbought or oversold conditions.
The main principle of the Bollinger Bands indicator is to emphasize how prices fluctuate around an average value. More specifically, the indicator consists of an
- Reward
- 1
- Comment
- Repost
- Share
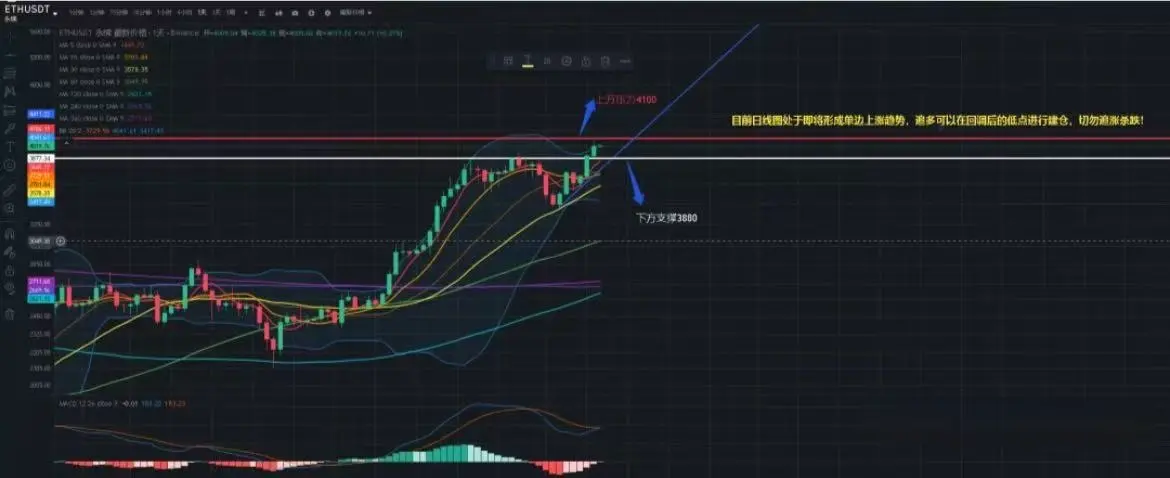
Currently, Ethereum is in a pullback phase after breaking its high point. From the market sentiment, the strength of the long positions is slowing down, while the short positions are continuously making a strong push. On the hourly chart, there is heavy selling pressure above, but it has not broken down below the 4000 range. The subsequent strength of the short positions is insufficient, and we will see if it can break below the 4000 mark. If it breaks below, the support points below are 3970, secondary support at 3940, and strong support at 3880. If it holds above 4000 and does not fall below
ETH5.06%
- Reward
- 3
- 1
- Repost
- Share
ZhangYujun413 :
:
The streamer is very serious.Personal insights
View Original
- Reward
- like
- Comment
- Repost
- Share
The upcoming trends
View Original
- Reward
- like
- Comment
- Repost
- Share
Brothers! Pay attention to the changes in the 4100 range. Those who have time to watch the market can enter after it false breakouts. Sometimes notifications may not come quickly! Don't short at this position, or you won't be able to eat! If it can't break above this position, it will be at least a month of bearish traders' world! It is the strongest resistance level this year! My opinion is that even if it hits the stop loss, we should go for it! If there are any other changes, I will notify you! For this kind of long term position, adjust the stop loss appropriately based on different market
View Original
- Reward
- like
- Comment
- Repost
- Share
August 6, 2025 Today's Bitcoin Trend Analysis:
Overall trend: Fluctuating consolidation with a slight upward bias.
1-hour chart signal: The K-line is located below the middle track of the Bollinger Bands, repeatedly testing the middle track; MA5 (113850) crosses above MA10 (113720) forming a golden cross, indicating an upward trend. Resistance levels: Short-term dual resistance: 114000-114100 range (intersection of MA30 and MA120); resistance after breaking: 114900; strong resistance: 116100. Support levels: Lower support range: 112900-112600; support after breaking: 111800; strong support: 11
BTC1.8%

- Reward
- like
- Comment
- Repost
- Share
Tonight at 20:00, the crypto world leader Trump will deliver an important speech! In light of this news, everyone should adopt a wait-and-see attitude; it will either be a crazy rise or a big dump.
TRUMP3.84%

- Reward
- like
- Comment
- Repost
- Share
After a round of price rise, a peak is formed, and then it starts to fall. This decline has gone through 3 falls and 2 adjustments according to wave theory. Generally, when encountering such a market with 3 falls, one would not blindly go short, but rather observe whether the market can stabilize first and then look for opportunities to go long. Typically, after such a 5-wave decline, the market will take a break, either continue to fall, or first build a bottom and then start to rebound, or even experience a reversal.
View Original
- Reward
- like
- Comment
- Repost
- Share
Will the trend of Ethereum change next? Remember, brothers, short order at 3630.
ETH5.06%
- Reward
- like
- Comment
- Repost
- Share
Yesterday we mentioned that the bull run has not ended, so today, let's continue with today's analysis of Ethereum.
Ethereum has entered a sideways consolidation phase, with a fluctuation range of 3520 to 3460, showing a slight rebound. If it does not stabilize above 3520 for a long time, it may decline again.
Upper minor resistance point: 3520 strong resistance point: 3630
Minor support level below: 3450 Strong support level: 3360
Current trend: High-level sideways consolidation, after breaking through the Bollinger Bands it fell back for adjustment, encountering support at the middle line of
ETH5.06%

- Reward
- like
- Comment
- Repost
- Share
Has the Bear Market really arrived?
Many people are curious about this thing.
Some people are shouting that the Bear Market has arrived, and they say it with great conviction. Let me draw a line here: if the index effectively breaks below 3100 points, then we can talk about the Bear Market. Right now, this pullback at 3250 points can at most be considered a fluctuation; we shouldn't hastily deliver a death sentence to the market, as the overall upward trend has not changed at all. Based on past experience with large cycles, when has the A-shares bull market ever abruptly ended in May? It usual
View OriginalMany people are curious about this thing.
Some people are shouting that the Bear Market has arrived, and they say it with great conviction. Let me draw a line here: if the index effectively breaks below 3100 points, then we can talk about the Bear Market. Right now, this pullback at 3250 points can at most be considered a fluctuation; we shouldn't hastily deliver a death sentence to the market, as the overall upward trend has not changed at all. Based on past experience with large cycles, when has the A-shares bull market ever abruptly ended in May? It usual

- Reward
- like
- Comment
- Repost
- Share
This is comfortable.
View Original
- Reward
- like
- Comment
- Repost
- Share
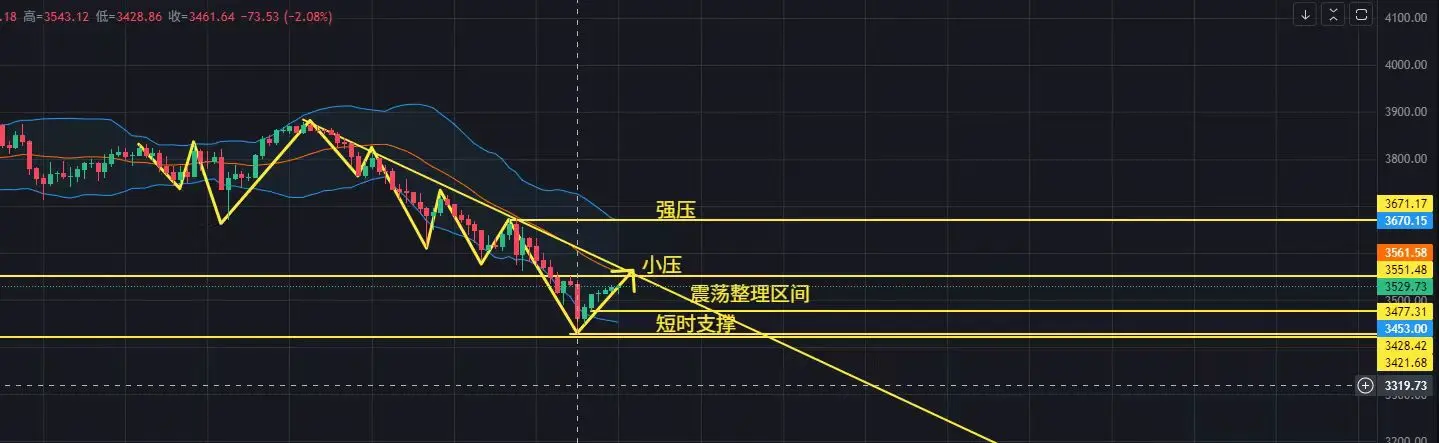
Current Ethereum summary: Overall trend: Sideways fall, currently in a sideways range.
Resistance above: 3576, strong resistance: 3715
Support below: 3420, strong support: 3330
Current trend: After a decline, there is a rebound pulling up, entering a phase of consolidation. The consolidation range is: 3560--3488. At this time, if the rebound rises and does not break 3530 and stabilizes, it will lead to a subsequent decline. If the decline does not break 3488, it will maintain the consolidation range of 3530--3488. If the rebound stabilizes at 3530, there will be a slight upward test near 3560.
ETH5.06%
- Reward
- like
- Comment
- Repost
- Share