

Share the luck, win more rewards! gate.com/activities/p2p-trading-competition?ch=p2pTradingCompetition_20250918&ref=BARCV1FY&ref_type=155&invite_uid=13525639
Trade
Trading Type
Spot
Trade crypto freely
Alpha
Points
Get promising tokens in streamlined on-chain trading
Pre-Market
Trade new tokens before they are officially listed
Margin
Magnify your profit with leverage
Convert & Block Trading
0 Fees
Trade any size with no fees and no slippage
Leveraged Tokens
Get exposure to leveraged positions simply
Futures
Futures
Hundreds of contracts settled in USDT or BTC
Options
HOT
Trade European-style vanilla options
Unified Account
Maximize your capital efficiency
Demo Trading
Futures Kickoff
Get prepared for your futures trading
Futures Events
Participate in events to win generous rewards
Demo Trading
Use virtual funds to experience risk-free trading
Earn
Launch
Investment
Simple Earn
VIP
Earn interests with idle tokens
Auto-Invest
Auto-invest on a regular basis
Dual Investment
Buy low and sell high to take profits from price fluctuations
Quant Fund
VIP
Top asset management team helps you profit without hassle
Crypto Loan
0 Fees
Pledge one crypto to borrow another
Lending Center
One-Stop Lending Hub
VIP Wealth Hub
New
Customized wealth management empowers your assets growth
Private Wealth Management
Customized asset management to grow your digital assets
Staking
Stake cryptos to earn in PoS products
BTC Staking
HOT
Stake BTC and earn 10% APR
GUSD Minting
New
Use USDT/USDC to mint GUSD for treasury-level yields
Soft Staking
Earn rewards with flexible staking
More
Asiftahsin
Share Crypto Related Market Analysis, Share Crypto Related knowledge for my follower(brother and Sister)
Asiftahsin
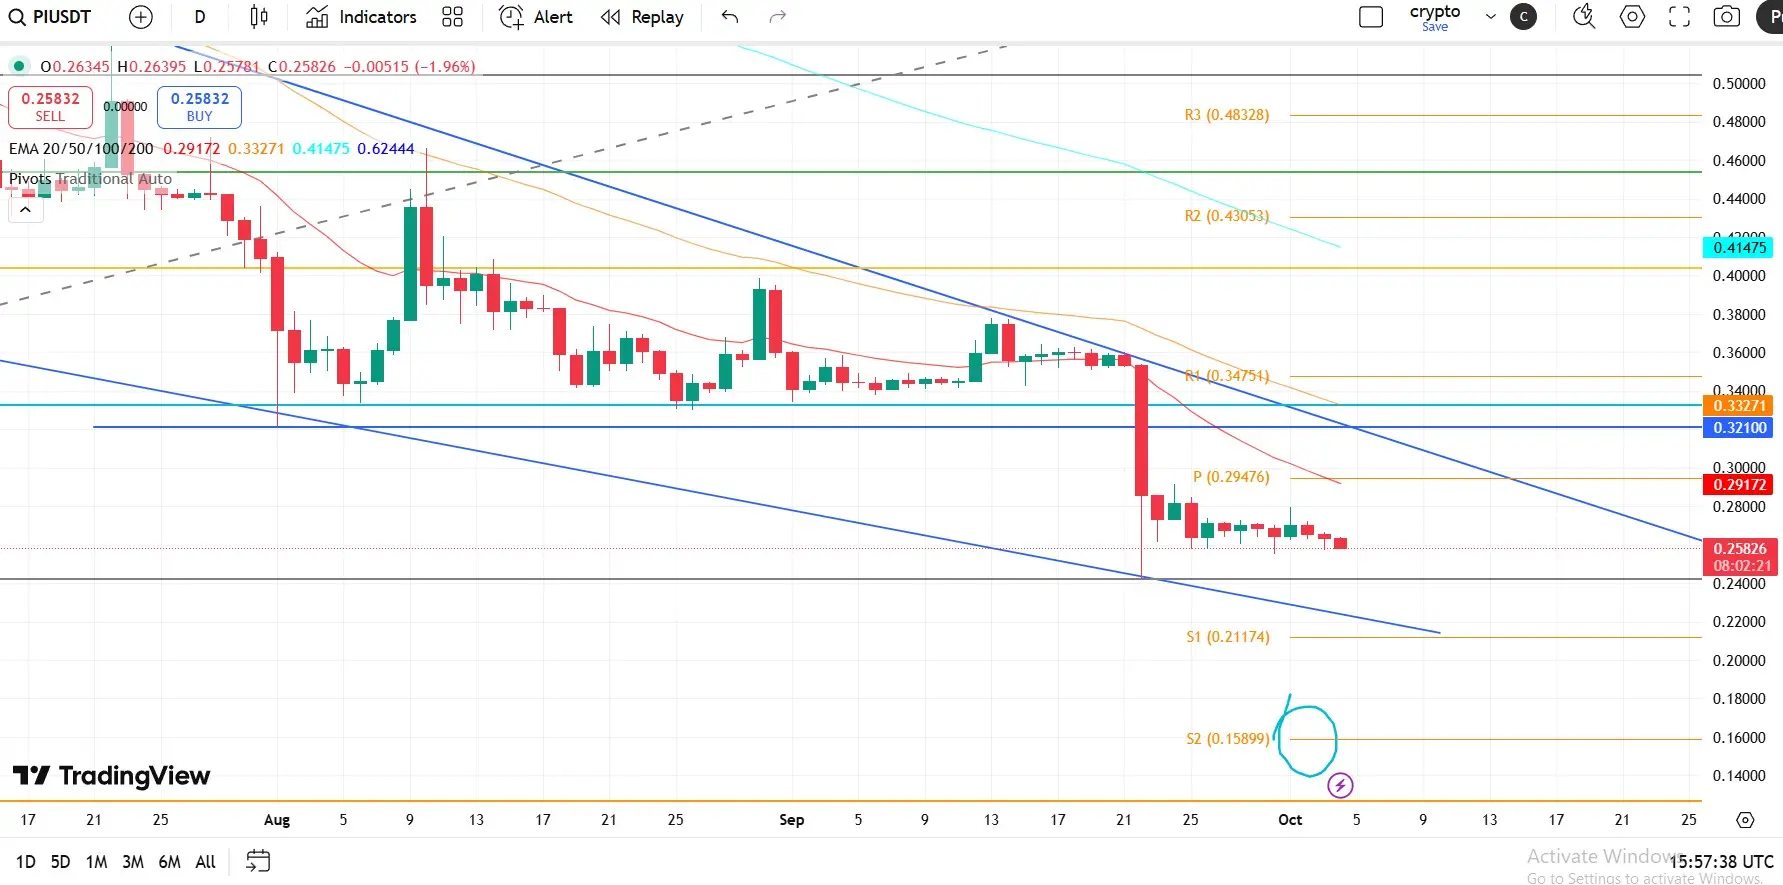
Pi Network Technical Outlook
Pi Network (PI) is showing early signs of potential recovery after nearing oversold conditions, with the RSI at 29. Traders are closely watching key technical levels to assess whether bulls can regain control.
💹 Exponential Moving Averages (EMA):
20-day EMA: $0.29172
50-day EMA: $0.33271
100-day EMA: $0.41475
200-day EMA: $0.62444
📌 Pivot Points:
Pivot (P): $0.29476
Resistance 1 (R1): $0.34751
Support 1 (S1): $0.21174
Support 2 (S2): $0.15899
🔎 Technical Outlook:
Immediate resistance lies near the 20-day EMA ($0.29172) and pivot point ($0.29476). A sustained mov
PI0.45%
- Reward
- 10
- 9
- Repost
- Share
KatyPaty:
Watching Closely 🔍View More
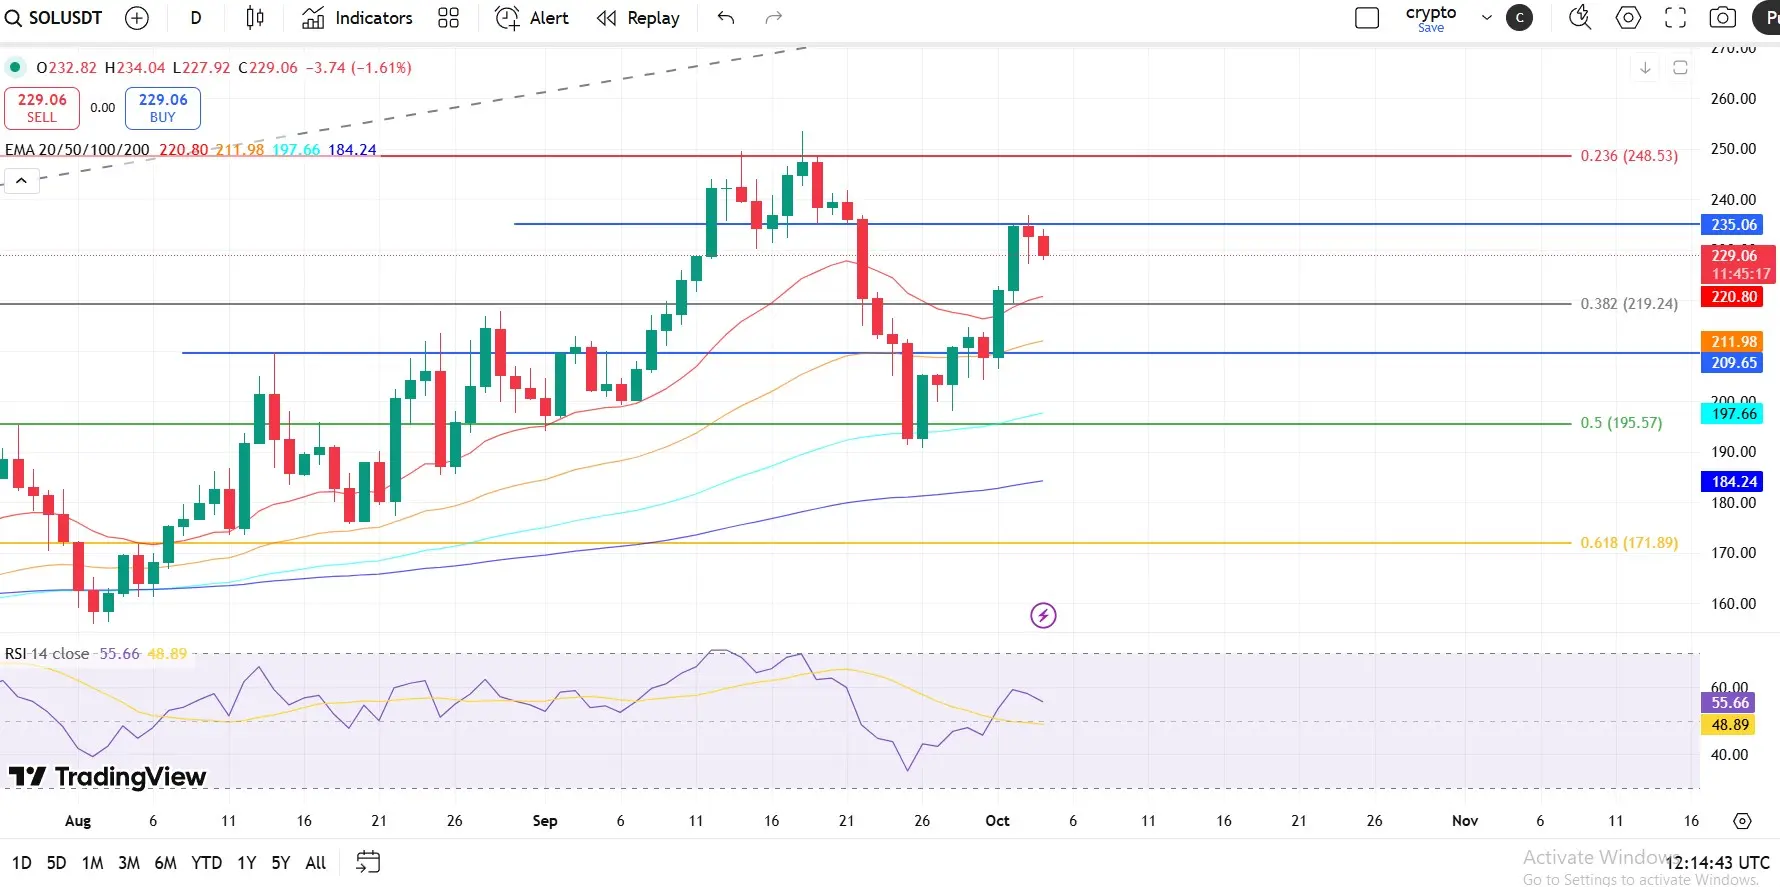
Solana Nears $229 After Pullback from $237, Eyes $240 Breakout 🚀
Solana (SOL) is currently trading around $229, down roughly 3.4% from its recent high of $237. Despite this slight pullback, bulls remain active, having defended the $209 support zone and maintaining a solid bullish structure.
SOL has surged from $190 to $237, marking a 24.7% rally over this range, demonstrating strong recovery momentum in recent weeks.
The token remains above all major moving averages:
20-day EMA: $220.78
50-day EMA: $211.97
100-day EMA: $197.66
200-day EMA: $184
This alignment provides solid technical support
SOL3.27%
- Reward
- 6
- 3
- Repost
- Share
Sakura_3434:
Just go for it💪View More
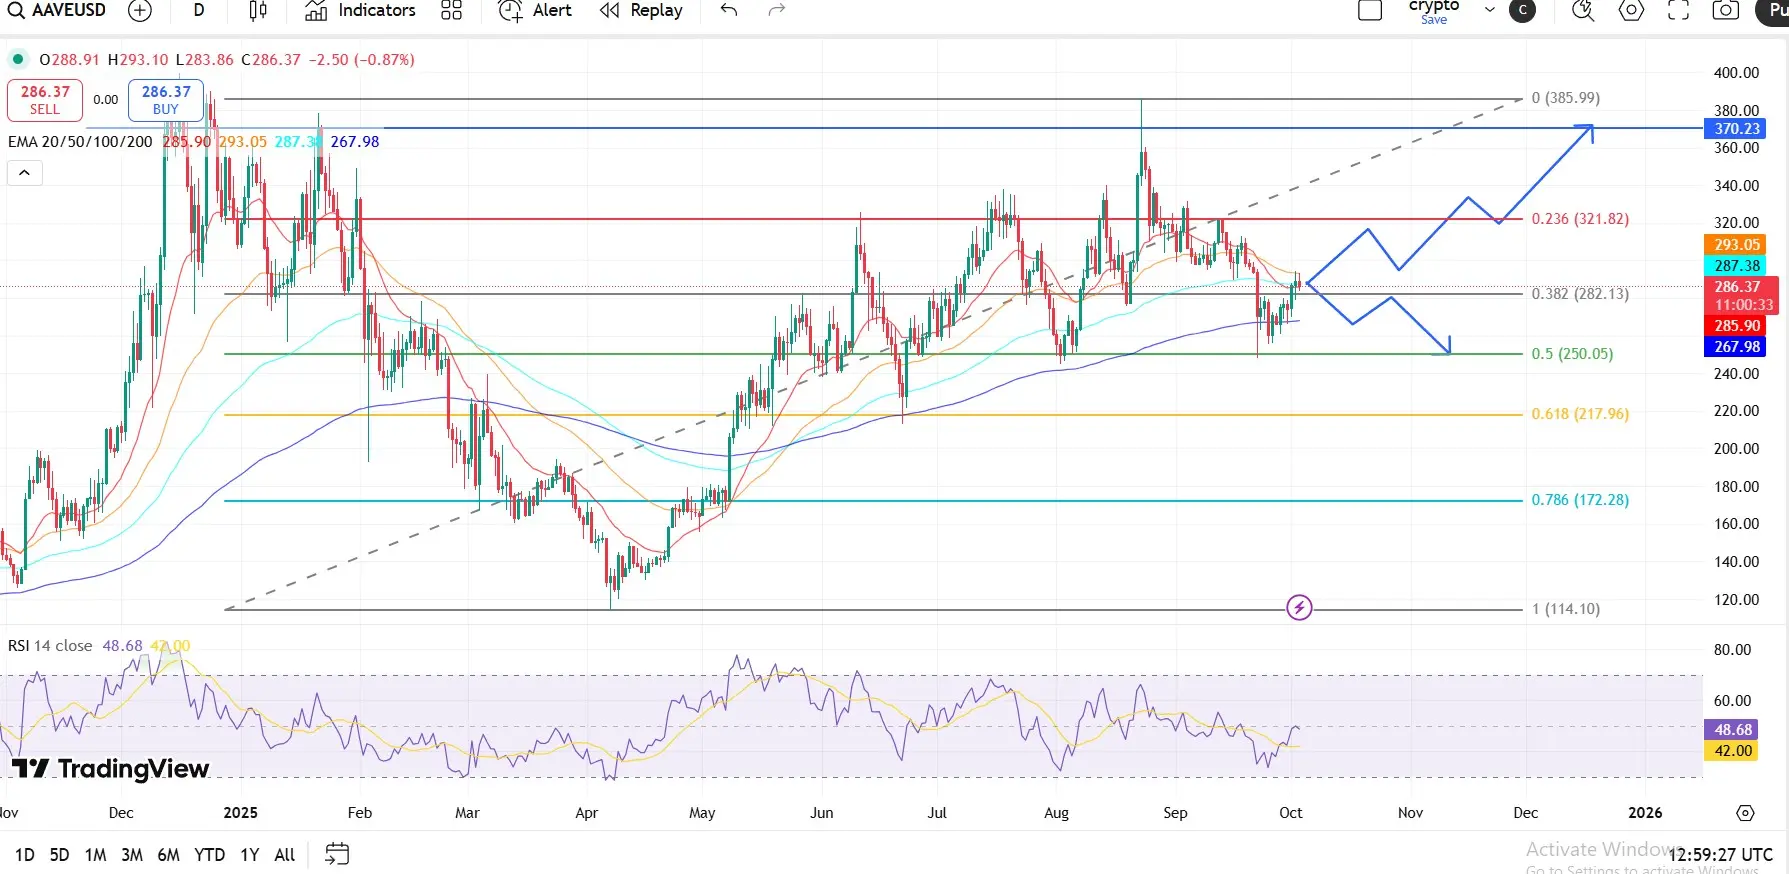
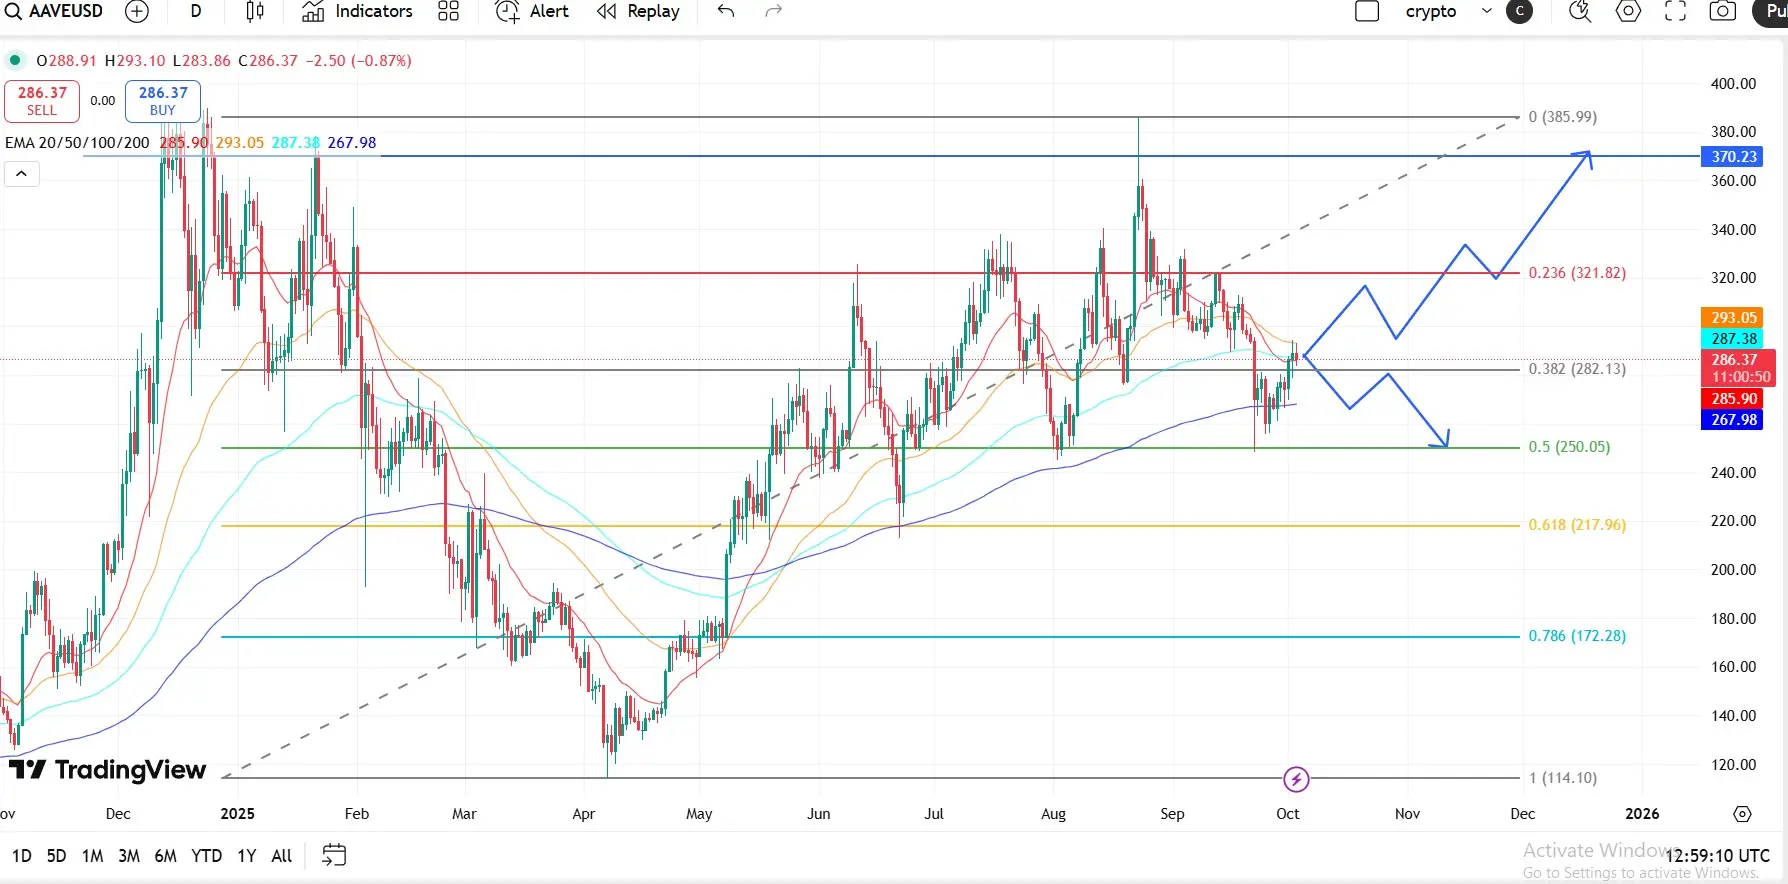
Aave (AAVE) Price Forecast – Bulls Target the $370 Mark
Aave has shown strong signs of recovery after defending a crucial support area. Last week, the token rebounded from the 50% Fibonacci retracement level at $250.05, which was drawn from April’s low of $114.10 to August’s high of $385.99. This bounce was a turning point for sentiment, as it also coincided with the reclaiming of the 200-day Exponential Moving Average (EMA) at $268, a key level that traders have been closely monitoring.
Since then, AAVE has gathered momentum, climbing around 5% this week and holding near $290 heading into the
AAVE3.49%
- Reward
- 8
- 3
- Repost
- Share
LittleTao :
:
AAVE holding strong above $290 — next stop $370? 📈🔥 Momentum looks solid!
#AAVE #Cryptomarketrebound #DeFi
View More
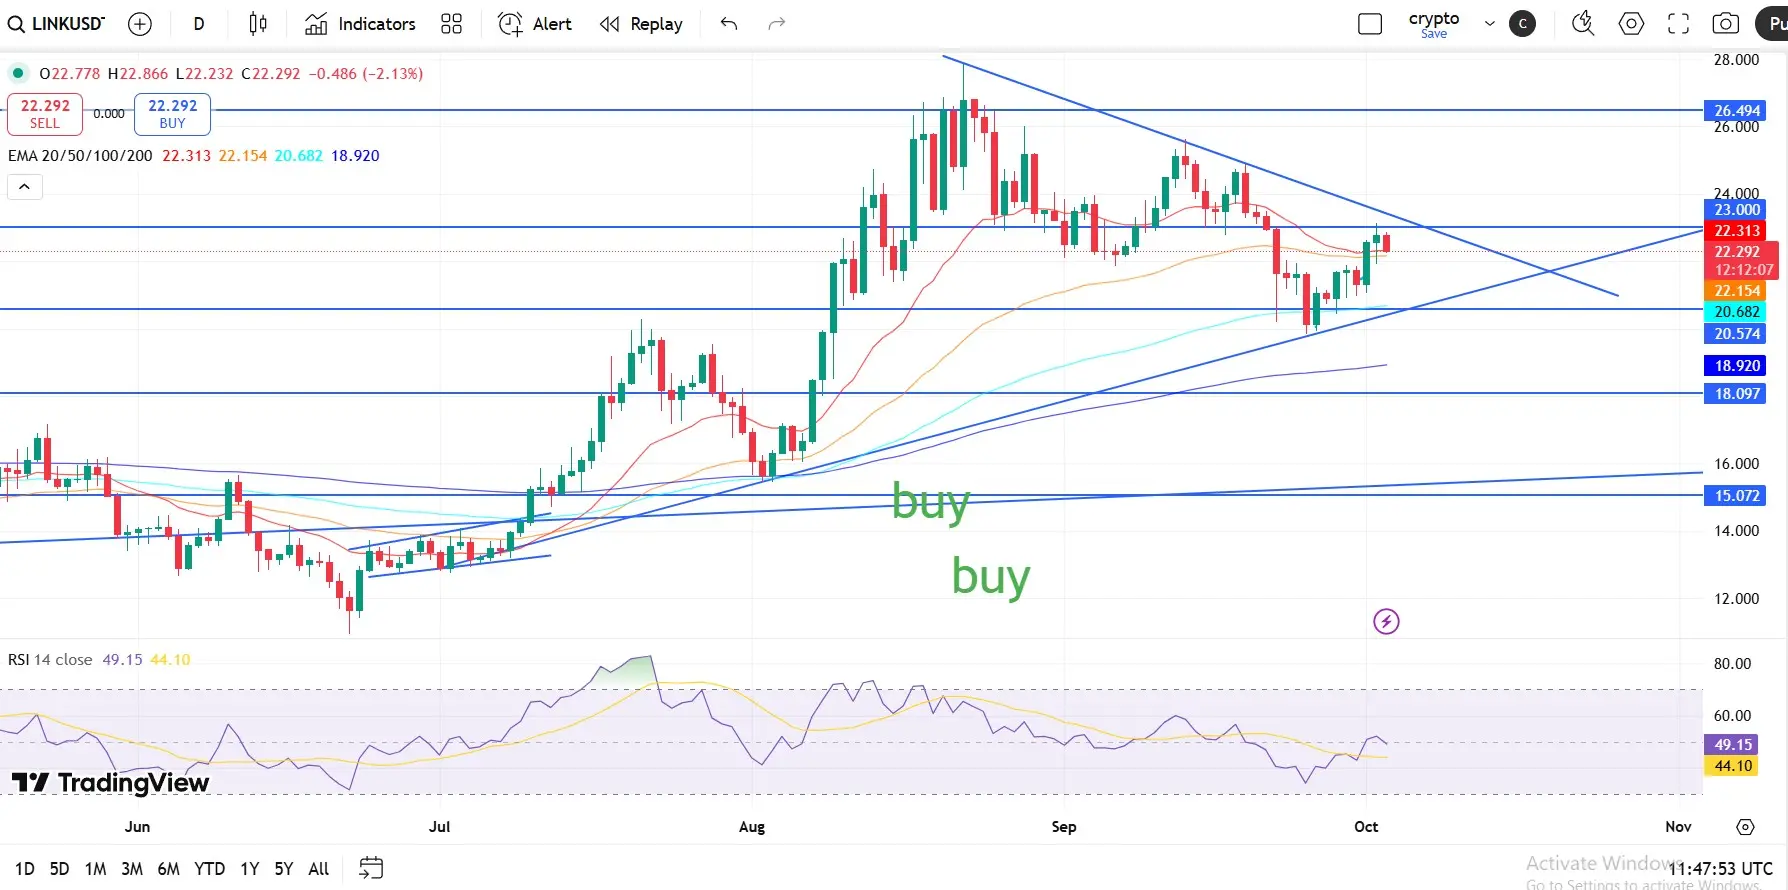
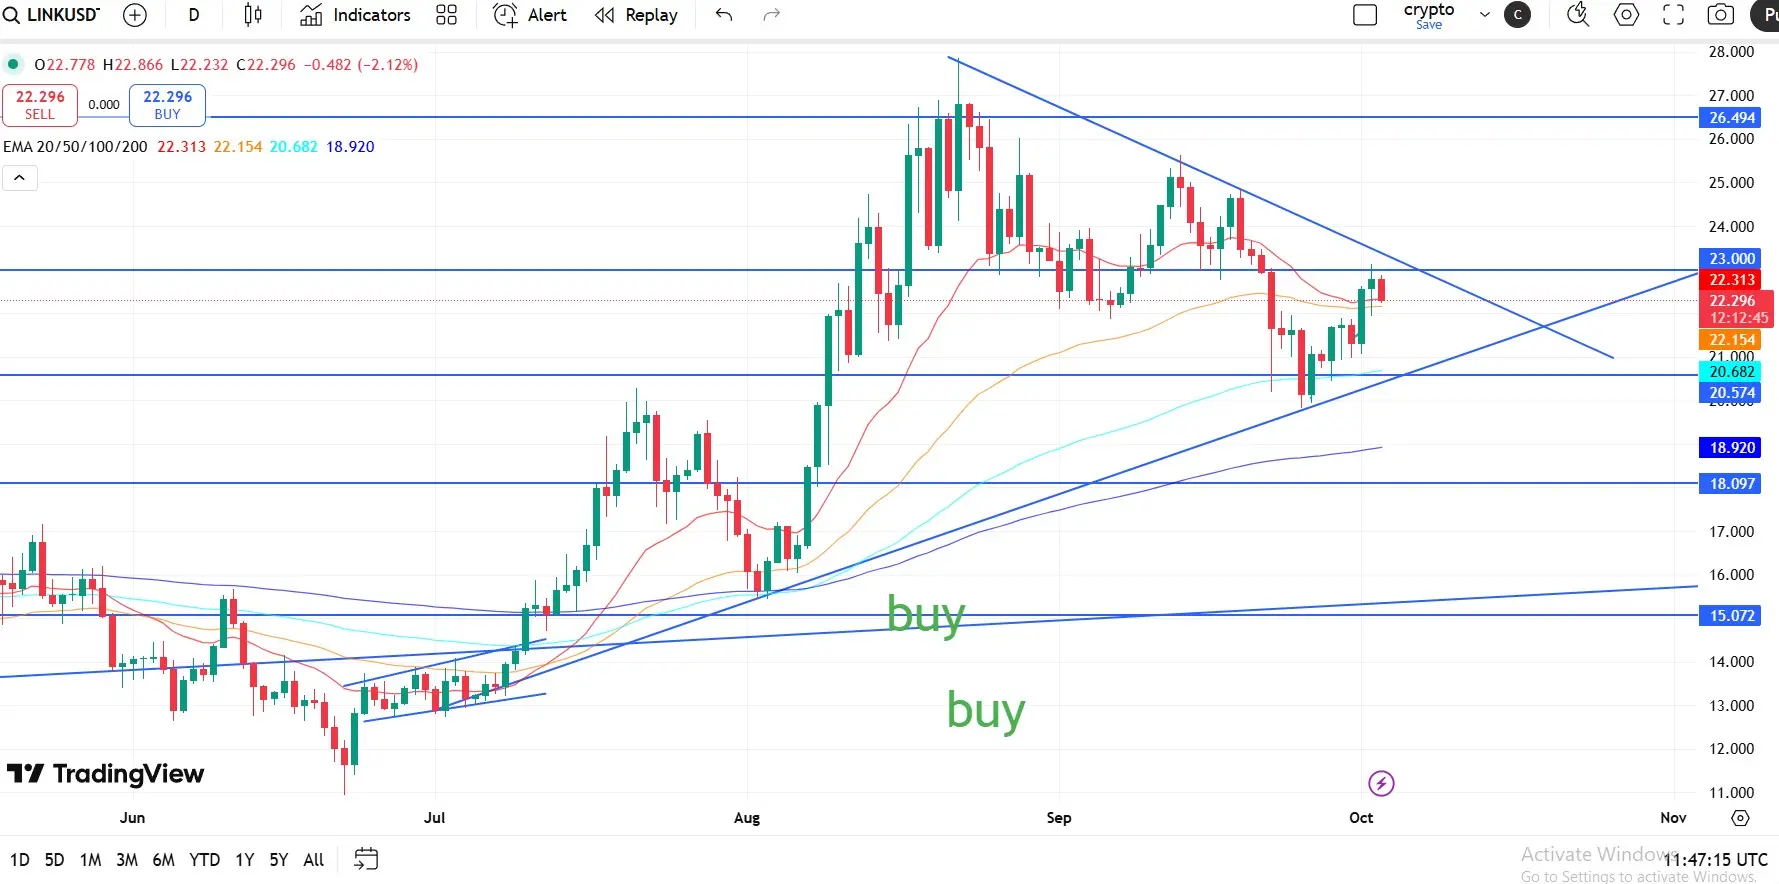
Chainlink at a Crossroads: Pressure Builds Near 50-day EMA
Chainlink (LINK) is showing signs of fatigue after slipping 2% on Friday, now testing the strength of its 50-day Exponential Moving Average (EMA) at $22.154. This decline follows two consecutive sessions of gains and puts LINK at risk of an early reversal within the broader symmetrical triangle pattern seen on the daily chart.
A breakdown below the 50-day EMA would expose the next support near the 100-day EMA at $20.682, aligning with the triangle’s lower boundary.
On the momentum side, indicators remain indecisive. The Relative Streng
LINK4.18%
- Reward
- 5
- 6
- Repost
- Share
Discovery:
Ape In 🚀View More
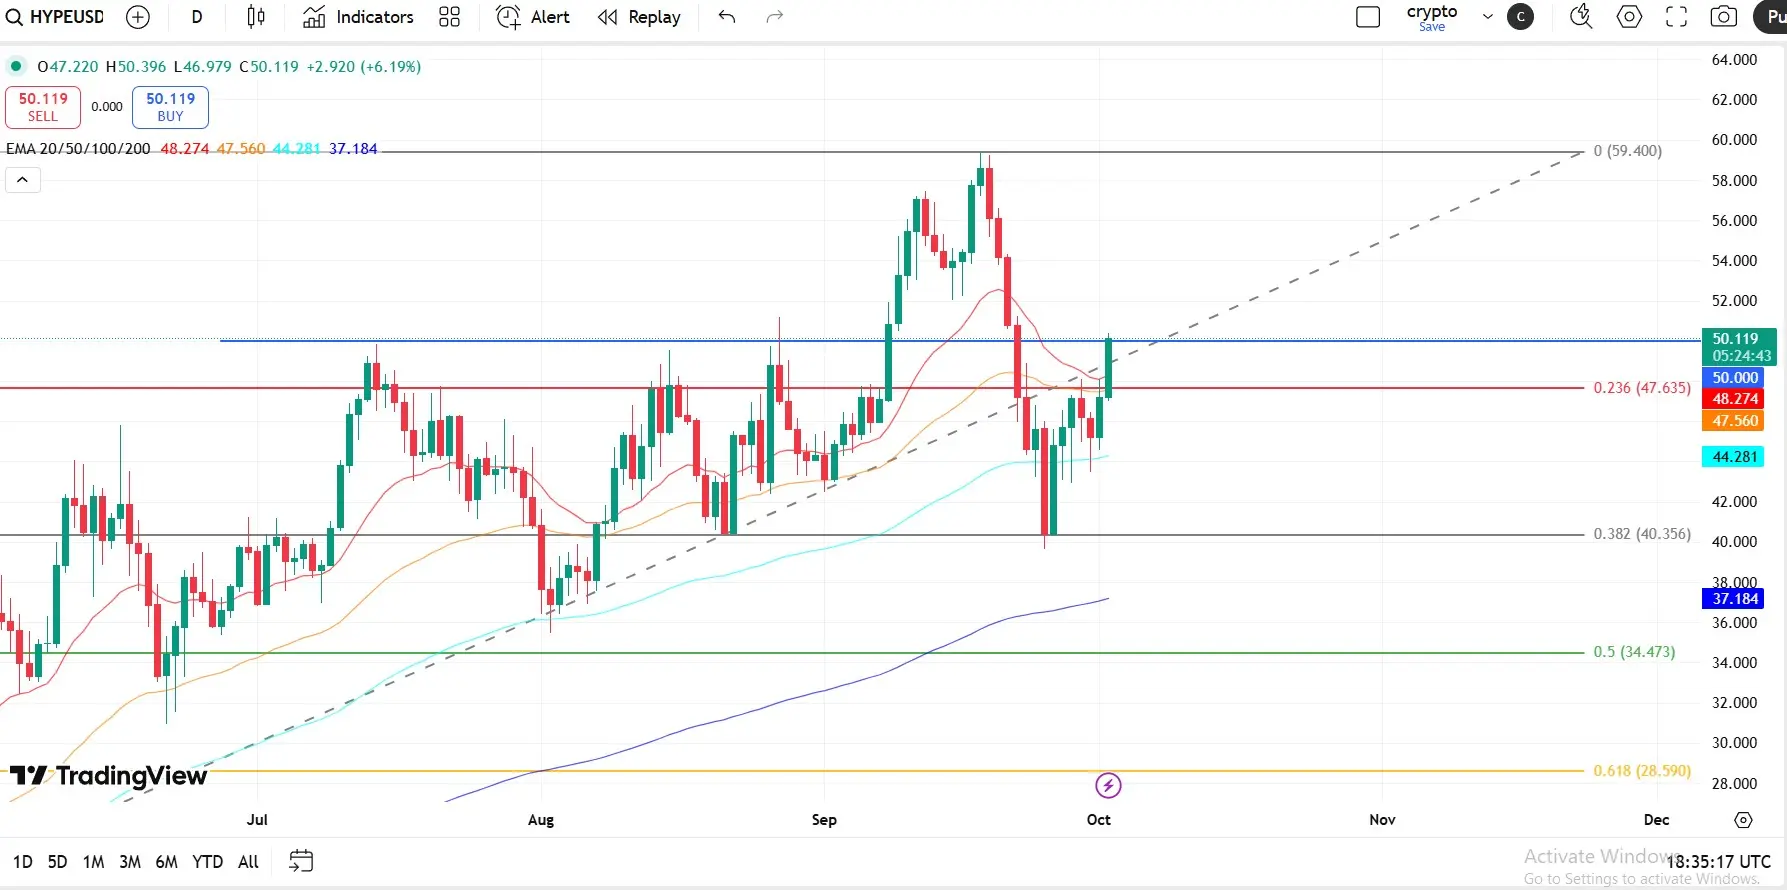
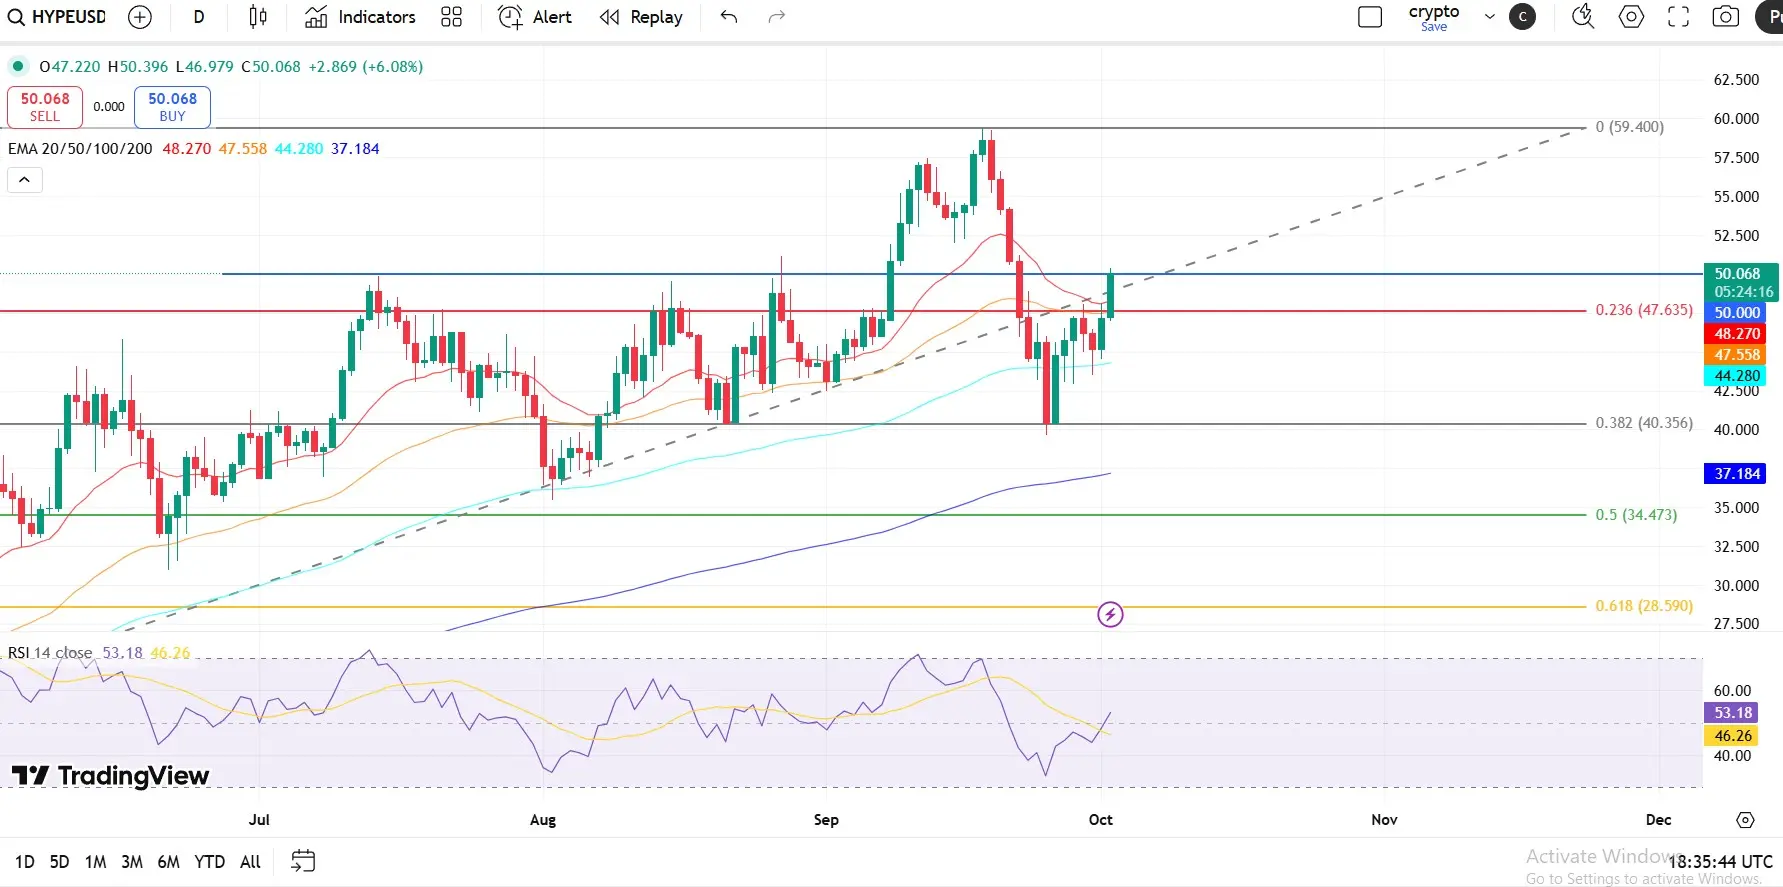
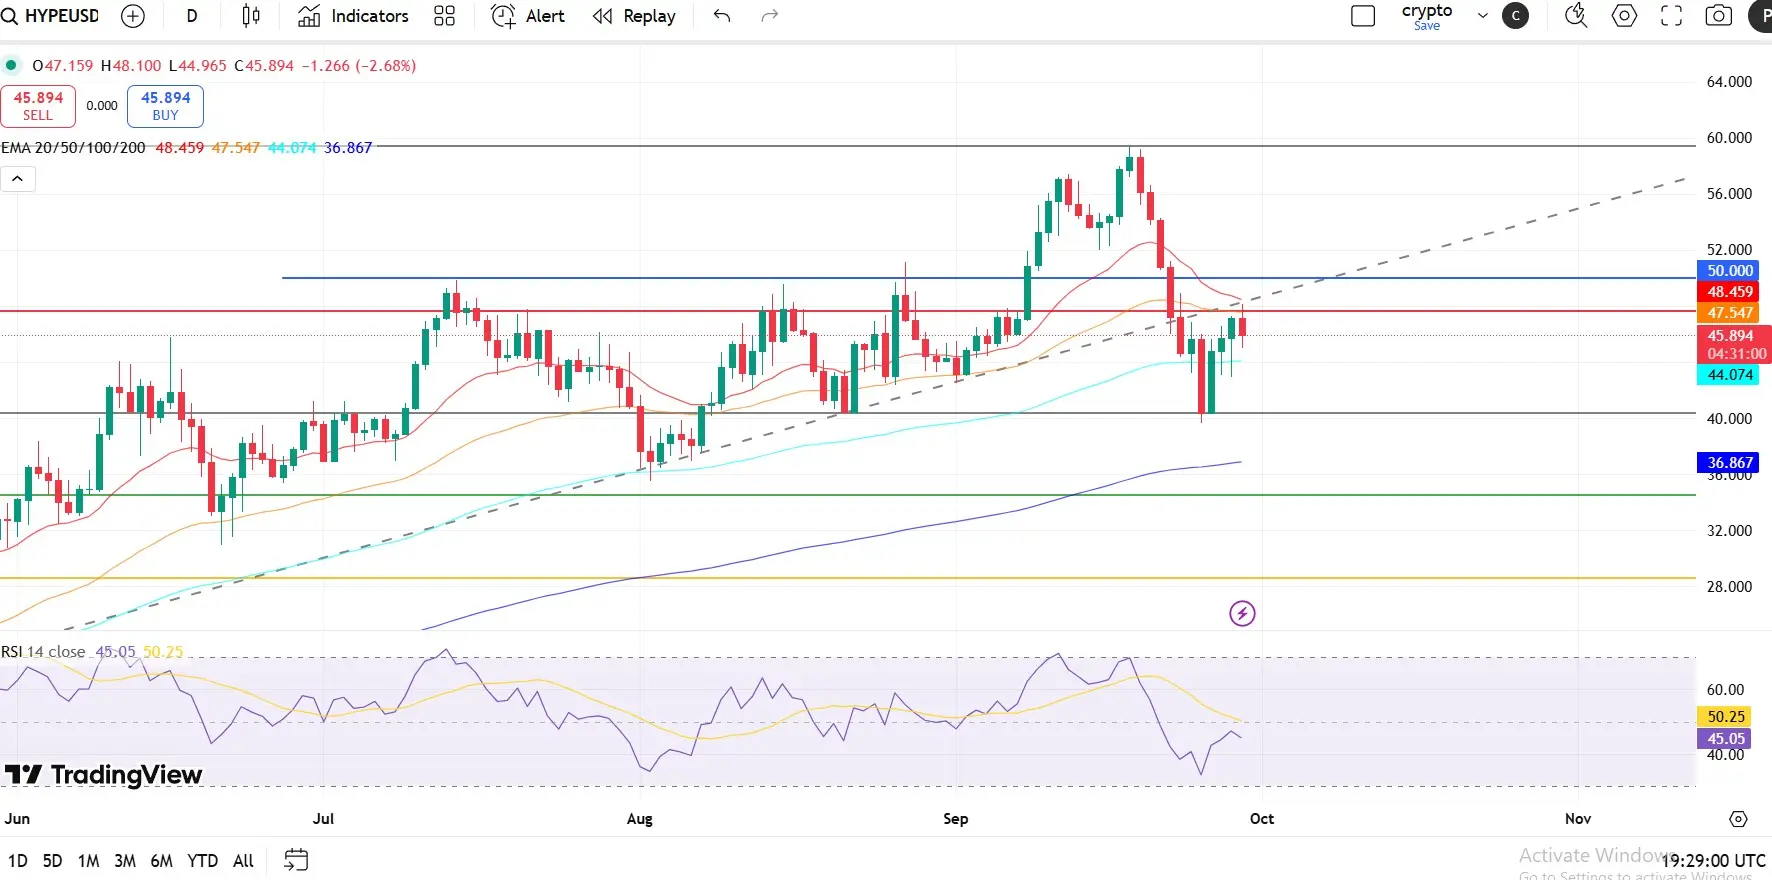
Technical Outlook: Hype Targets Breakout Above $50
Hyperliquid (HYPE) is gearing up for a potential breakout as it approaches the critical $50.00 resistance level. Positive sentiment across the broader crypto market is fueling momentum, while technical indicators are aligning in favor of the bulls.
The RSI sits at 53 on the daily chart and continues to rise alongside price action, signaling easing selling pressure and growing accumulation. Meanwhile, the MACD is on the verge of flashing a buy signal — a crossover above the red signal line, supported by expanding green histogram bars, would fur
HYPE5.29%
- Reward
- 13
- 6
- Repost
- Share
Ybaser:
HODL Tight 💪View More
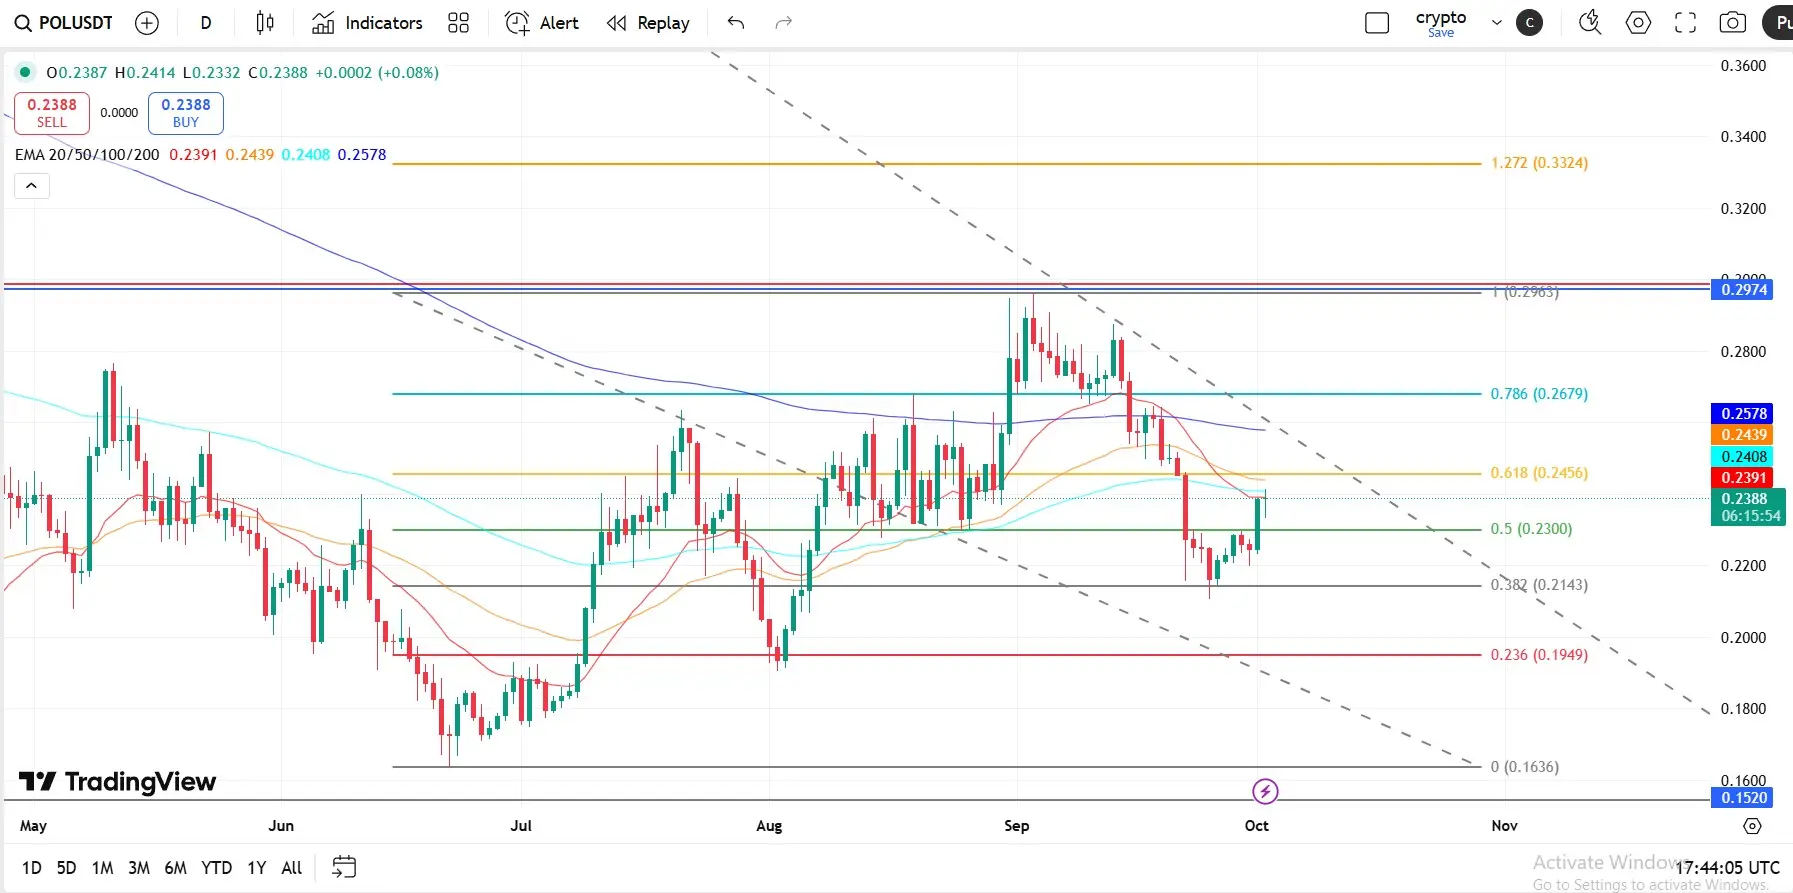
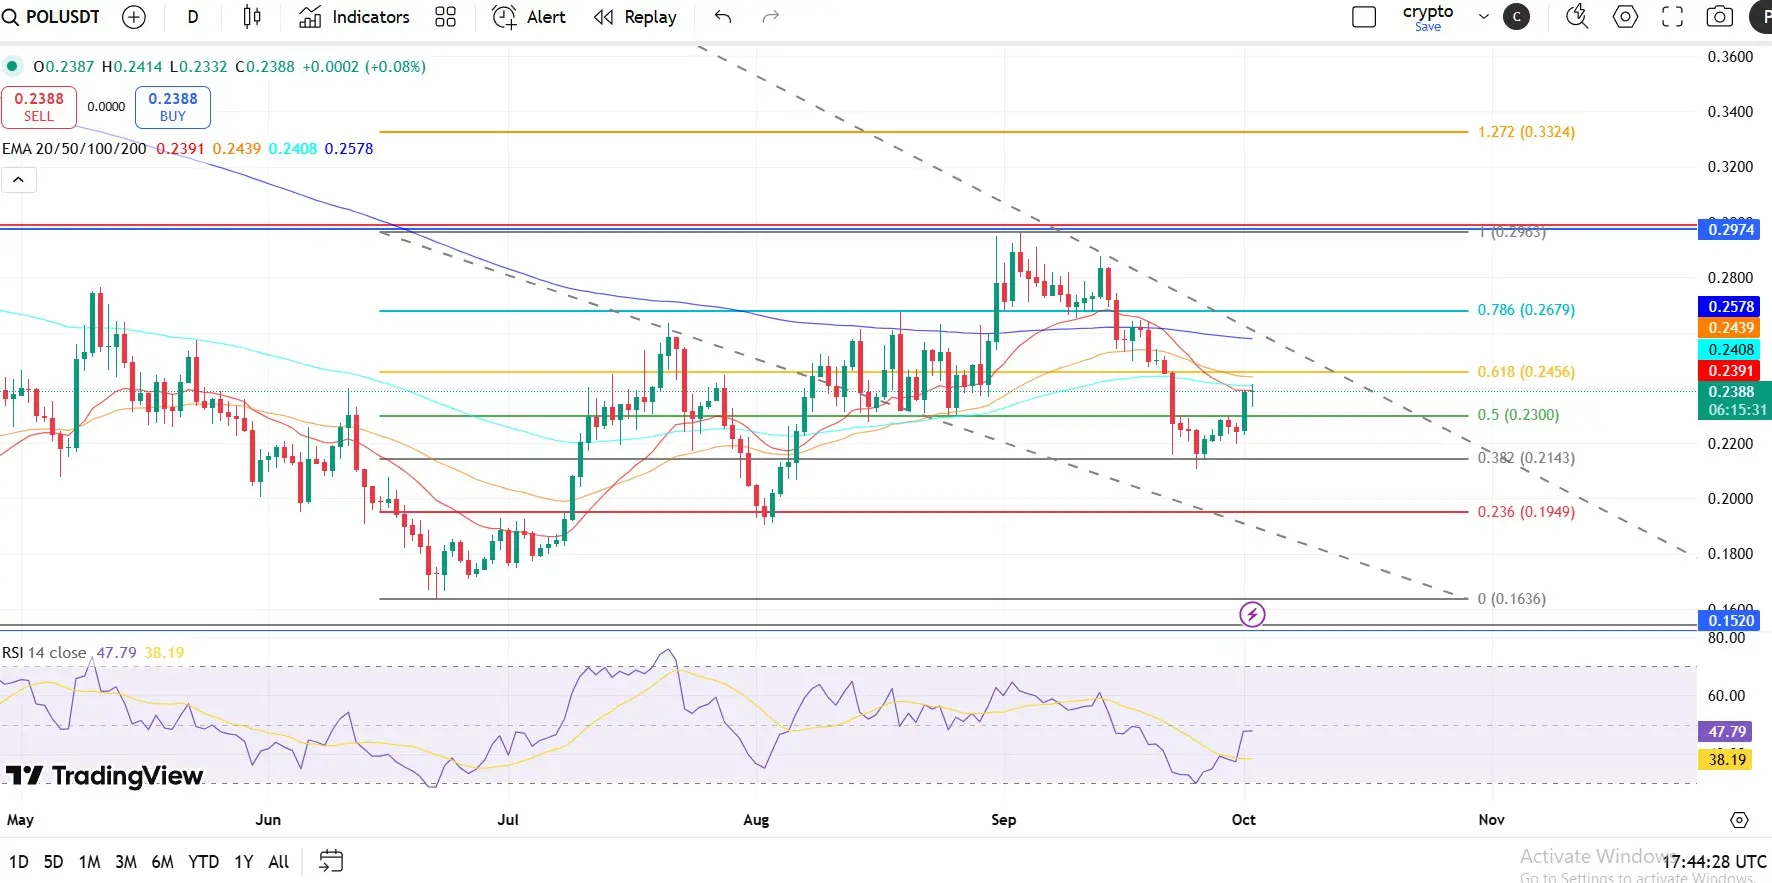
Technical Outlook: Can POL Overcome Key Barriers?
POL is facing a critical test as it trades below major moving averages — the 100-day EMA at $0.2408, the 50-day EMA at $0.2439, and the 200-day EMA at $0.2578. Until these levels are reclaimed as solid support, the recovery momentum that emerged last week could begin to fade.
The RSI reading at 47–48 has started to show signs of weakness, signaling that bullish momentum is losing traction. This softening momentum, combined with potential profit-taking, raises the risk of a pullback toward immediate support at $0.23, and possibly a deeper dip to
POL3.16%
- Reward
- 10
- 7
- Repost
- Share
GateUser-b0376049:
HODL Tight 💪View More
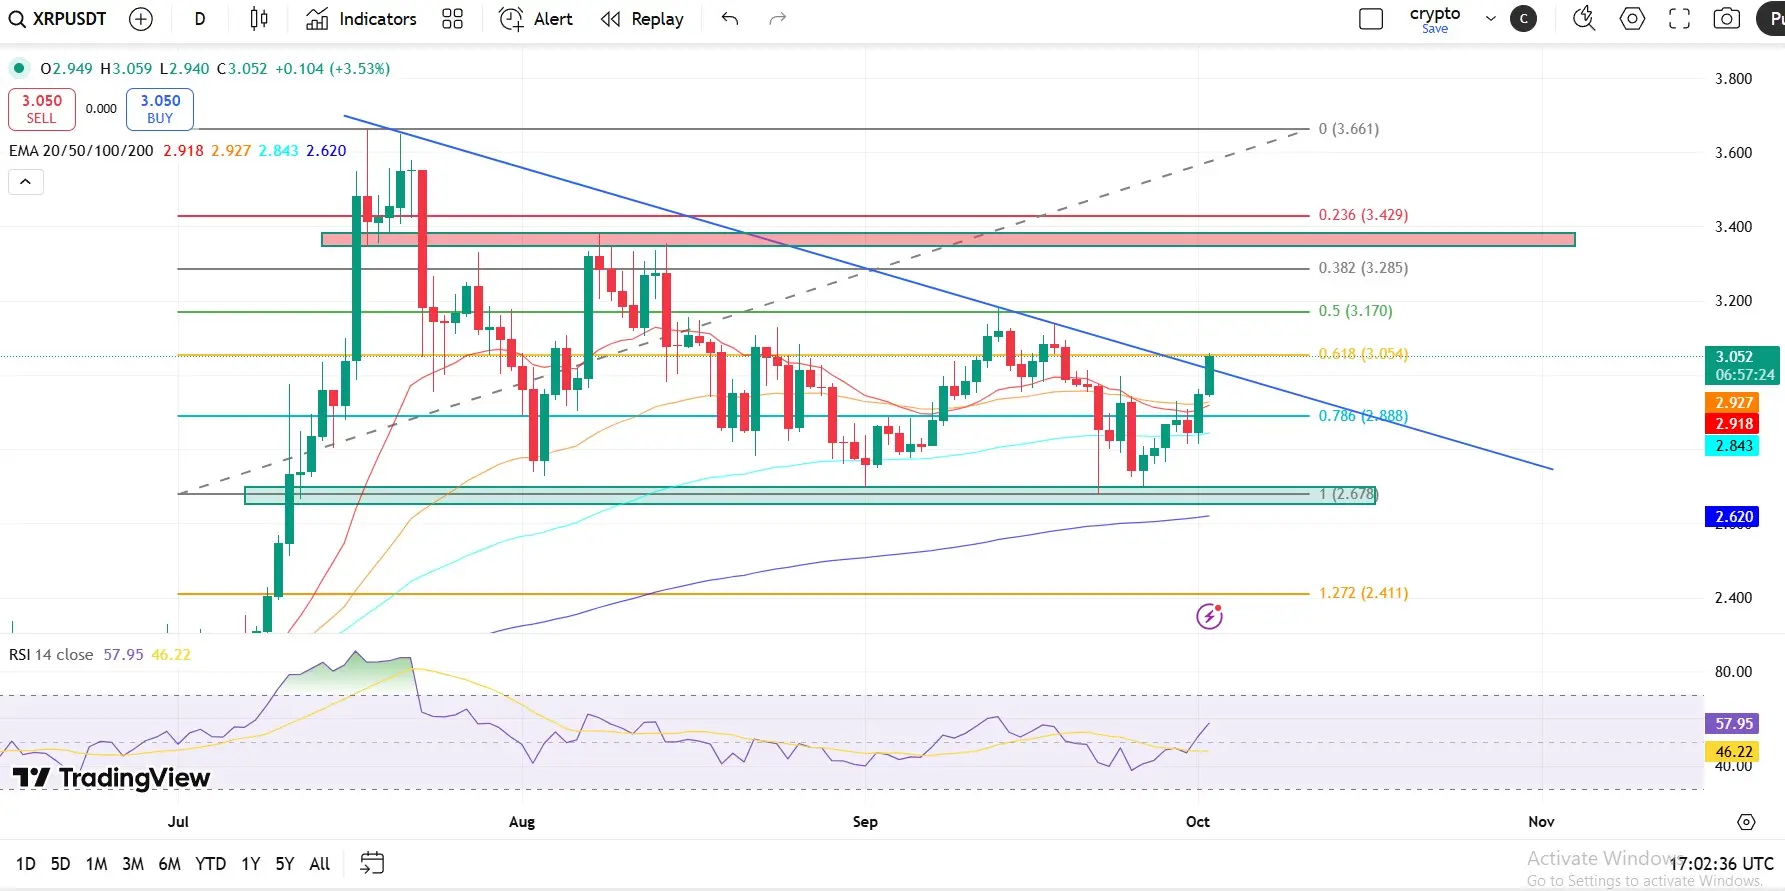
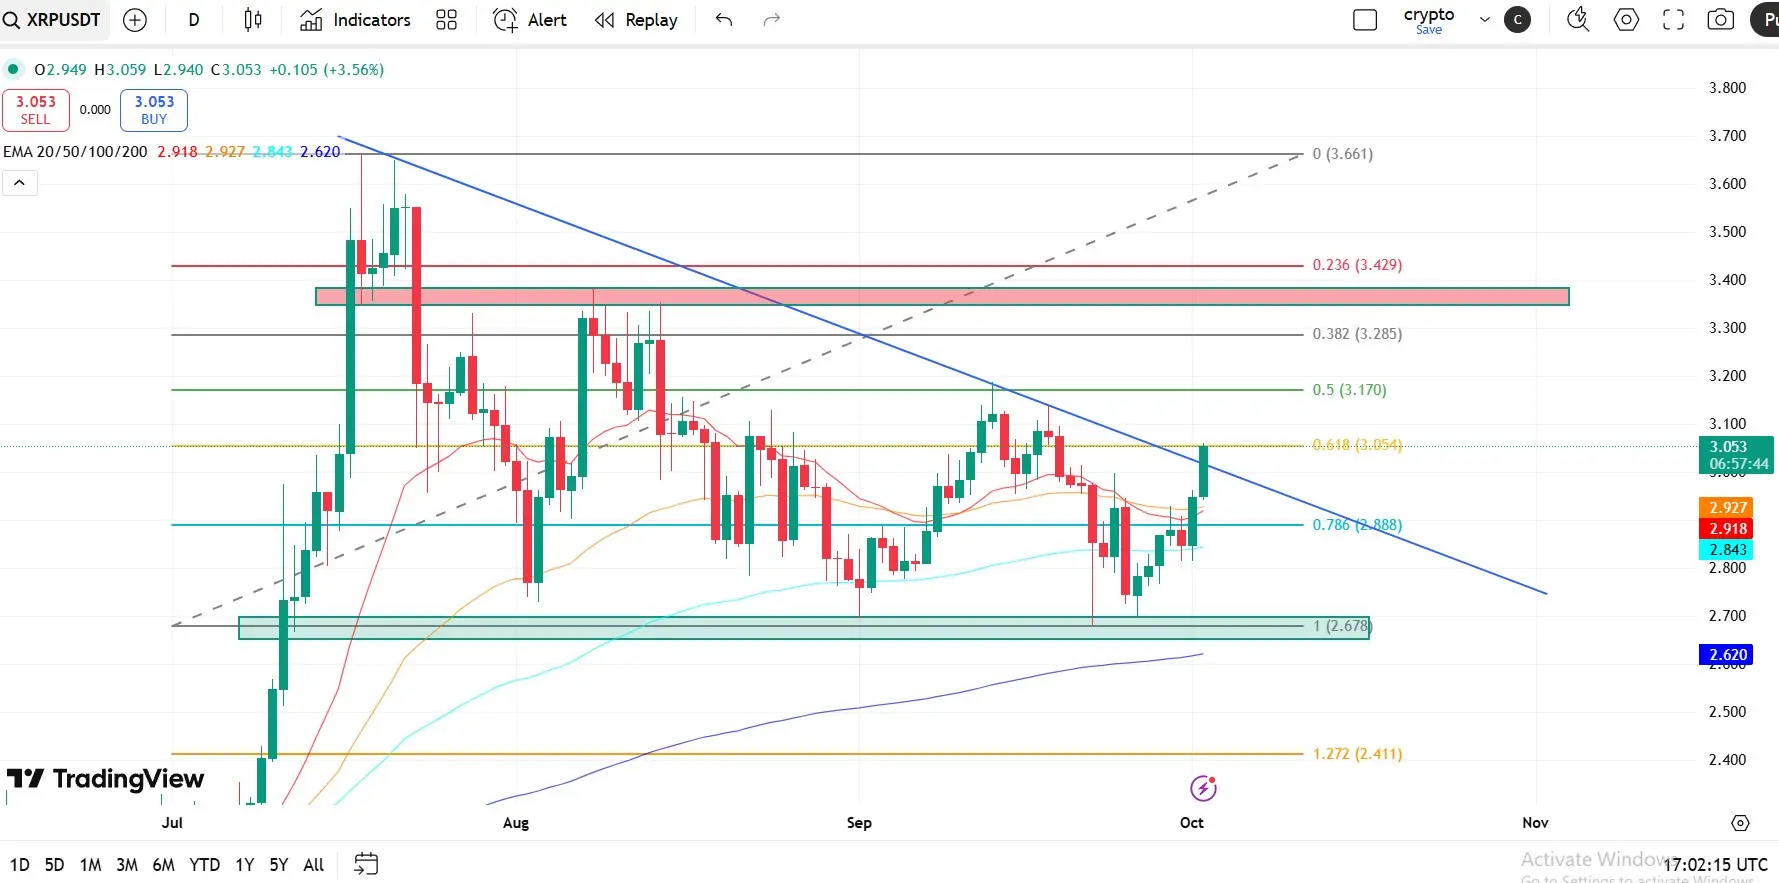
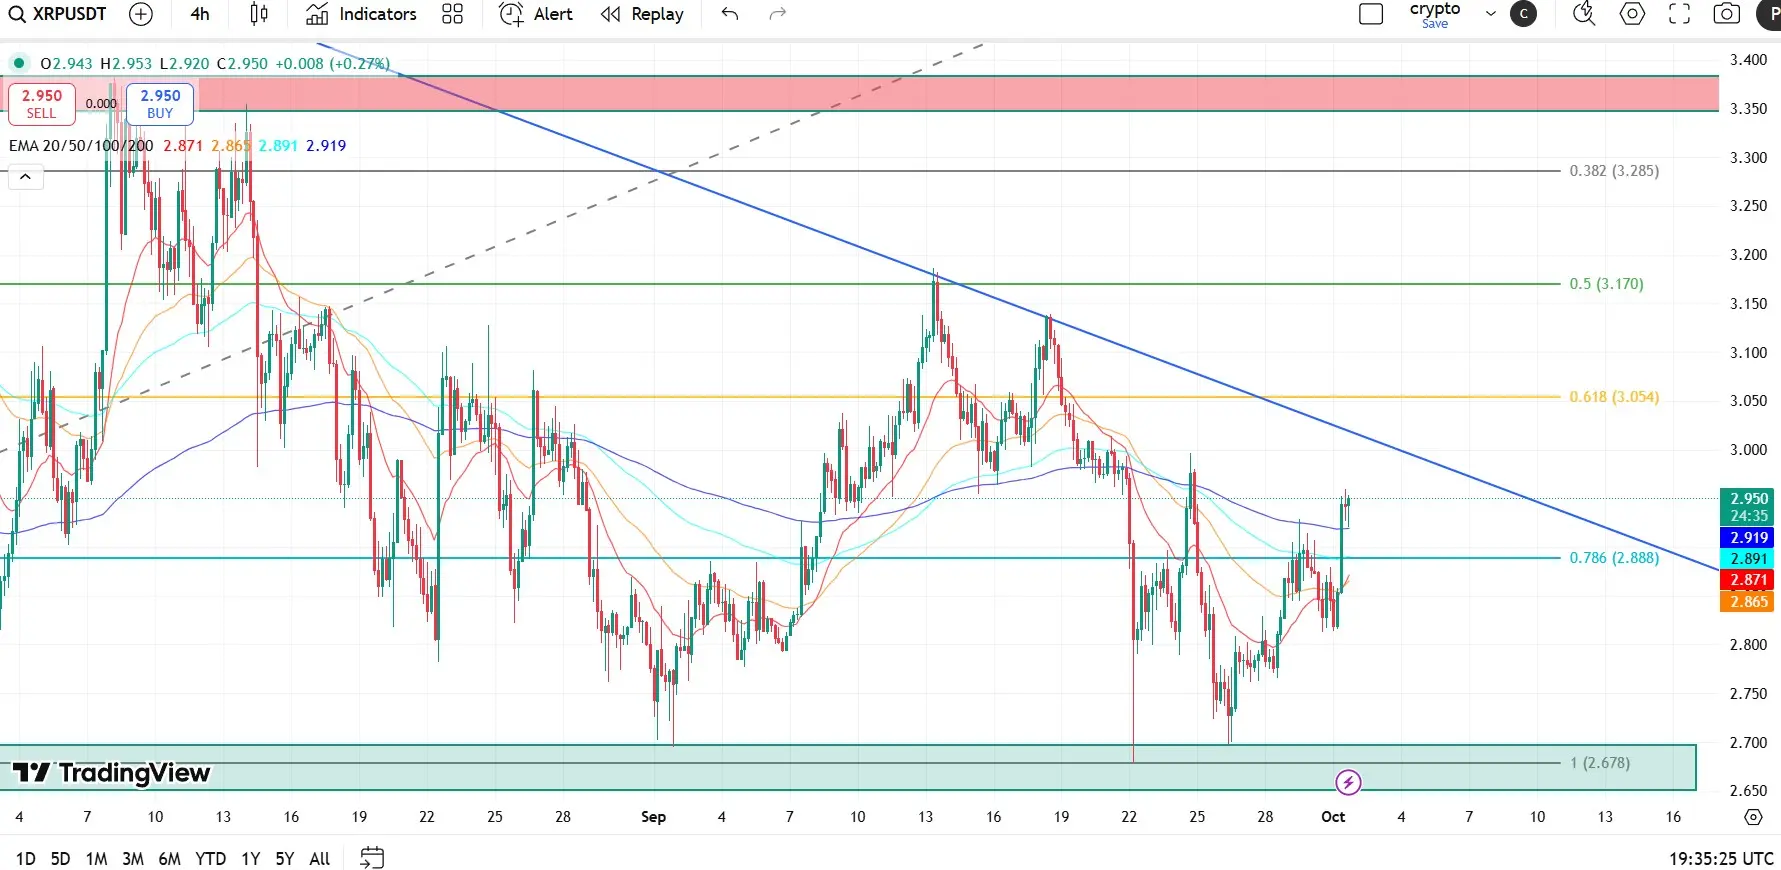
Technical Outlook: XRP bulls push for breakout above $3.00
XRP is showing renewed strength after holding above the 50-day Exponential Moving Average (EMA), currently positioned at $2.92, translating to intraday gains of just over 3-4% on Thursday.
📊 Momentum Indicators
The Relative Strength Index (RSI) has climbed to 57, signaling easing selling pressure and strengthening bullish momentum.
The Moving Average Convergence Divergence (MACD) remains in buy mode after Wednesday’s bullish crossover, further validating buyer interest.
📈 Price Structure
Since mid-July, when XRP hit its all-time high
XRP1.56%
- Reward
- 13
- 7
- 1
- Share
Furuixianghe:
HODL Tight 💪 HODL Tight 💪 HODL Tight 💪View More
- Reward
- 9
- 8
- Repost
- Share
Cryptogether :
:
HODL Tight 💪View More
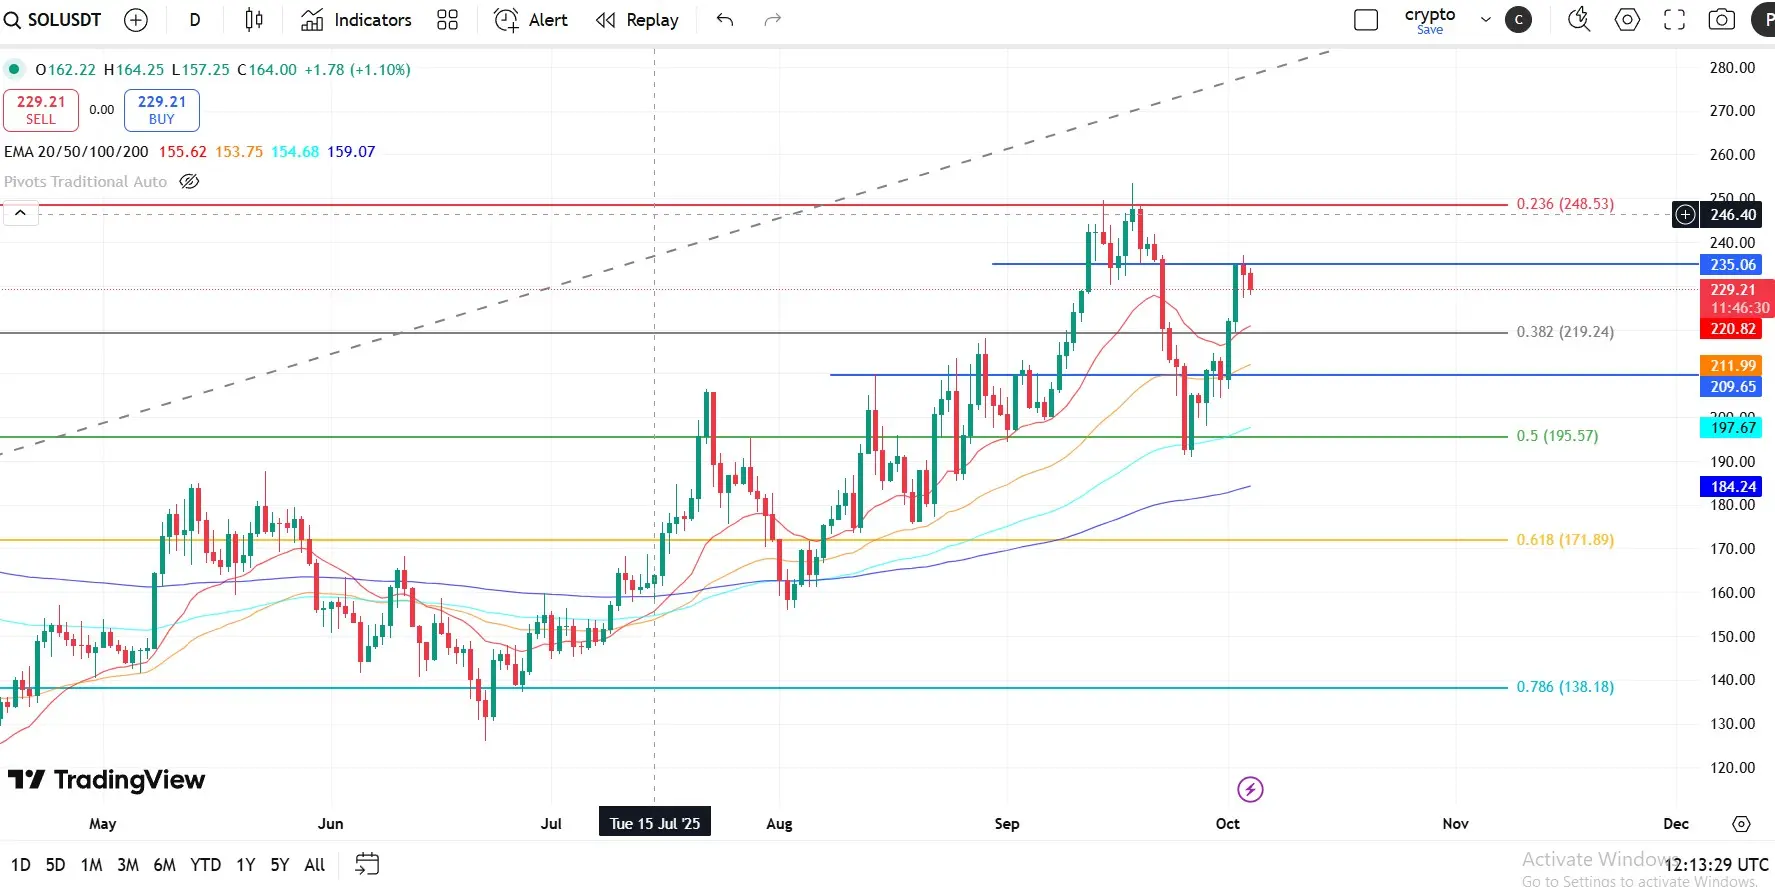
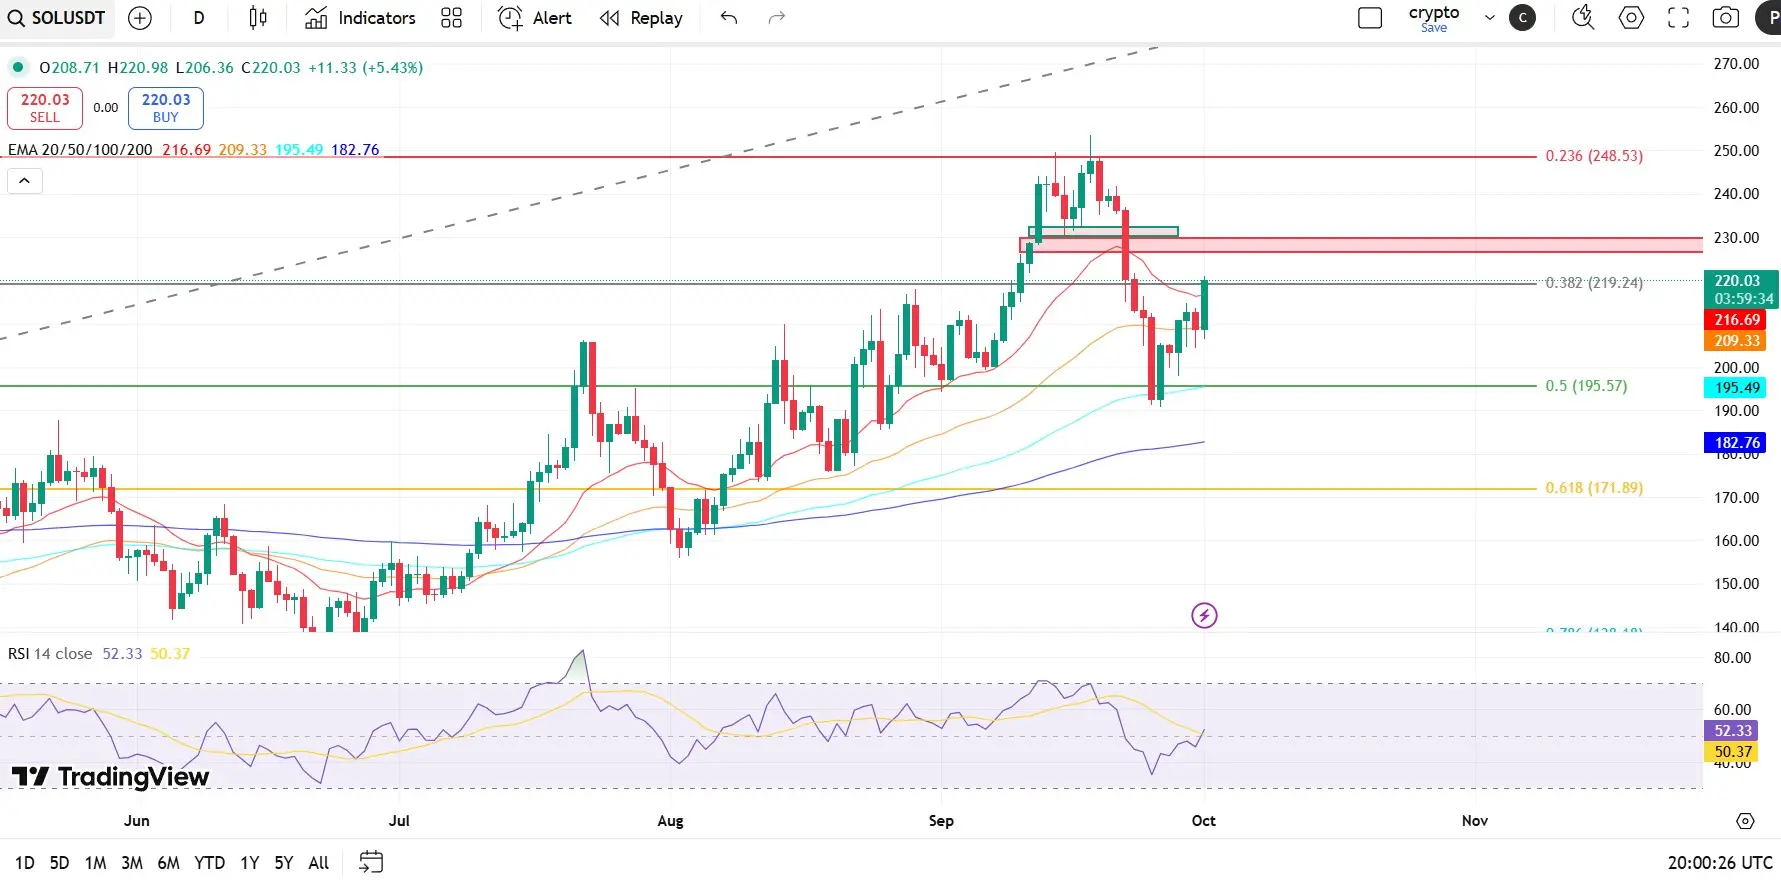
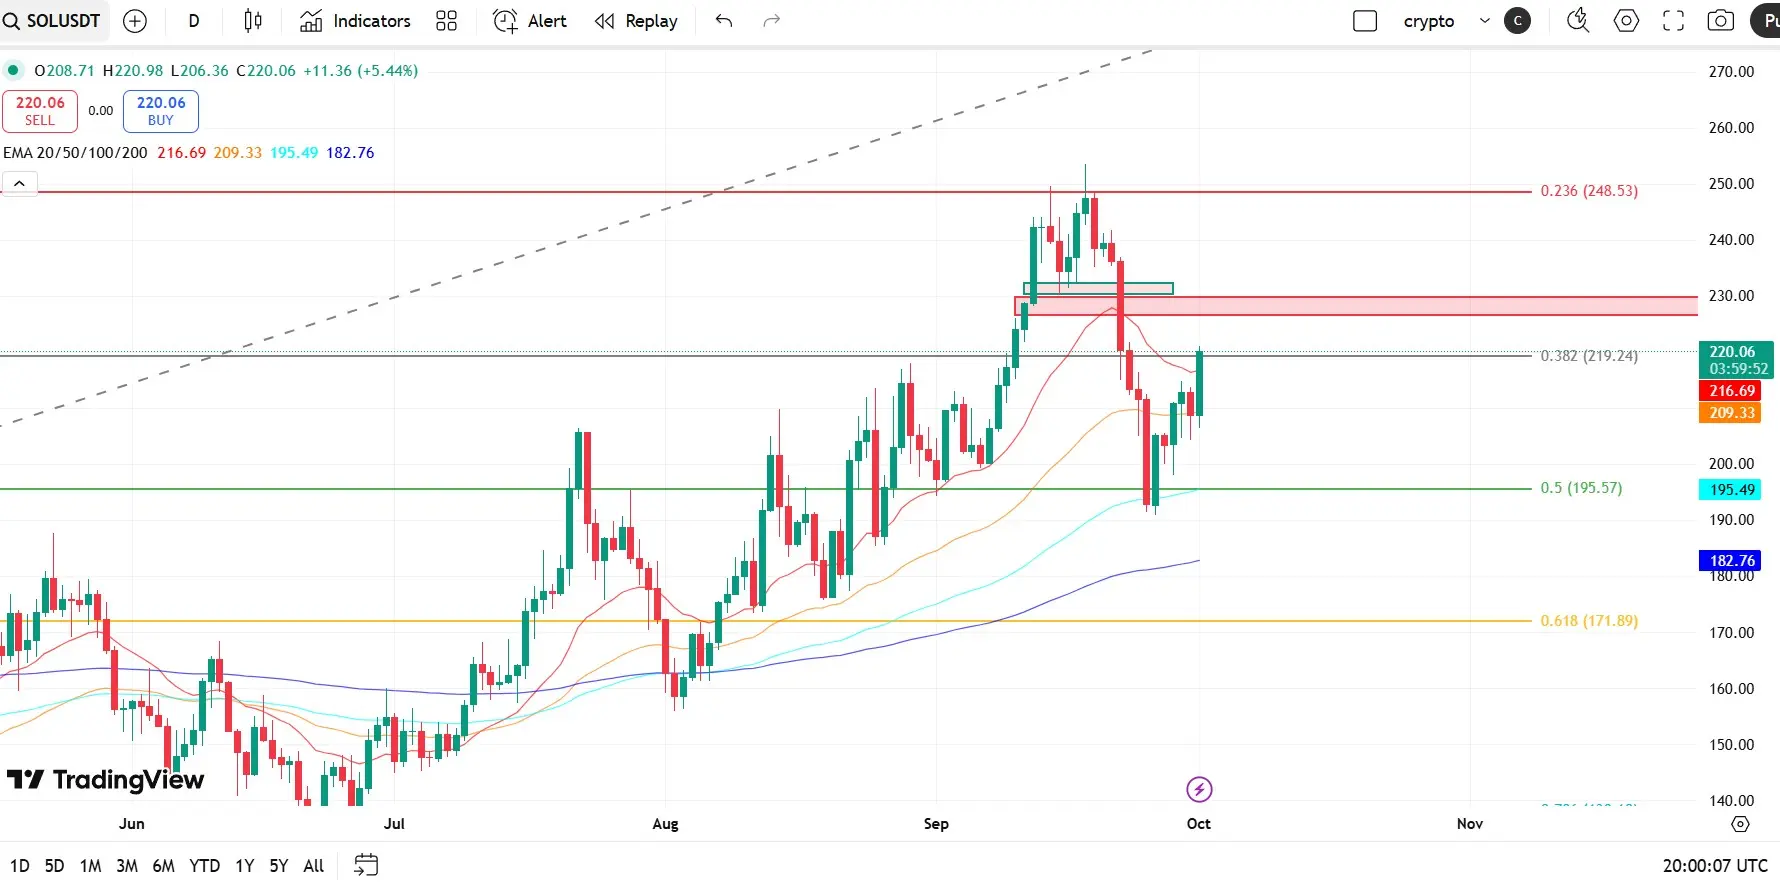
Solana rallies 7%, faces key resistance test at $219
Solana (SOL) has surged by 7% in the past 24 hours, backed by strong buying momentum after bulls successfully defended the $209 support zone. The Layer-1 token has also cleared its key short-term averages, trading above the 20-day EMA at $216.7, while maintaining strength over the 50-day EMA at $209, the 100-day EMA at $195.5, and the 200-day EMA at $182.76. This alignment of moving averages reflects a supportive bullish structure.
Currently, SOL is challenging the 38.2% Fibonacci Retracement level at $219, a crucial resistance area. A decis
SOL3.27%
- Reward
- 25
- 12
- Repost
- Share
Sakura_3434:
Just go for it💪View More
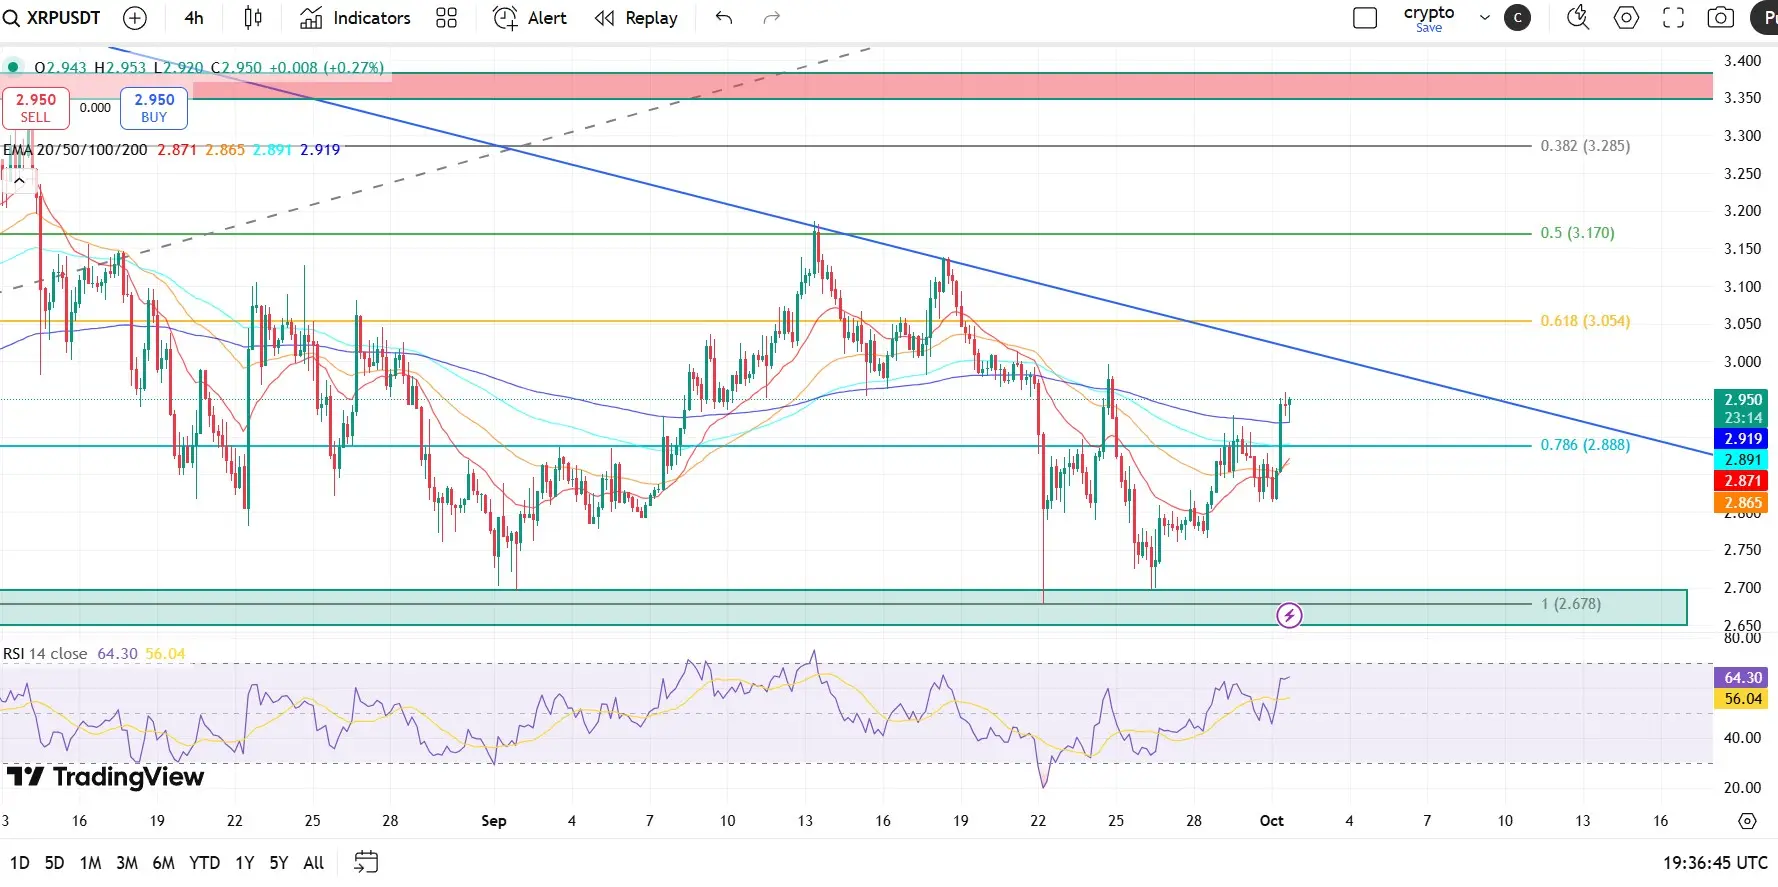
Technical Outlook: XRP builds short-term bullish momentum
XRP shows renewed strength as it trades above crucial moving averages on the 4-hour chart — including the 200 EMA at $2.92, 100 EMA at $2.89, and 50 EMA at $2.865. Holding above these levels highlights growing confidence among market participants and aligns with the wider bullish sentiment in the crypto market.
The Relative Strength Index (RSI) sits at 64, up sharply from oversold levels last week. This confirms an expansion in buying pressure, suggesting bulls continue to tighten their grip. In addition, the MACD has already flashed a
XRP1.56%
- Reward
- 26
- 13
- 1
- Share
JOHAR09 :
:
thank you 🍀View More
Pi Network rebounds, eyeing further upside momentum
Pi Network (PI) posts a 4% rebound on Wednesday, snapping a five-day consolidation phase. The renewed buying interest is reflected in the Relative Strength Index (RSI), which has climbed to 34 — resurfacing from oversold territory and signaling easing selling pressure. With more room to grow before reaching the neutral midline, momentum favors the bulls.
Meanwhile, the Moving Average Convergence Divergence (MACD) indicator shows early signs of recovery in the negative zone. Traders are closely monitoring a potential bullish crossover above th
PI0.45%
- Reward
- 12
- 6
- Repost
- Share
Ryakpanda:
Steadfast HODL💎View More
XRP at a Crossroads: Testing Key Support Levels Amid Bearish Signals
XRP price action is delicately balanced as it hovers around the 50-day Exponential Moving Average (EMA) at $2.92, a level that now doubles as both immediate support and resistance. The inability to firmly establish momentum above this zone highlights the growing downside pressure in the market.
On the daily chart, the Relative Strength Index (RSI) has slipped further into bearish territory, with a crossover below the signal line confirming the persistence of seller dominance. This alignment suggests that bulls may find it inc
XRP1.56%
- Reward
- 12
- 6
- Repost
- Share
Ybaser:
HODL Tight 💪View More
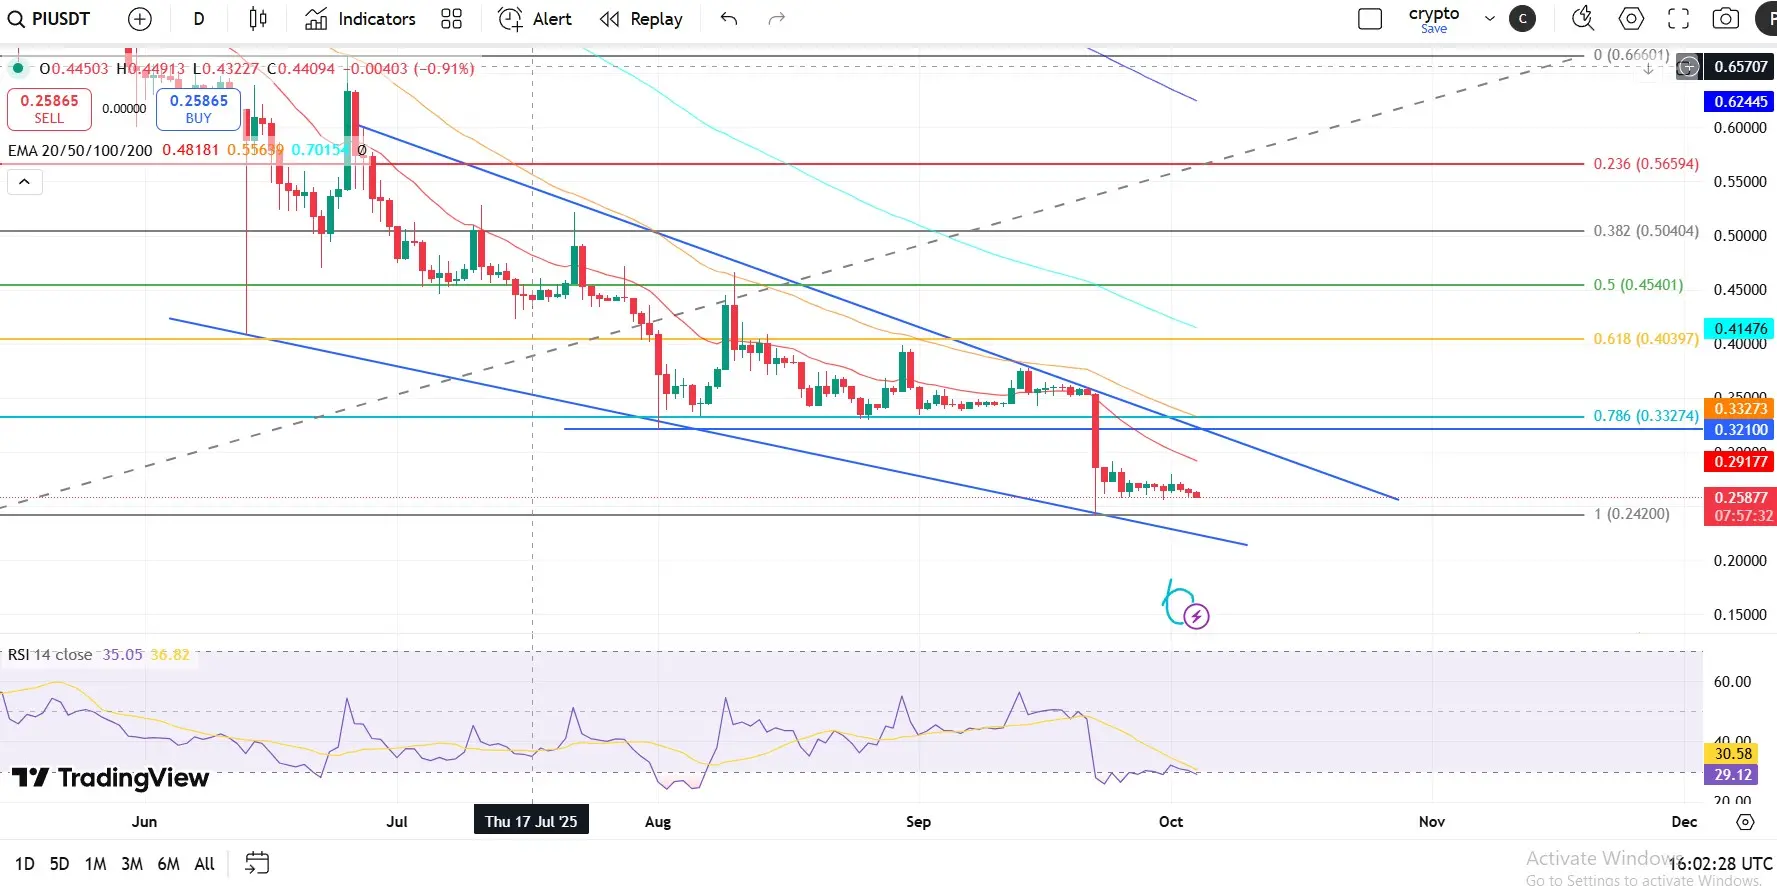
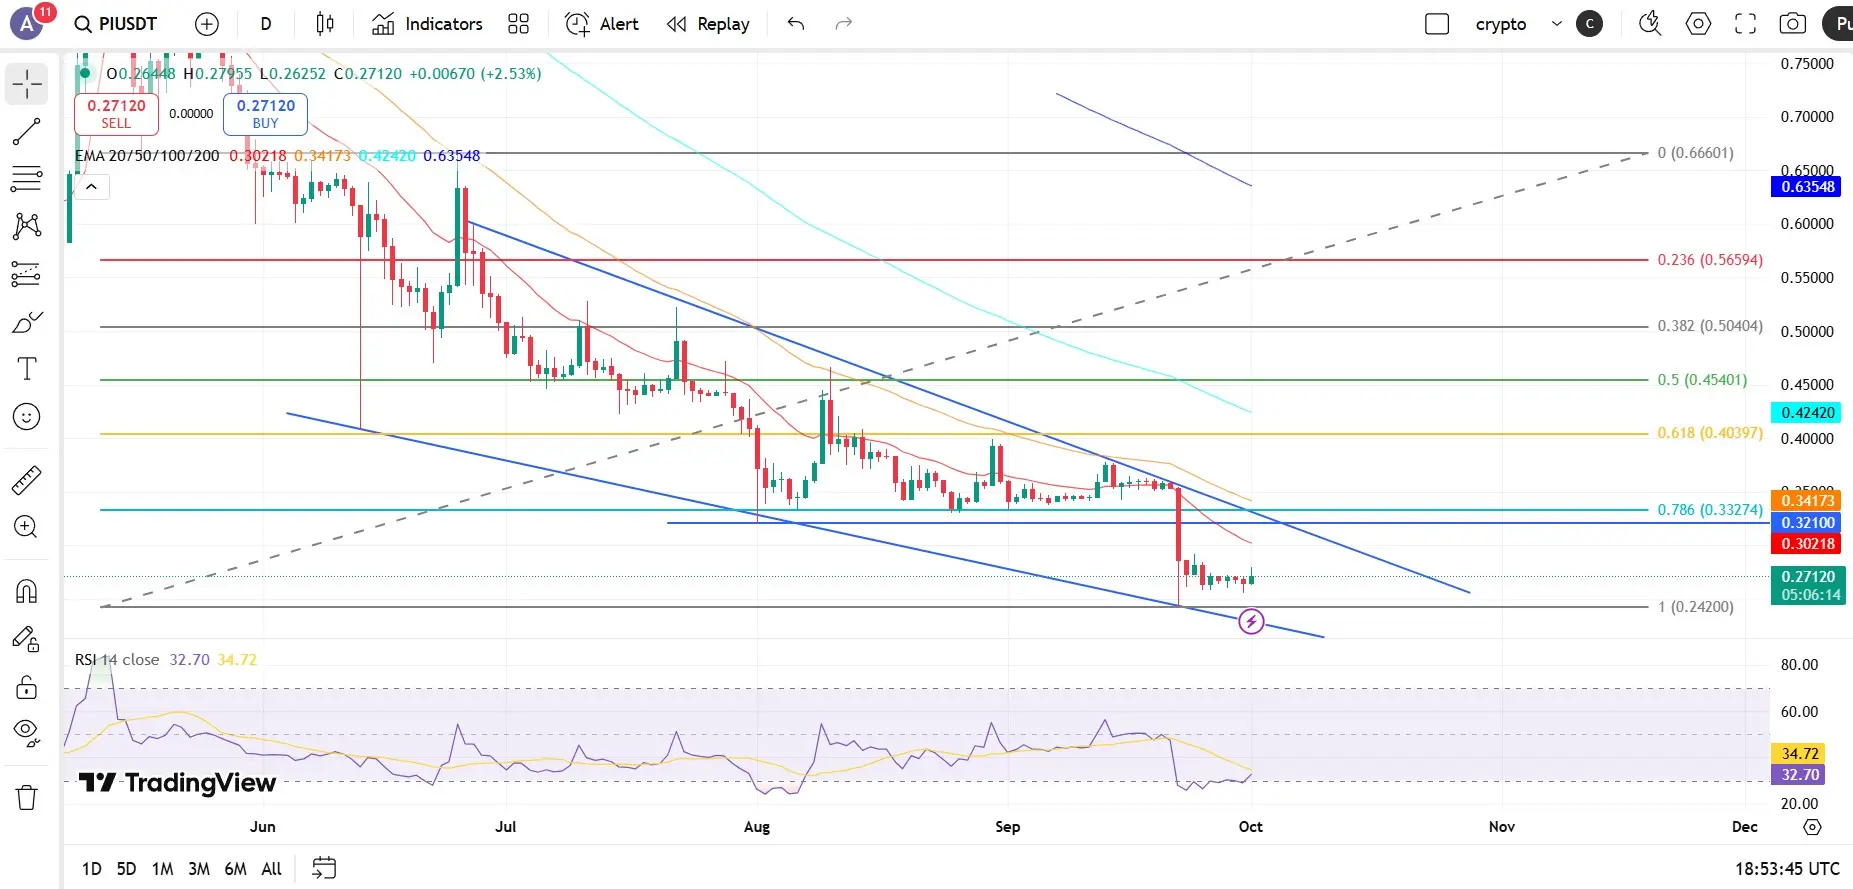
Pi Network at Risk of Breakdown but Oversold Signals Hint at Relief
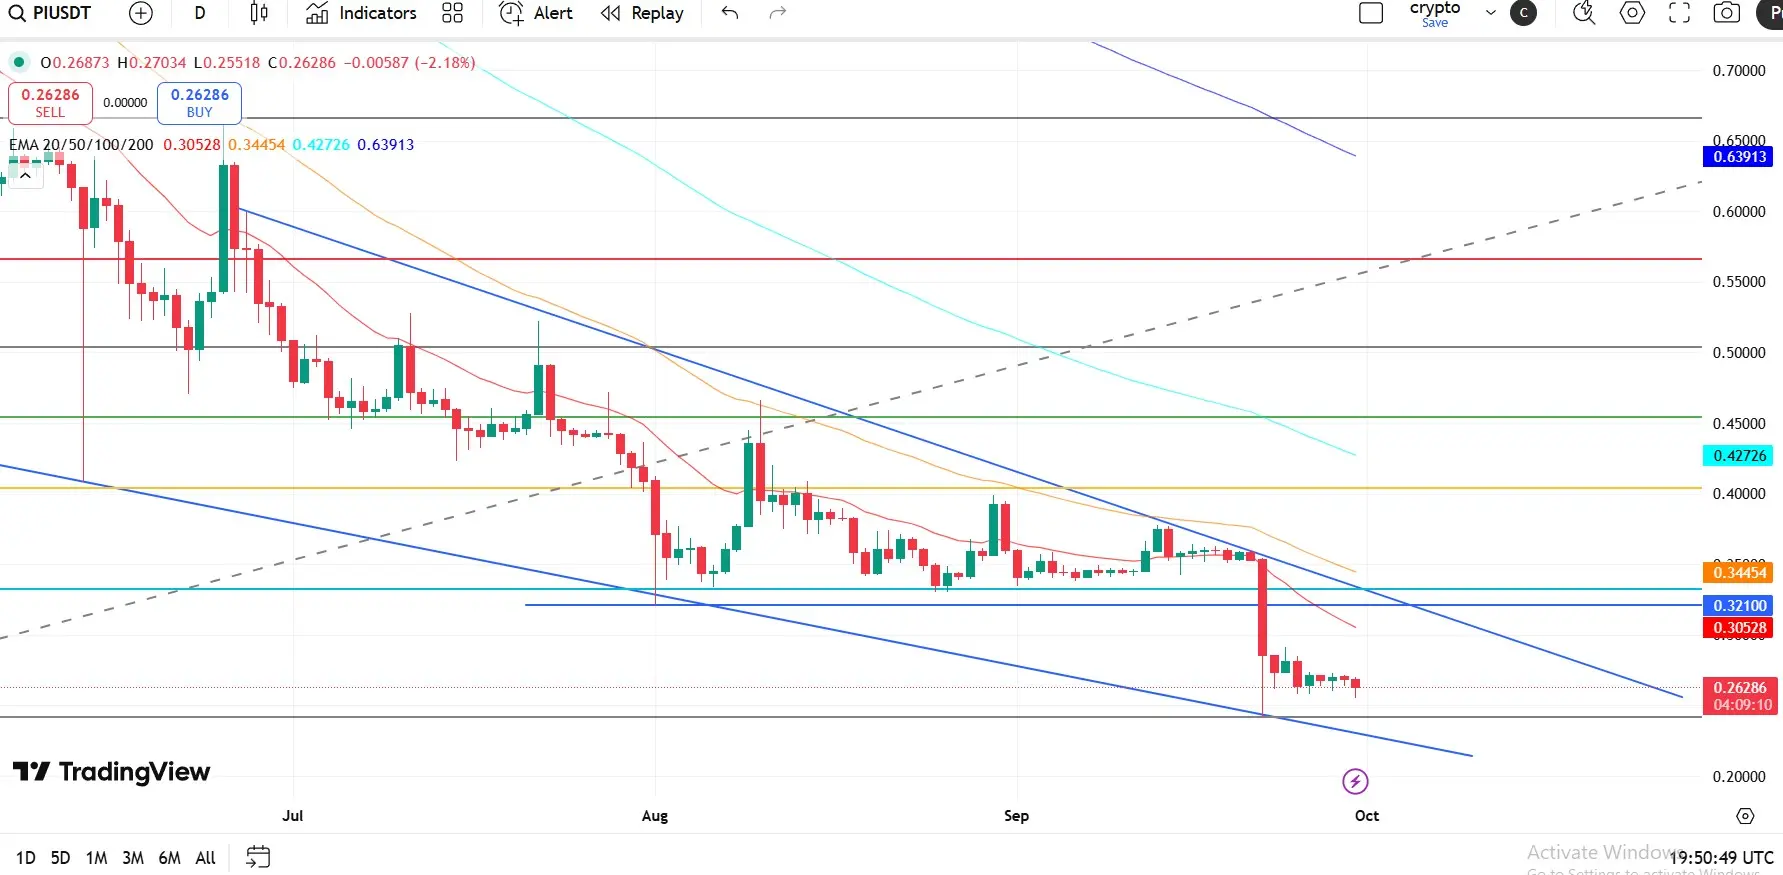
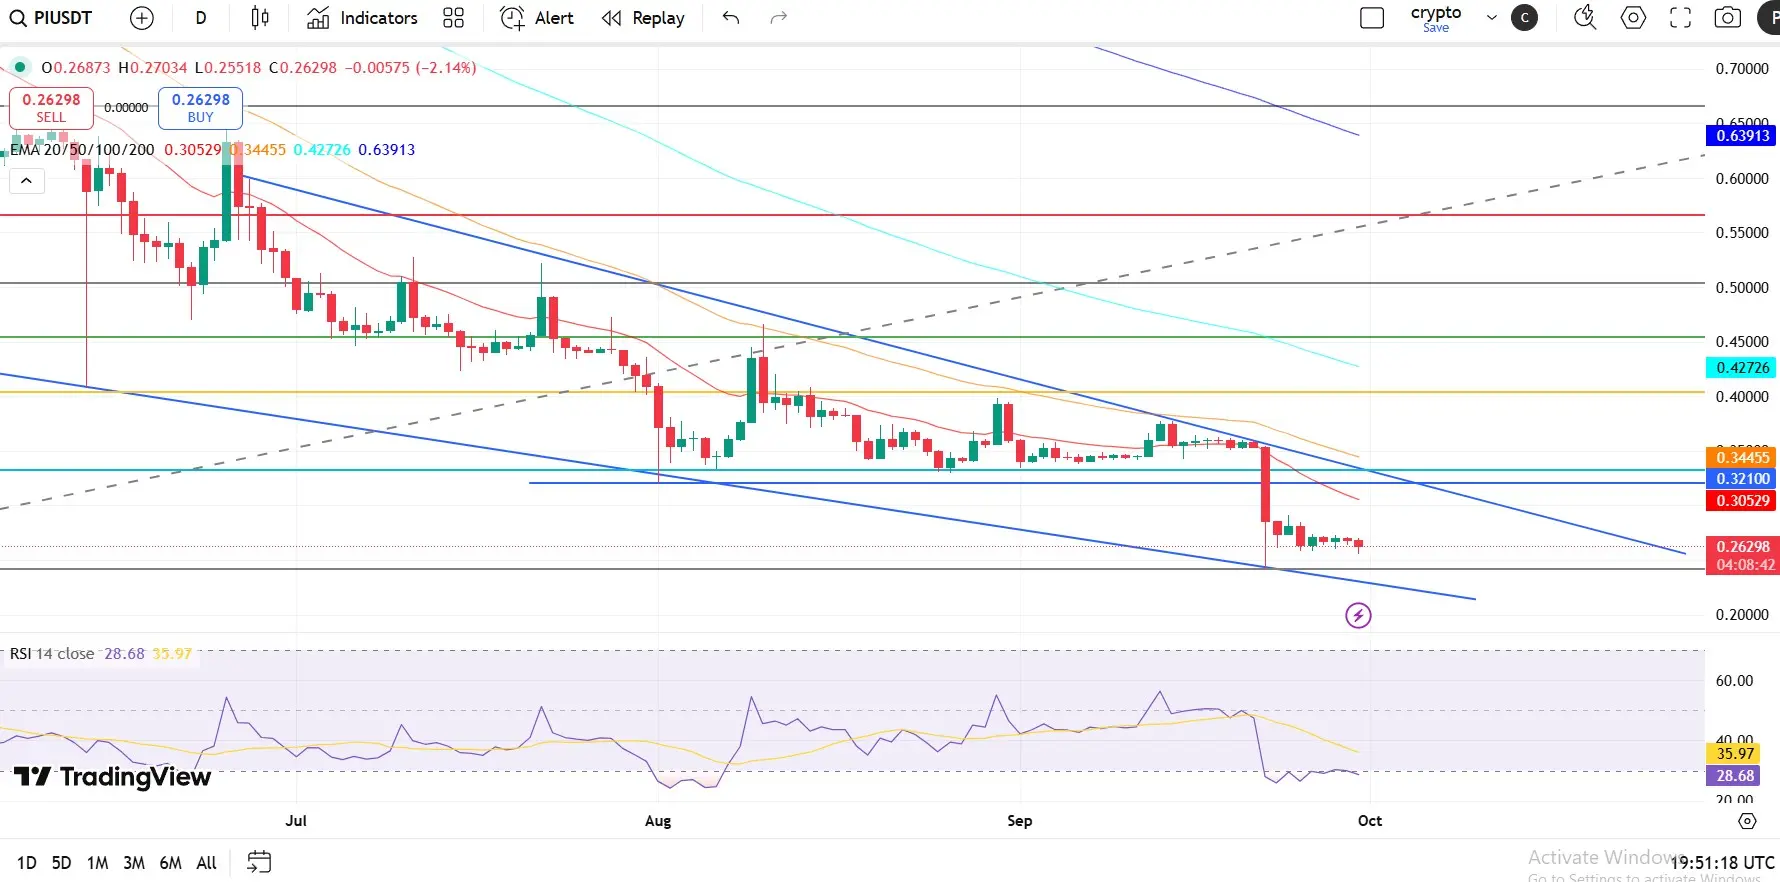
Pi Network (PI) trades slightly above the $0.2600 mark on Tuesday, stabilizing after last week’s sharp 6% decline. Despite the pause, market sentiment remains fragile as bears keep the token close to its recent swing low of $0.2579. A decisive move below this support could confirm a deeper pullback in the days ahead.
From a technical perspective, the Relative Strength Index (RSI) hovers at 28–29 on the daily chart, signaling heavily oversold conditions and hinting at a potential shift in momentum. At the same time, the Moving
PI0.45%
- Reward
- 5
- 7
- Repost
- Share
GateUser-9ced0d4c:
HODL Tight 💪View More
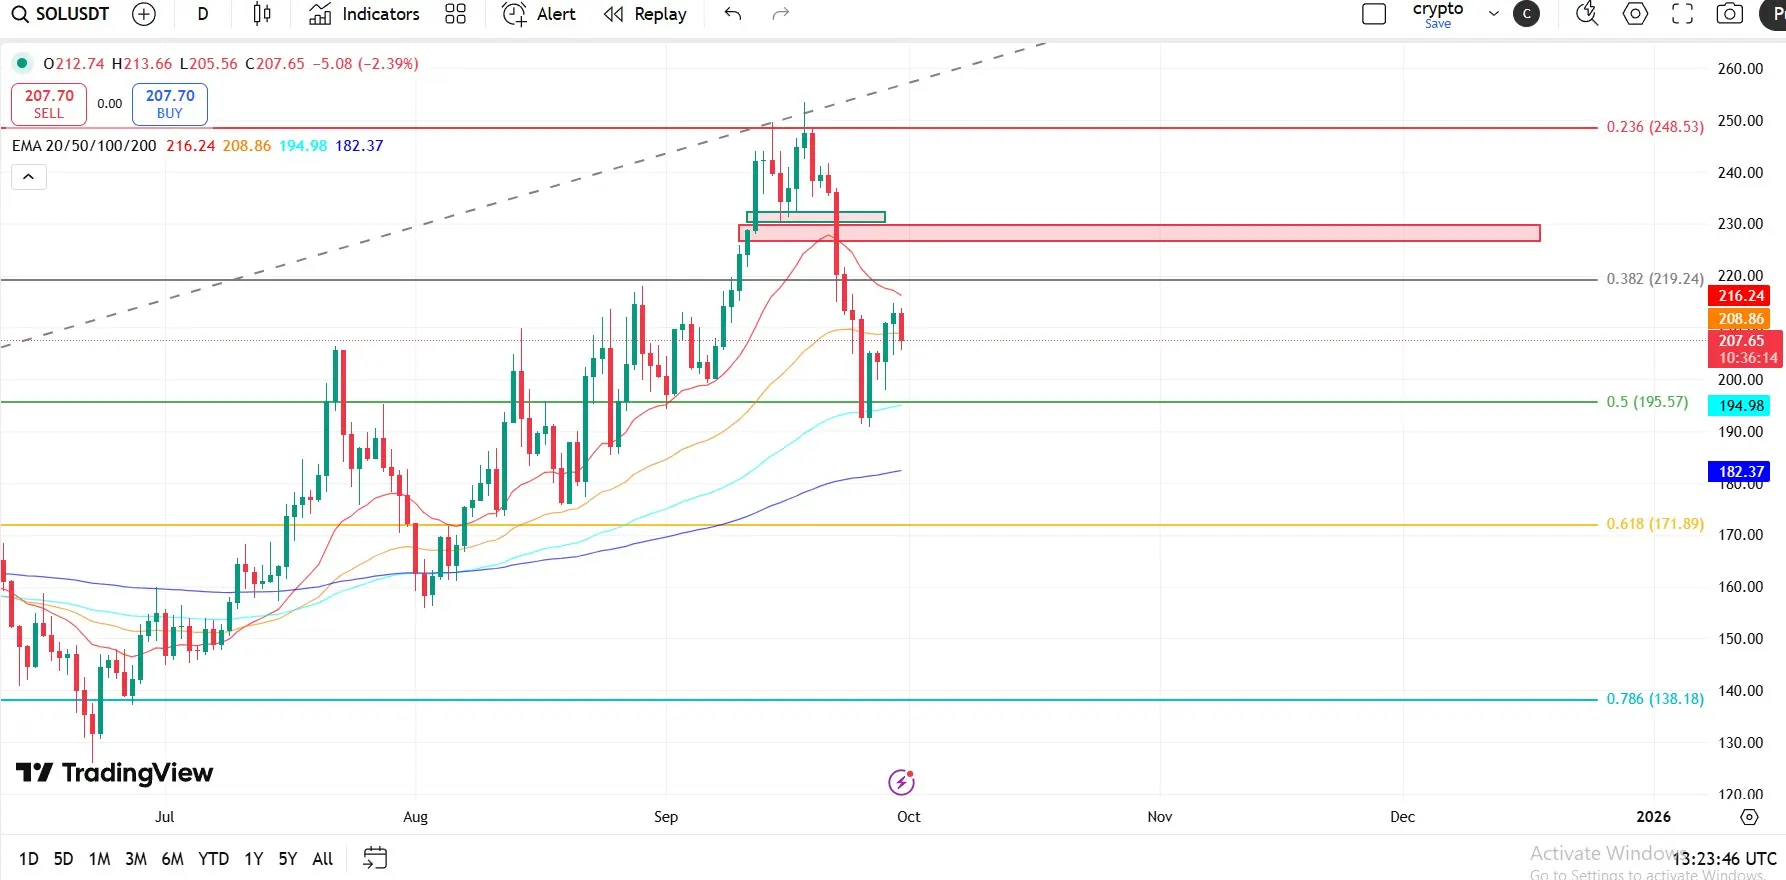
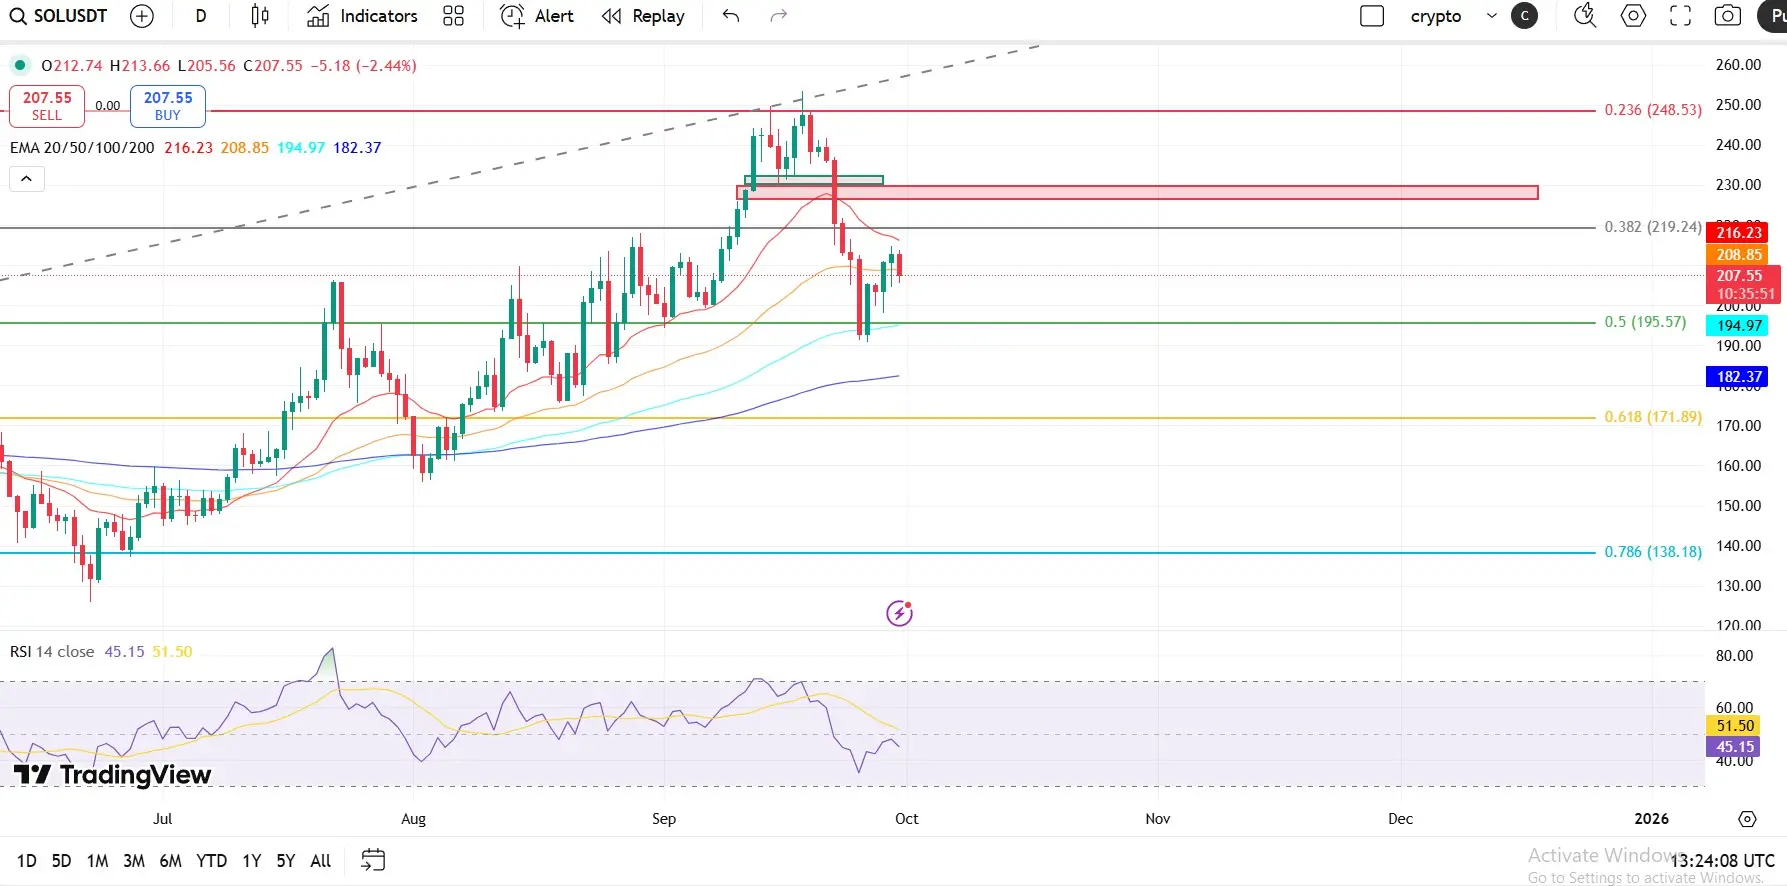
Solana battles to defend $200 amid growing bearish momentum
Solana (SOL) continues to struggle after facing rejection near $214-15 earlier in the week, slipping back under the 50-day Exponential Moving Average (EMA) at $208.86. The inability to reclaim this short-term trend indicator highlights weakness in the market and sets the stage for a possible deeper retracement.
Technical signals suggest that bearish momentum is gradually building. The Relative Strength Index (RSI) has retreated to 45, staying below the midline and reflecting waning buying pressure. Meanwhile, the Moving Average Conver
SOL3.27%
- Reward
- 16
- 7
- Repost
- Share
Korfez41:
solano yuru hadi beView More
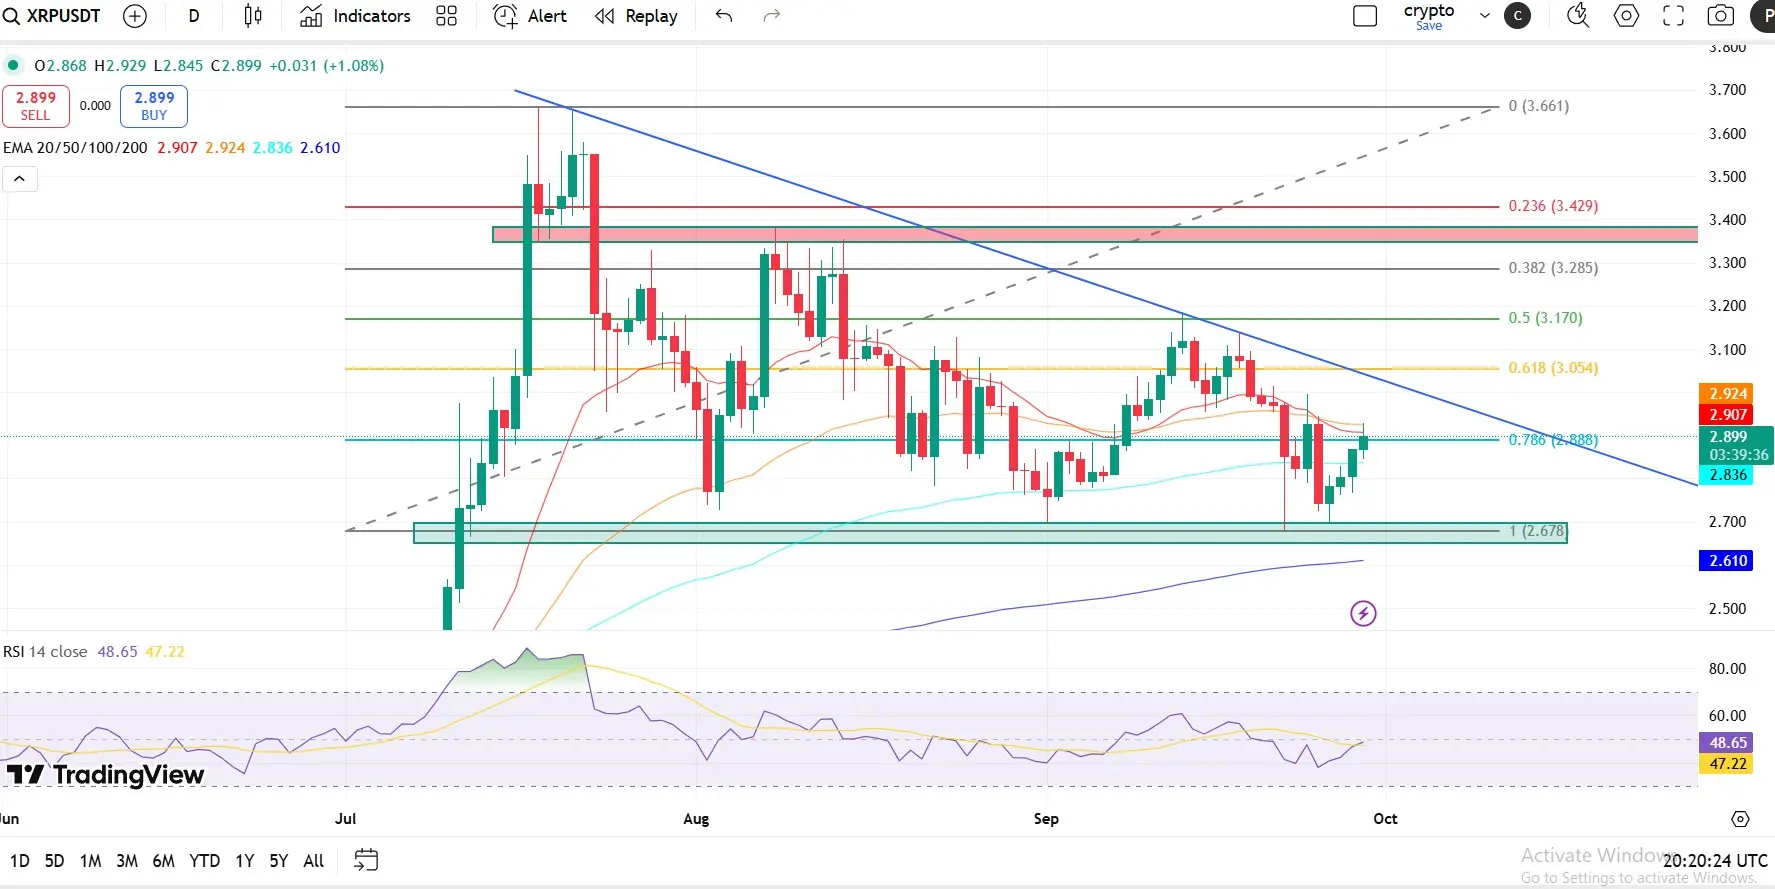
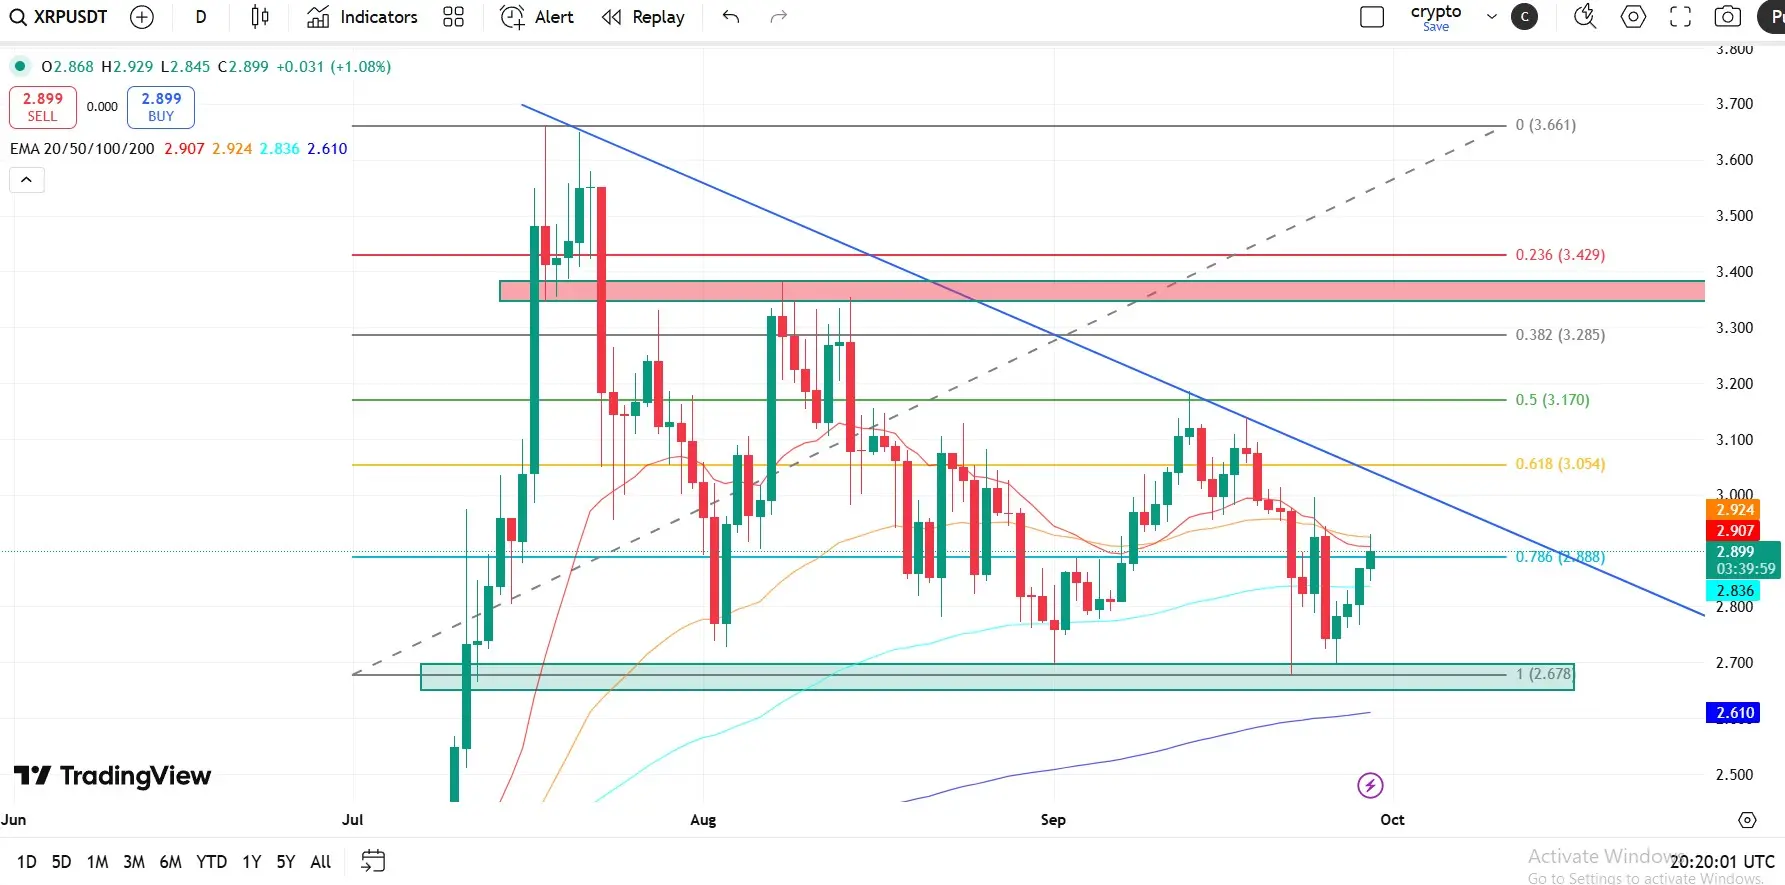
XRP Price Outlook: Bulls Prepare for $3.00 Breakout
XRP price is trading in a tightly contested zone as bulls and bears battle for dominance. The token finds reliable support at the 100-day Exponential Moving Average (EMA) near $2.836, while the 50-day EMA at $2.924 is capping recovery attempts. This tug-of-war is shaping up to be a decisive moment, with buyers eyeing the psychological $3.00 mark as the next critical barrier.
The Relative Strength Index (RSI) has gradually climbed to 48, a sign that bullish momentum is quietly building. A push above the 50 midline would shift sentiment in favo
XRP1.56%
- Reward
- 10
- 8
- Repost
- Share
Szero:
HODL Tight 💪View More
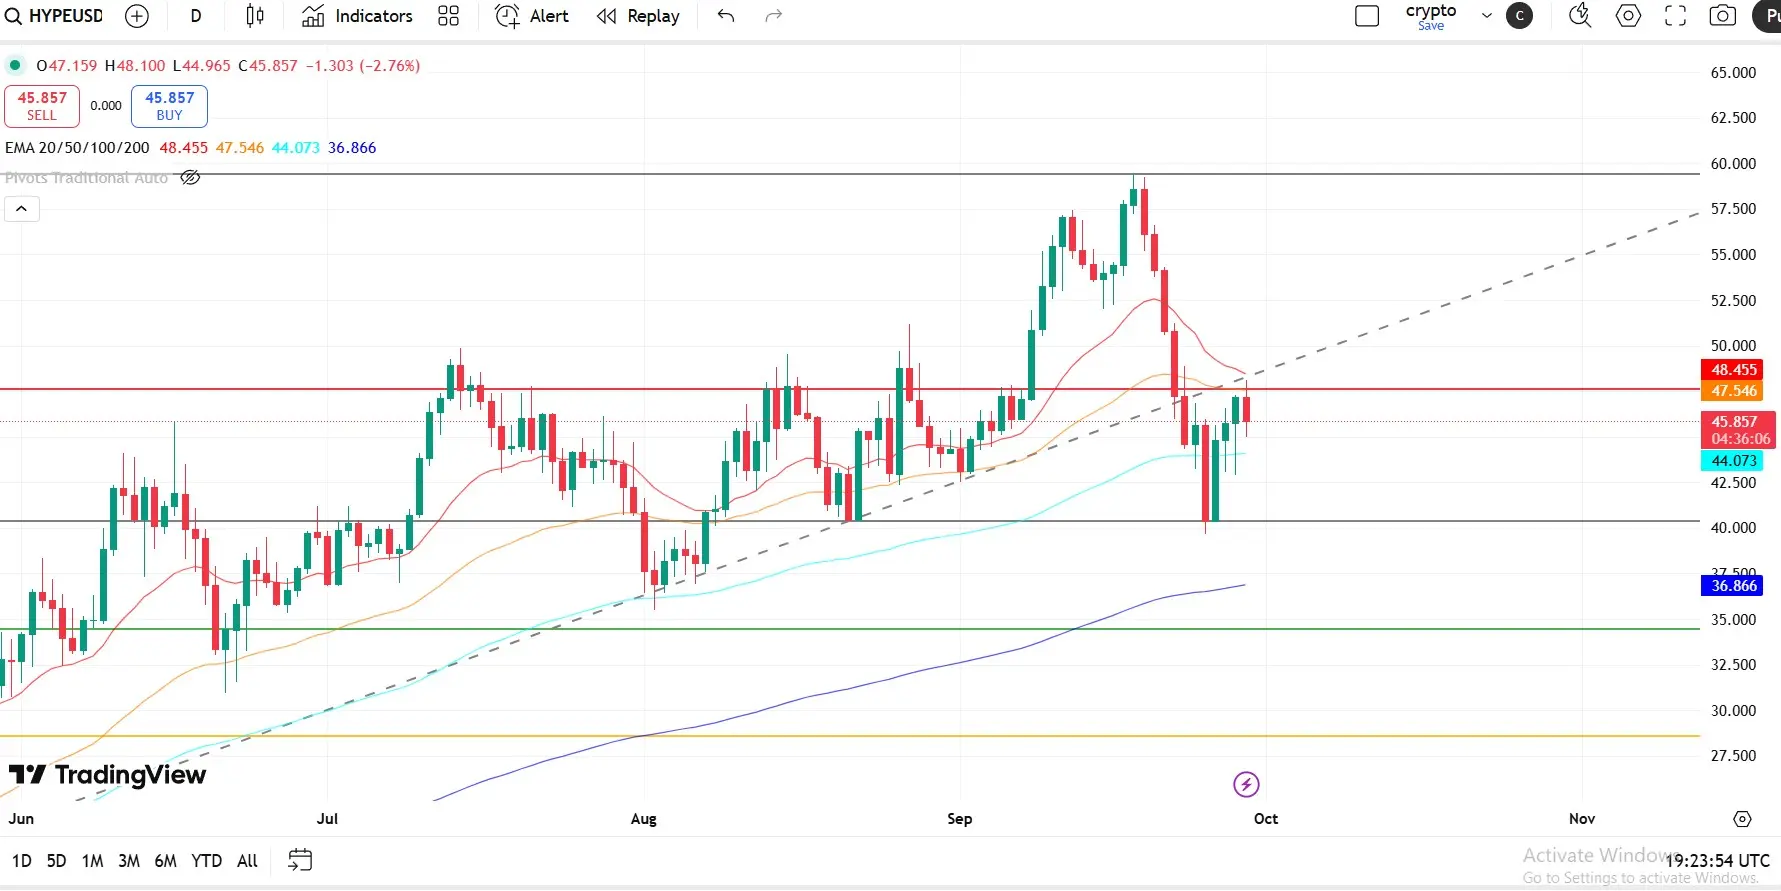
Hyperliquid Price Outlook: Can HYPE Break Above $50?
Hyperliquid (HYPE) is showing a balanced yet cautious setup as price action hovers between two critical moving averages. The token is currently holding support at the 100-day Exponential Moving Average (EMA) around $44.073, while resistance is defined by the 50-day EMA near $47.546. This narrow range highlights a period of consolidation, with traders closely watching for the next decisive move.
From a momentum perspective, the Relative Strength Index (RSI) prints at 45, reflecting a neutral-to-bearish stance. While the reading suggests that
HYPE5.29%
- Reward
- 7
- 7
- Repost
- Share
Ybaser:
Just go for it💪View More
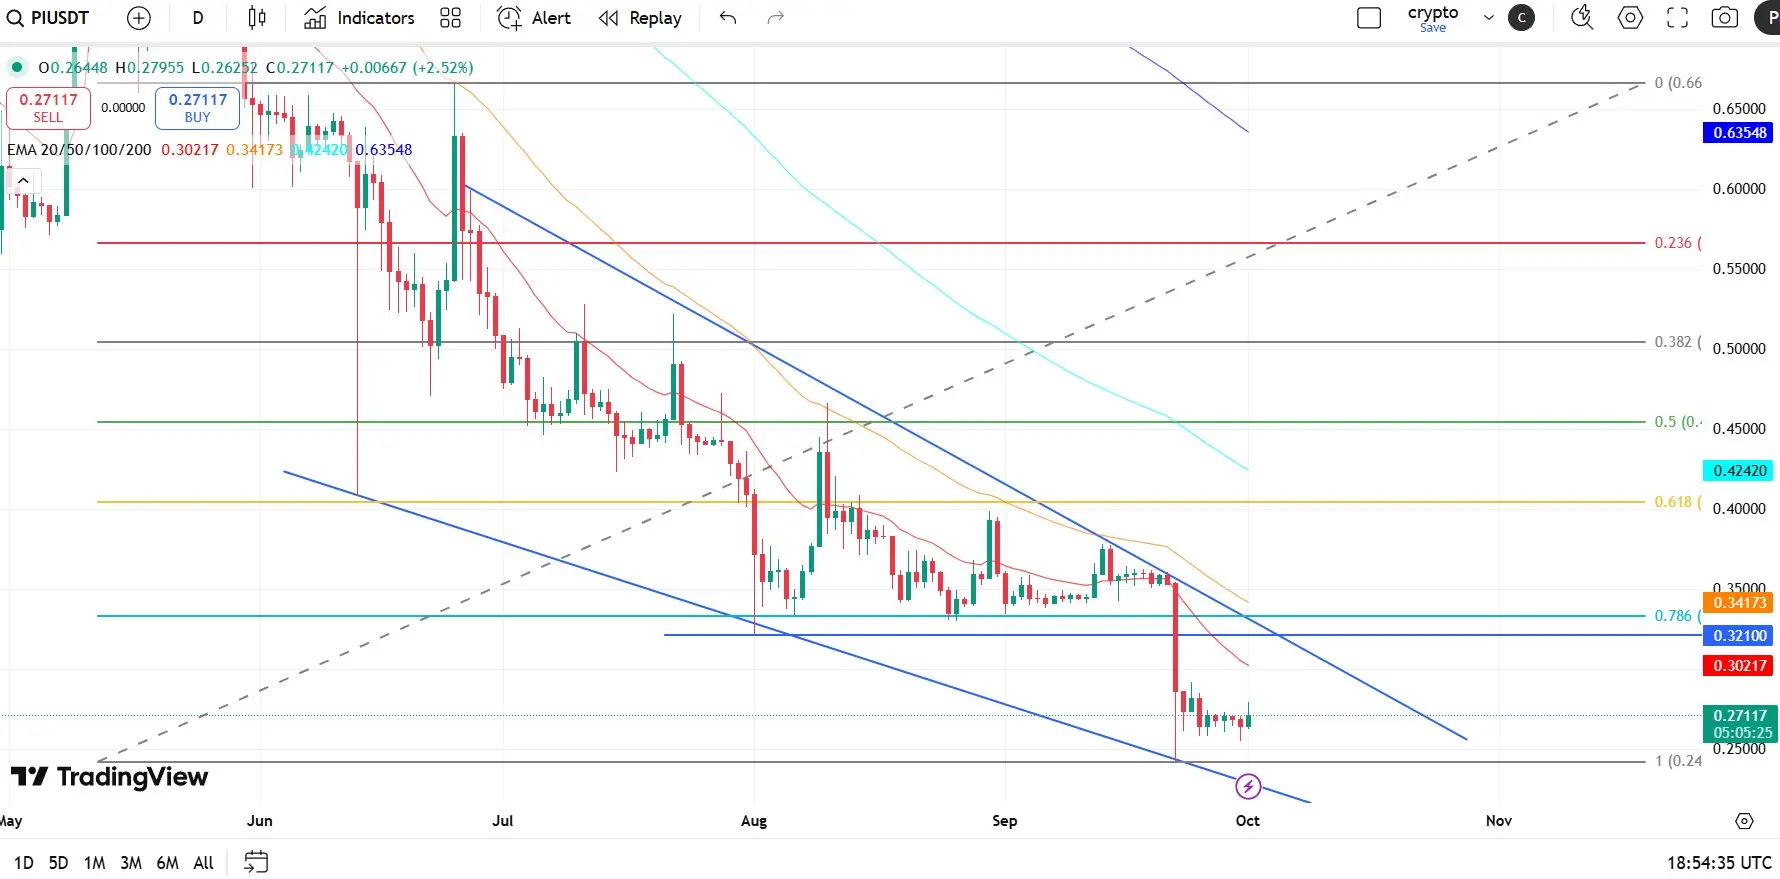
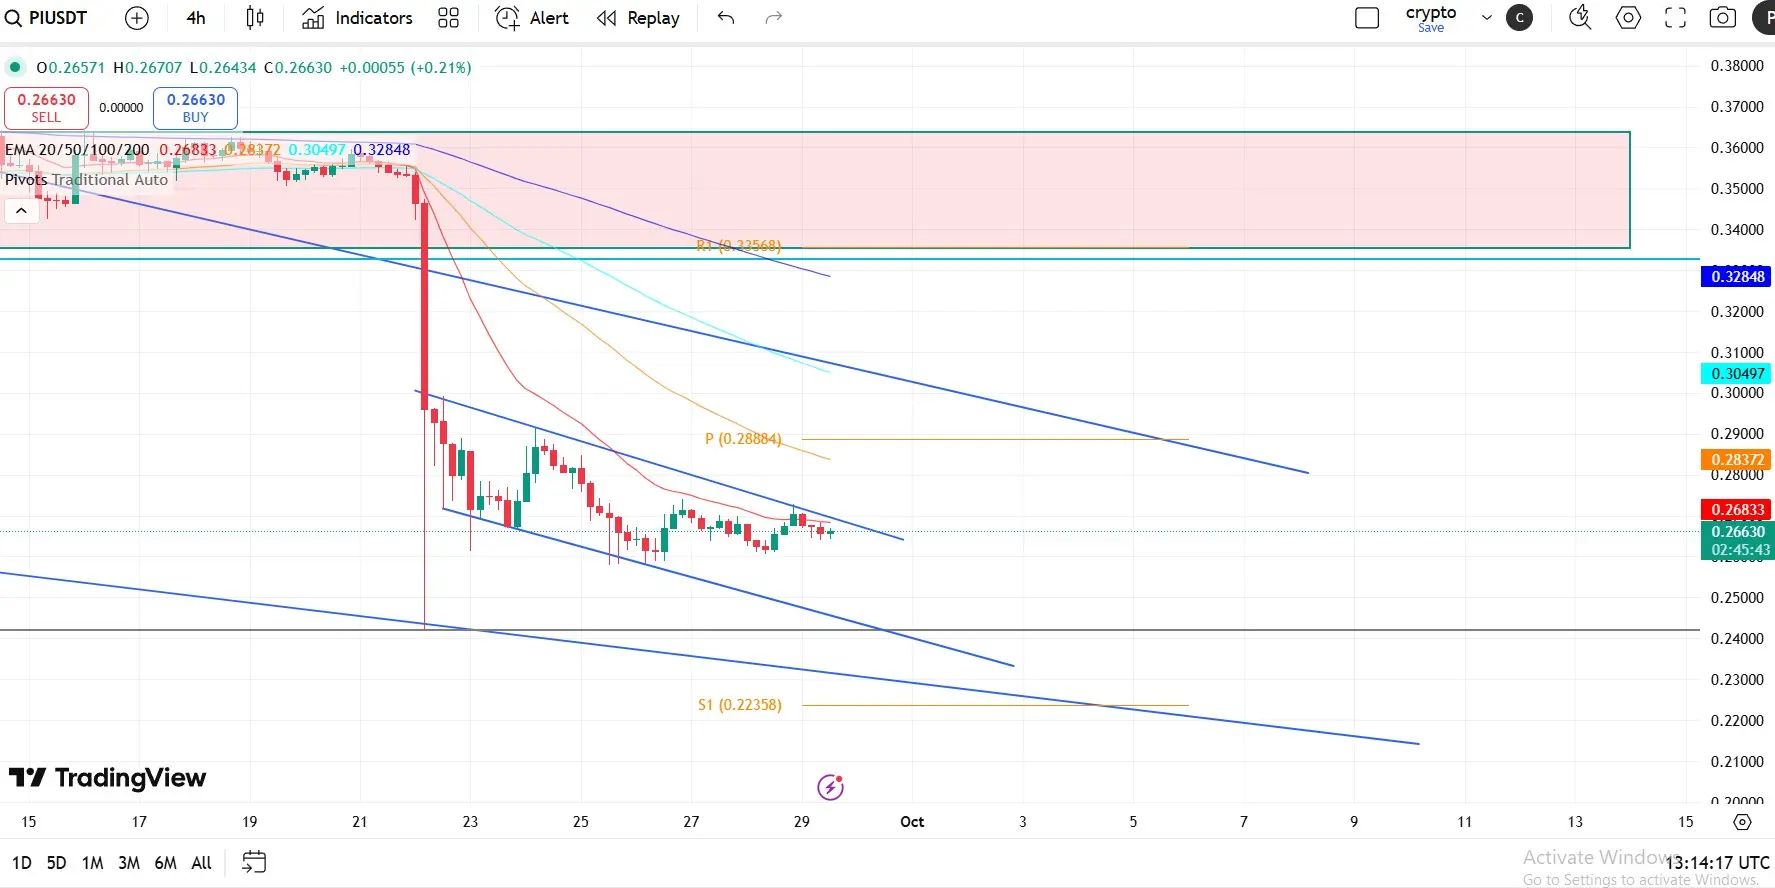
Pi Network Price Forecast: Pi Network Could Extend Decline But Bears Losing Steam
Pi Network (PI) struggled to sustain its momentum on Monday, reversing from the Pivot Point indicator at $0.28884. The rejection has reinforced a declining wedge pattern on the 4-hour chart, often seen as a bearish continuation setup. If sellers stay in control, PI could retest last Thursday’s swing low at $0.25790, with a deeper drop exposing the critical $0.2000 psychological support.
Despite this downside risk, the technical outlook is not entirely bearish. Indicators are beginning to reflect a slowdown in sel
PI0.45%

- Reward
- 5
- 9
- Repost
- Share
Szero:
HODL Tight 💪View More
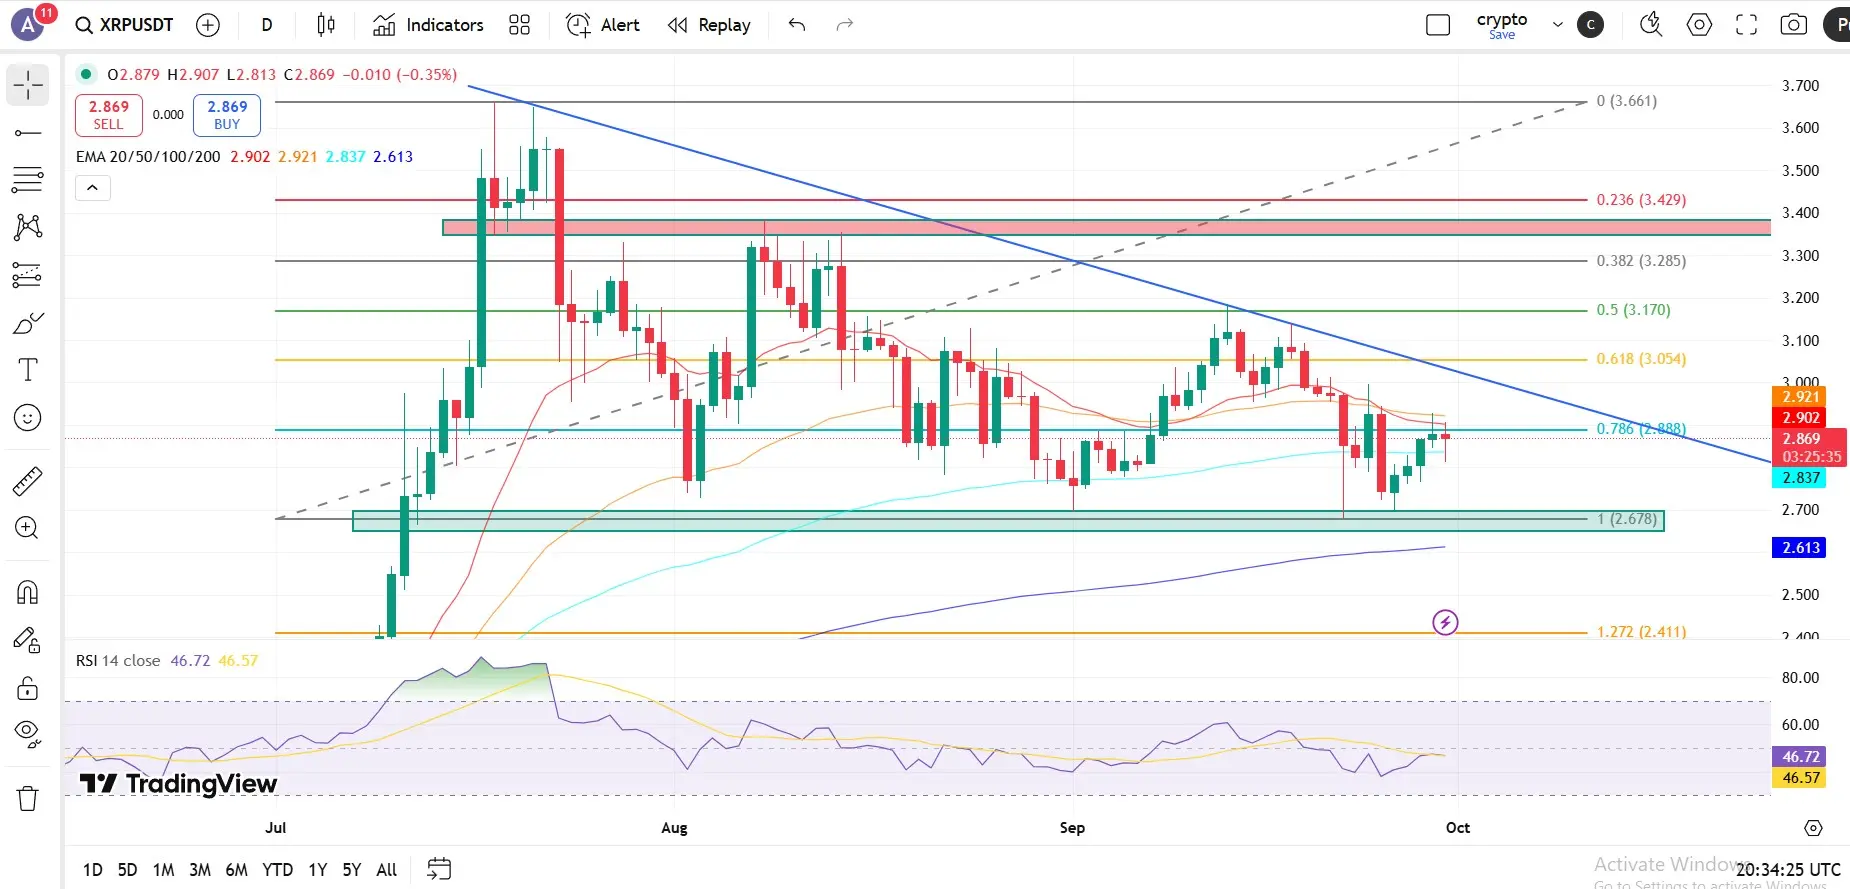
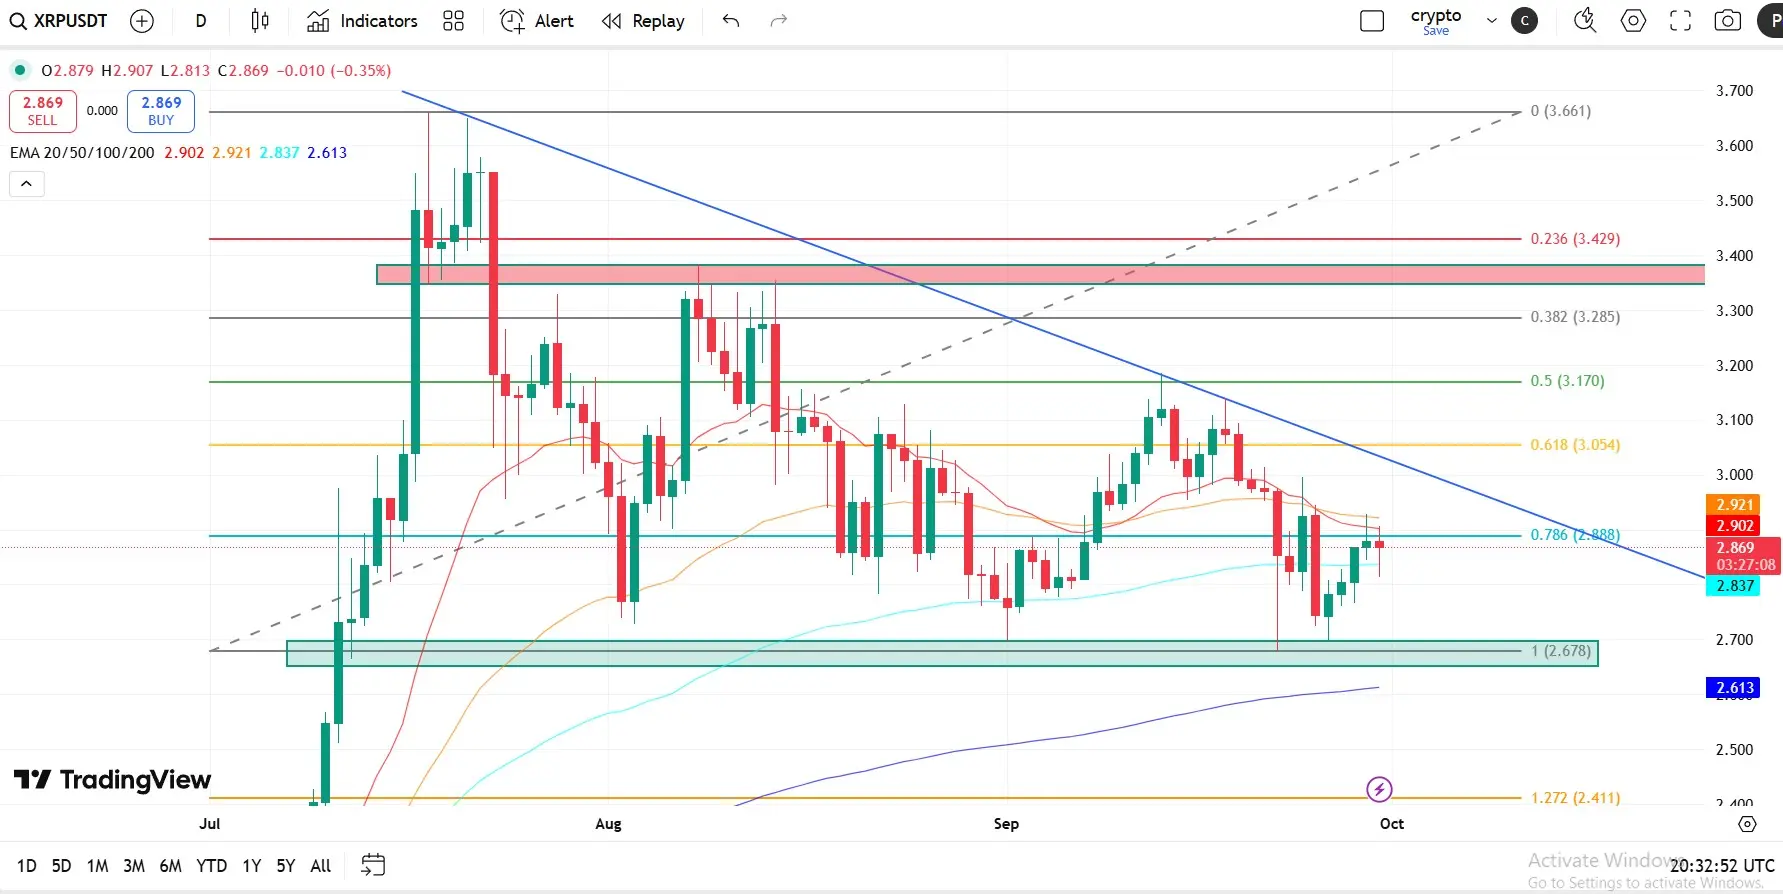
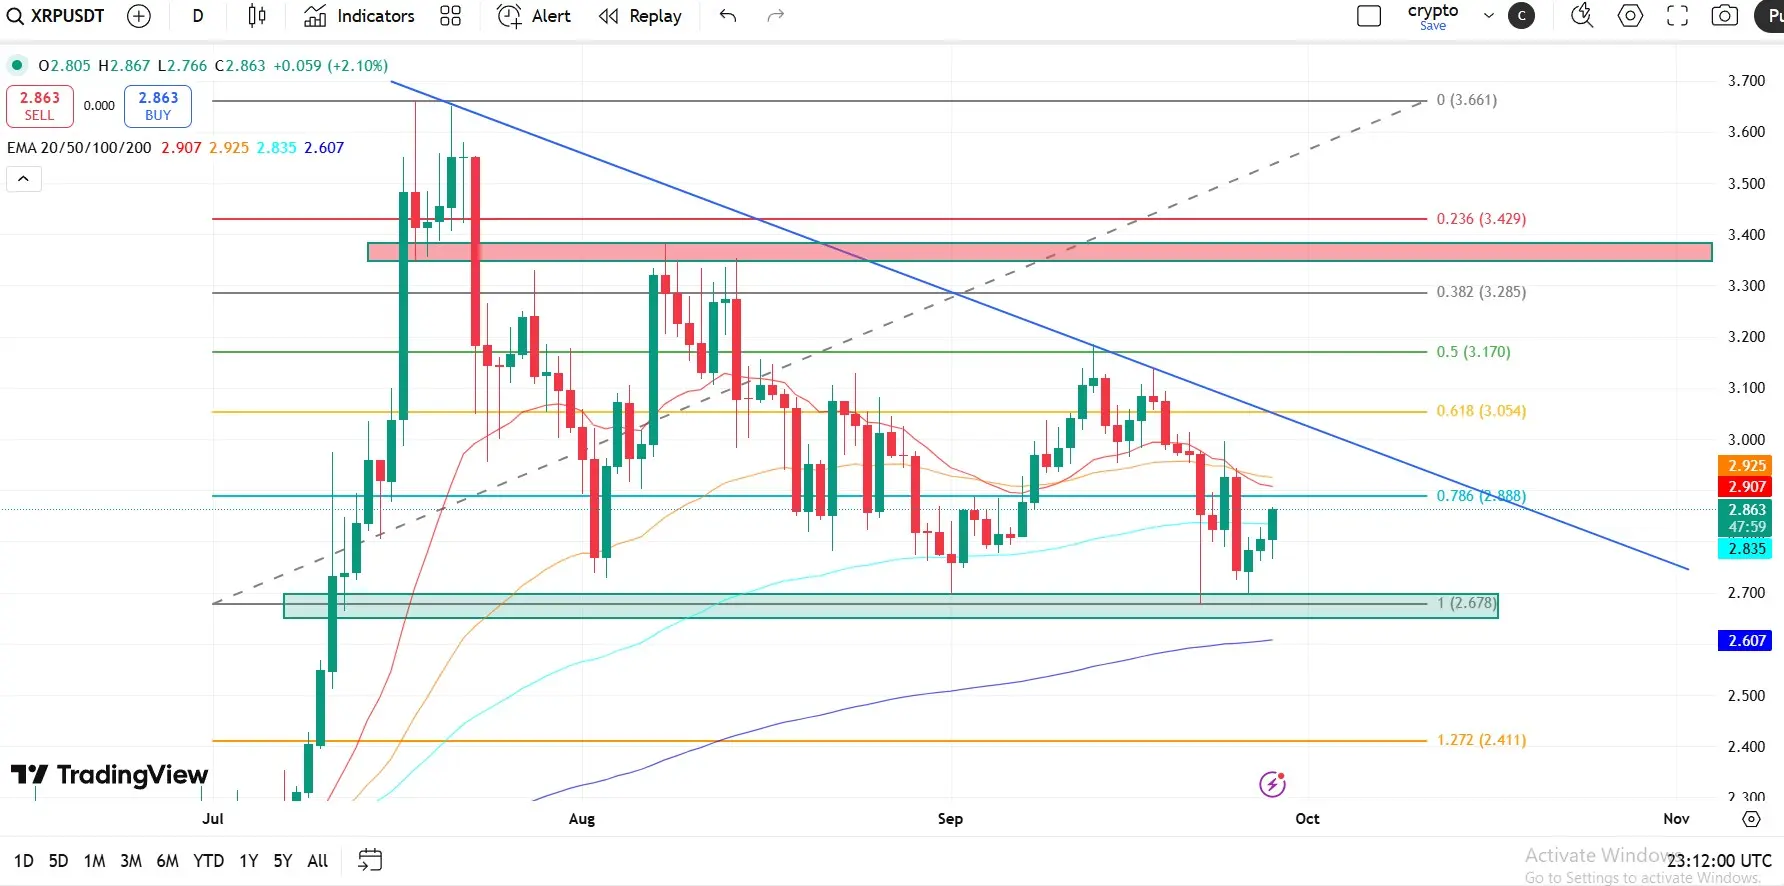
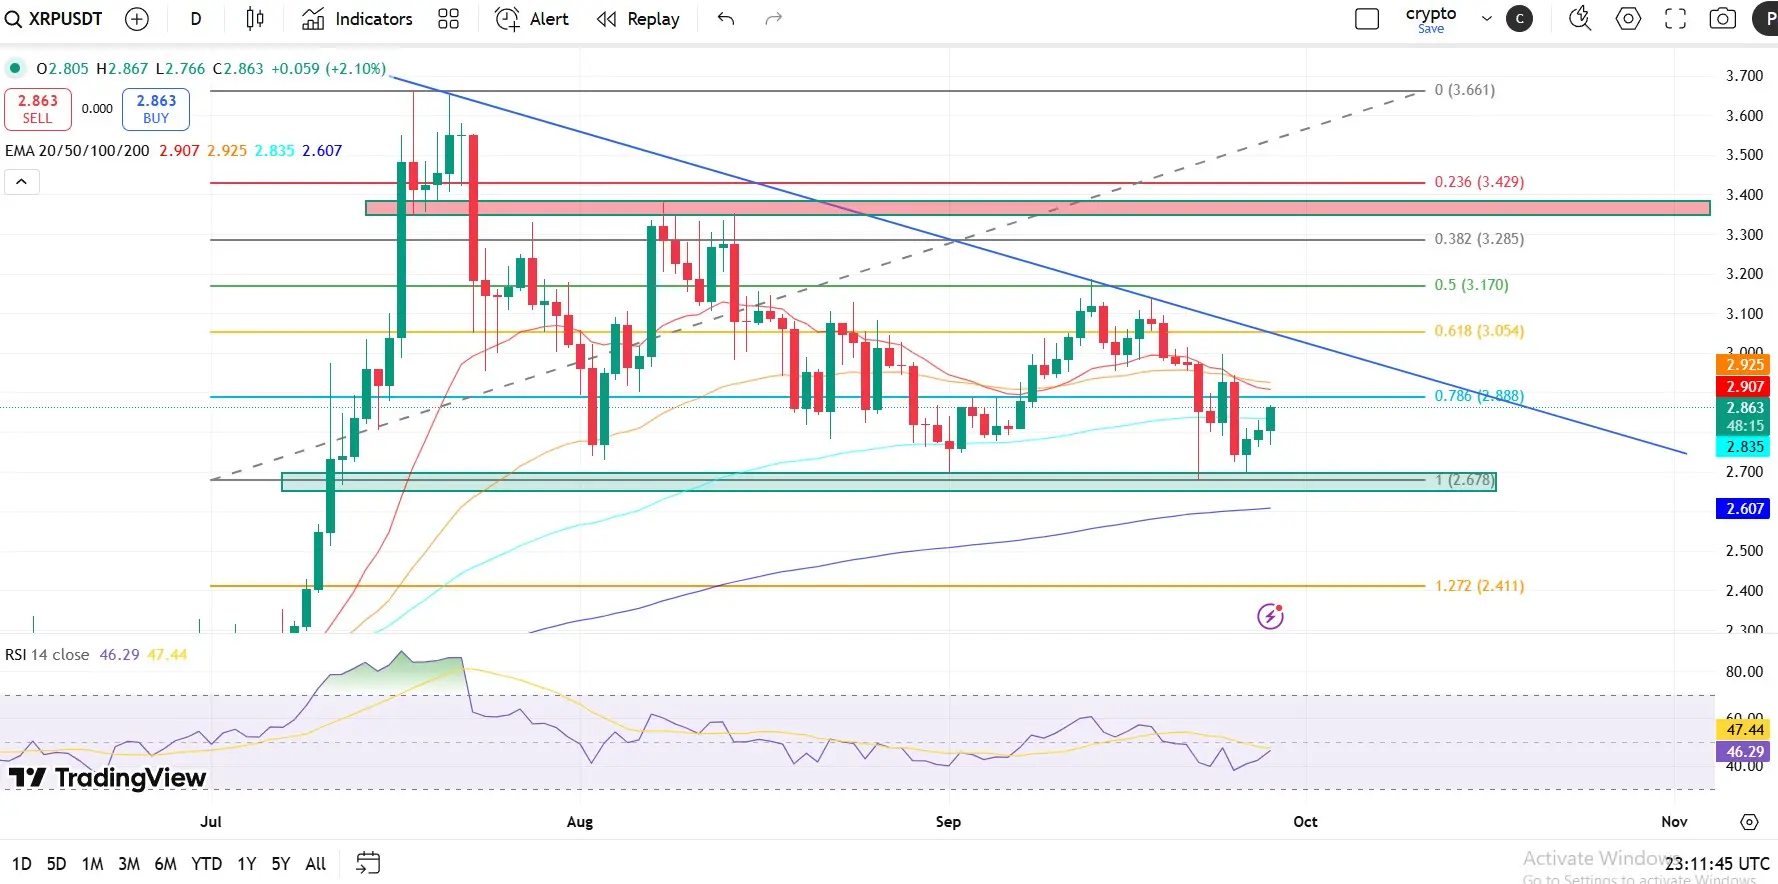
XRP Price Outlook: Bulls Defend $2.75 Support as Token Trades at $2.86
XRP is currently trading around $2.86, showing some resilience but still under pressure from key resistance levels. The token remains below the 50-day EMA ($2.925) and 100-day EMA ($2.835), with the 20-day EMA at $2.908 and the 200-day EMA at $2.607 providing additional reference points. This setup reflects the cautious sentiment in the crypto market.
📉 Bearish Momentum Signals
The Relative Strength Index (RSI) sits at 46+, indicating mild buying pressure. While not strongly bullish yet, it shows some support around curren
XRP1.56%
- Reward
- 11
- 10
- Repost
- Share
JOHAR09:
Bull Run 🐂View More
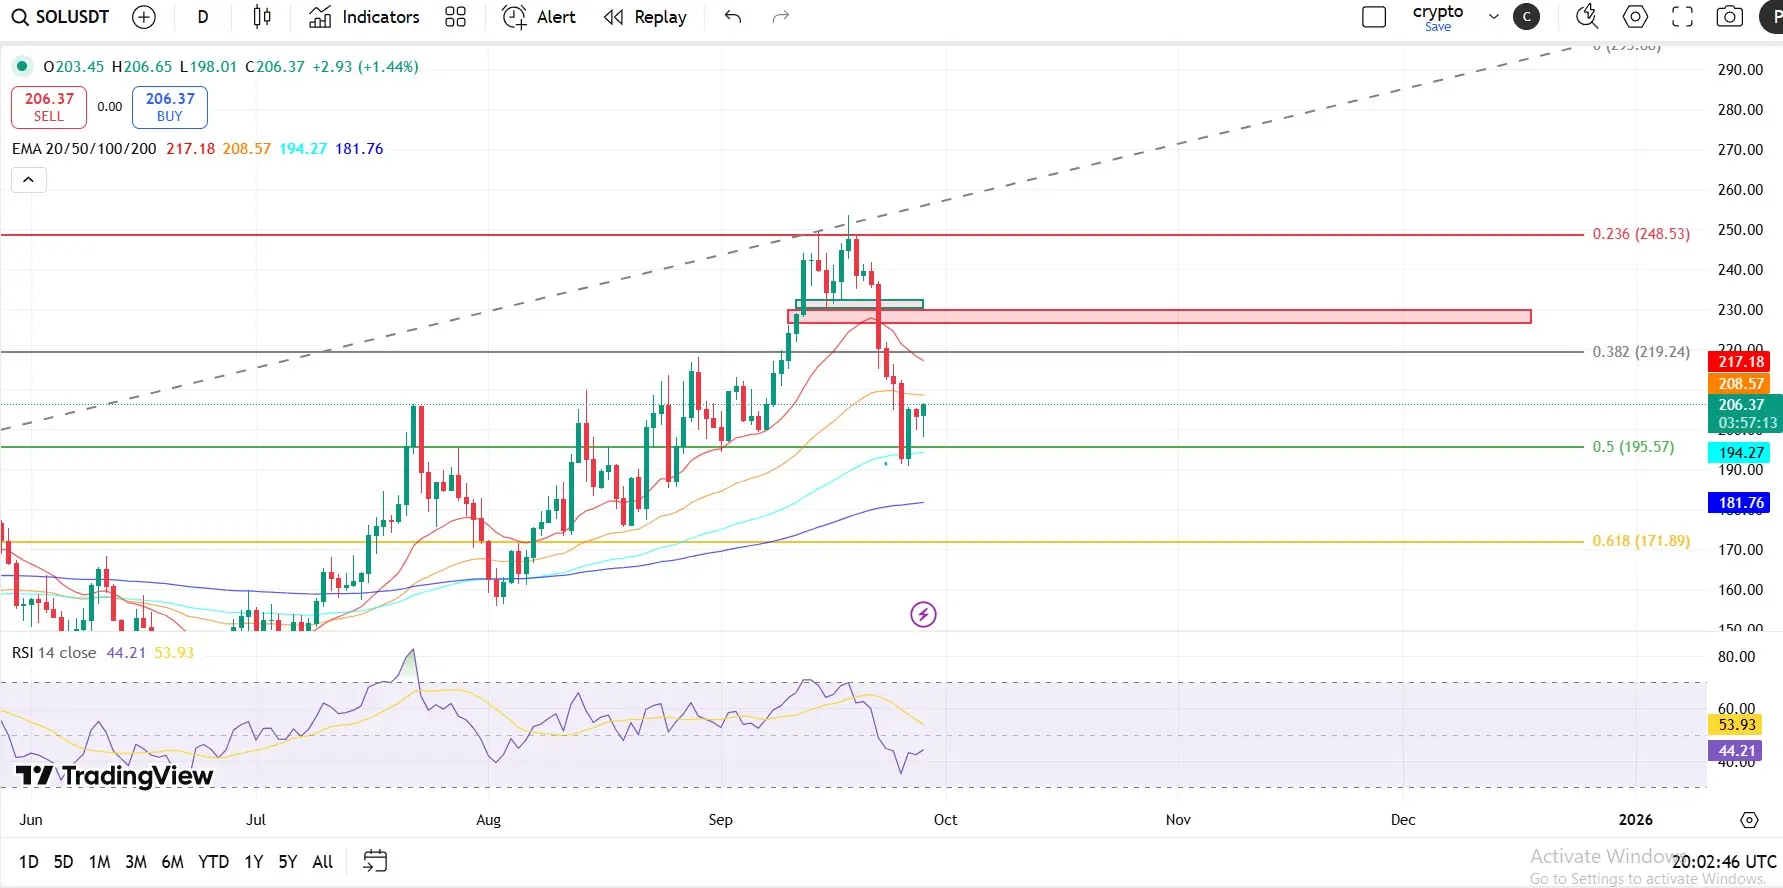
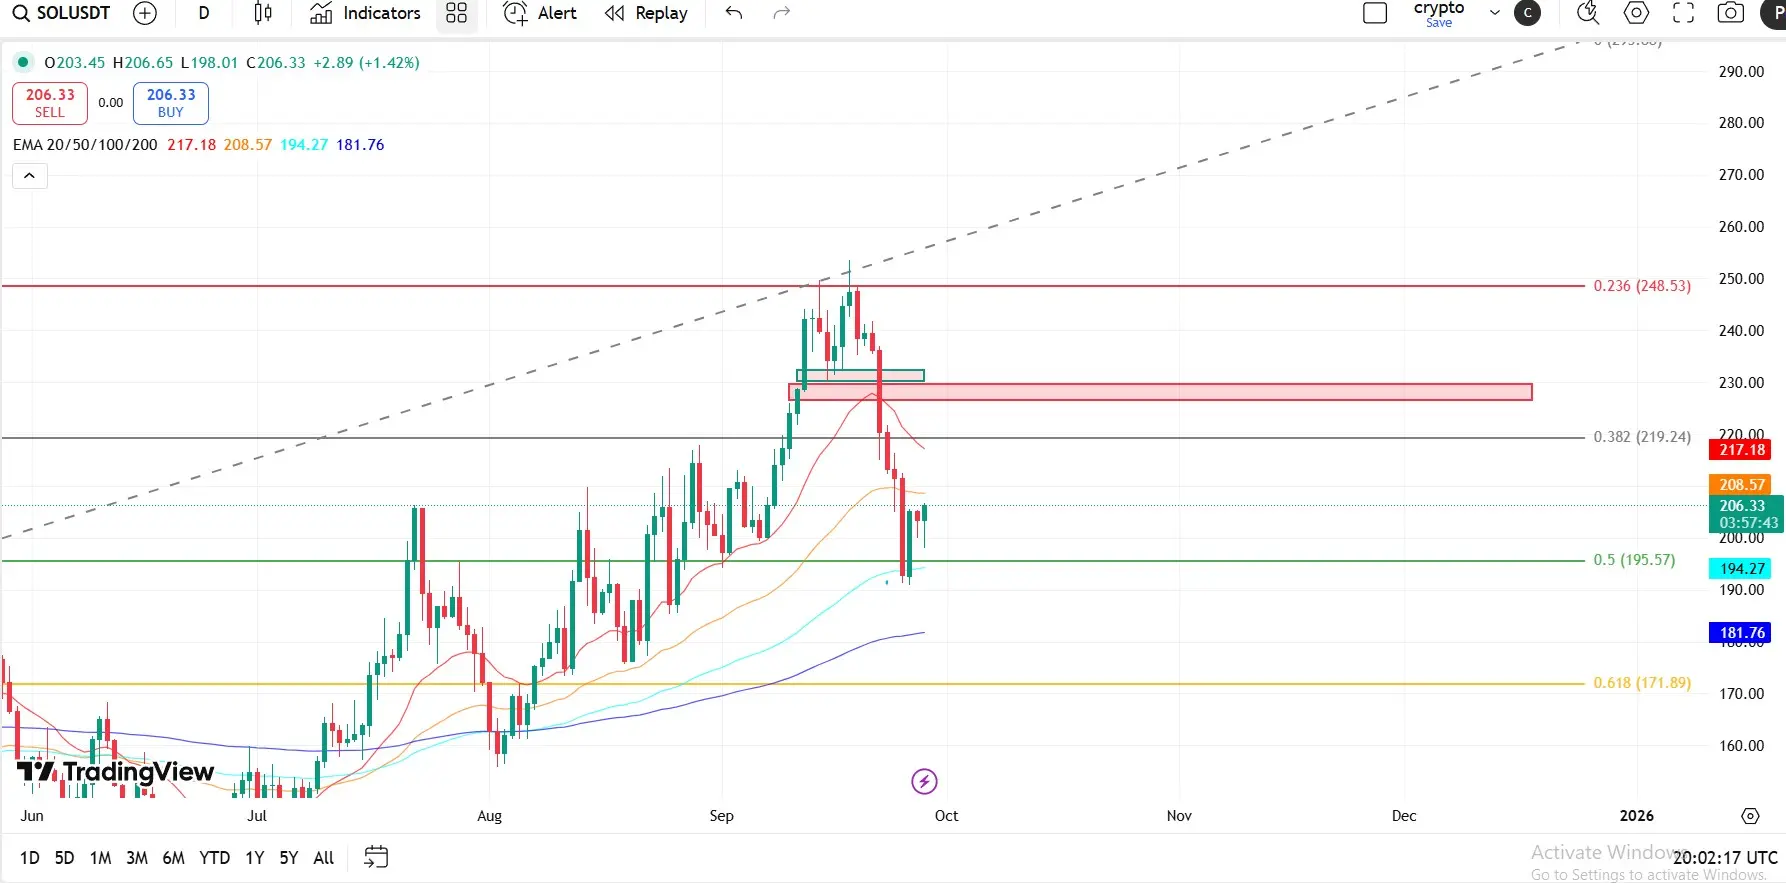
Solana (SOL) — Rising Channel Under Pressure: Watch $220 and $250 Zones
Solana (SOL) trades around $206, holding inside a rising channel but struggling to gain momentum. Key technical indicators point to a decisive move soon.
📊 Indicators
RSI (14): 44 → Neutral zone, showing neither strong overbought nor oversold conditions.
20-day EMA: $217
50-day EMA: $208.57
100-day EMA: $194
200-day EMA: $181.76
🔑 Levels to Watch
Resistance: $245–$250 (major barrier, aligned with EMA cluster overhead).
Support: $200 (critical floor); below that, $194 and $182 are next supports.
Buffer Zone: $220–$225 rem
SOL3.27%
- Reward
- 14
- 6
- Repost
- Share
GateUser-dee8ca58:
solana all the way #Altcoin 😍😍😍😍😍😍😍looking forward to $250 or more before December.✈️✈️✈️✈️✈️View More
Check out Gate and join me in the hottest event! https://www.gate.com/campaigns/2116-mid-autumn-festival?ref=BARCV1FY&ref_type=132

- Reward
- 9
- 5
- Repost
- Share
Ryakpanda:
Just go for it💪View More