Futures
Access hundreds of perpetual contracts
TradFi
Gold
One platform for global traditional assets
Options
Hot
Trade European-style vanilla options
Unified Account
Maximize your capital efficiency
Demo Trading
Introduction to Futures Trading
Learn the basics of futures trading
Futures Events
Join events to earn rewards
Demo Trading
Use virtual funds to practice risk-free trading
Launch
CandyDrop
Collect candies to earn airdrops
Launchpool
Quick staking, earn potential new tokens
HODLer Airdrop
Hold GT and get massive airdrops for free
Pre-IPOs
Unlock full access to global stock IPOs
Alpha Points
Trade on-chain assets and earn airdrops
Futures Points
Earn futures points and claim airdrop rewards
HIGH coin surges to 0.25! The mystery behind this violent rally: is it the start of the main upward wave, or a short-term trap to lure more buyers?
Current Price: 0.2079
Peak of this phase: 0.2458
From this chart, HIGH coin experienced nearly 200% surge within just a few hours, clearly a typical emotional breakout. But is there truly sustainable upward potential behind this, or is it just a short-term “flash in the pan” rally?
Below, I will analyze the deeper logic of the current market from three different timeframes.
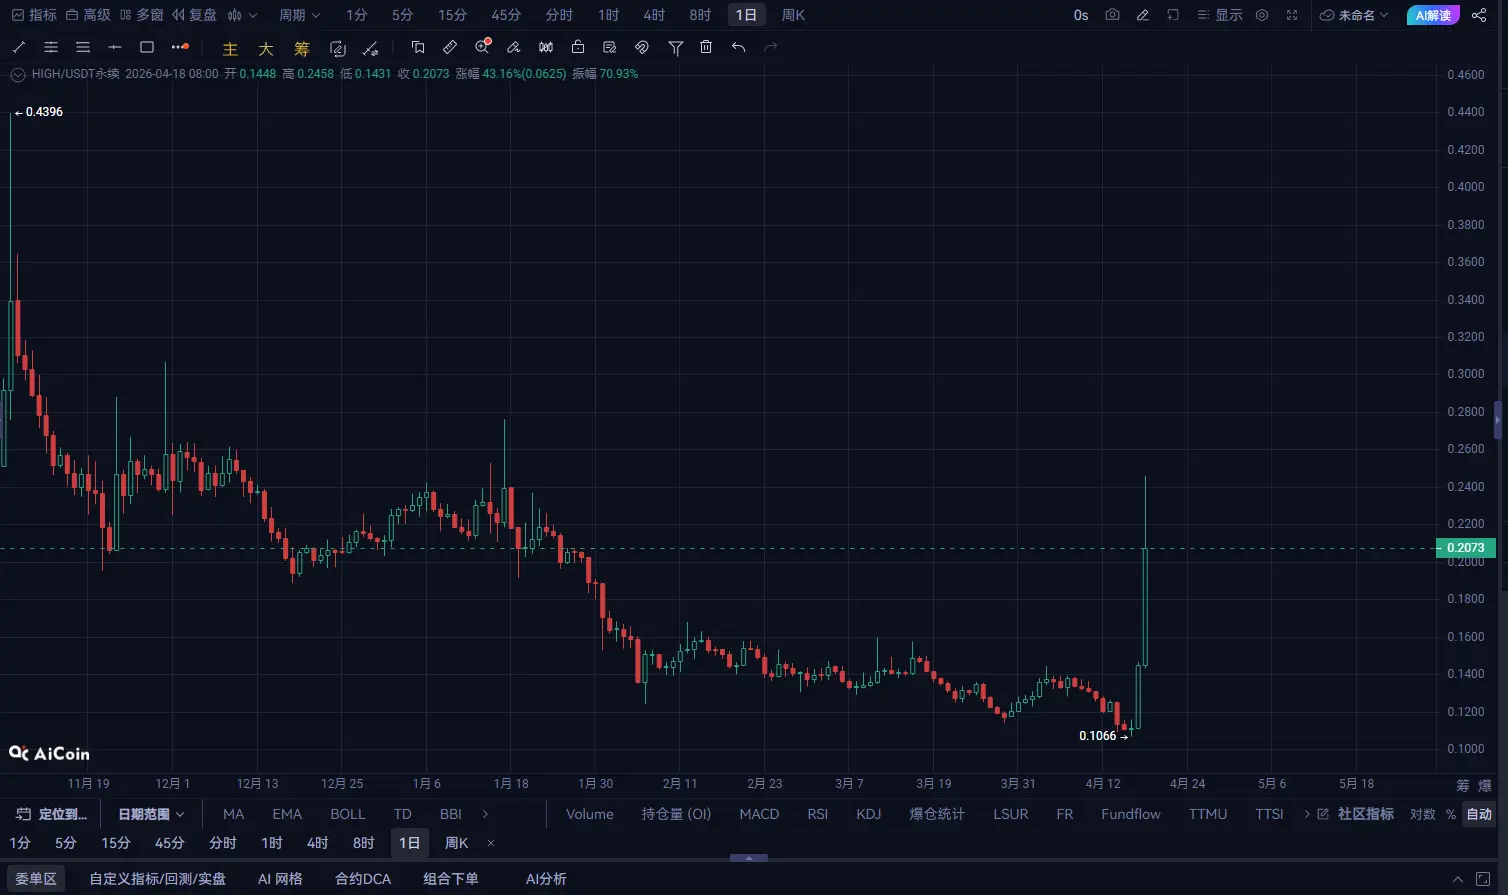
The daily chart is very straightforward:
Low point at 0.1066 forms a bottom support
Subsequently, the price oscillates higher, recently breaking through the 0.20 mark
The sudden violent rally is almost driven by a single long bullish candle
This indicates:
👉 Short-term breakout has gained obvious upward momentum
👉 But this is not a long-term upward trend; more a market sentiment reaction
Key levels:
Support: 0.15 / 0.12
Resistance: 0.25 / 0.30
Daily conclusion:
Trend: Short-term bullish, not a trend reversal yet
State: High-level consolidation after violent surge
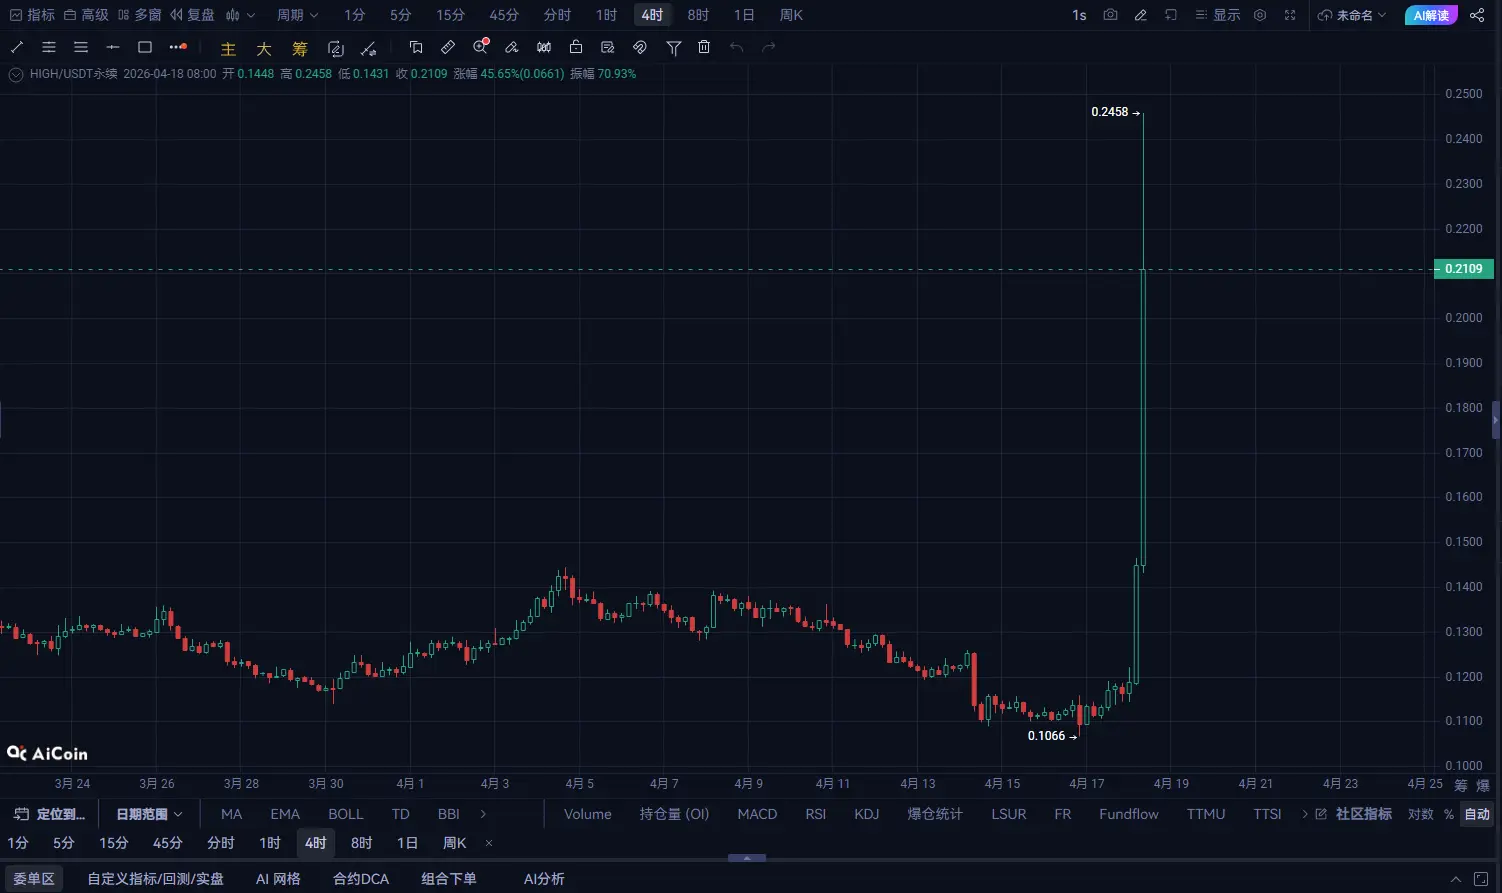
The four-hour chart shows the current consolidation structure after the surge:
Price rapidly rose from 0.10 to 0.25
Currently oscillating between 0.20 and 0.24
After the rally, a pullback occurred, but overall no clear bearish structure formed
This indicates:
👉 The bulls still hold the advantage
👉 But the price has entered a short-term high-level consolidation zone, making a breakout more difficult
Key levels:
Support: 0.18 / 0.16
Resistance: 0.24 / 0.25
Four-hour conclusion:
Trend: Short-term still leaning bullish, but in consolidation phase
State: Range-bound consolidation, breakout at key levels will determine further direction
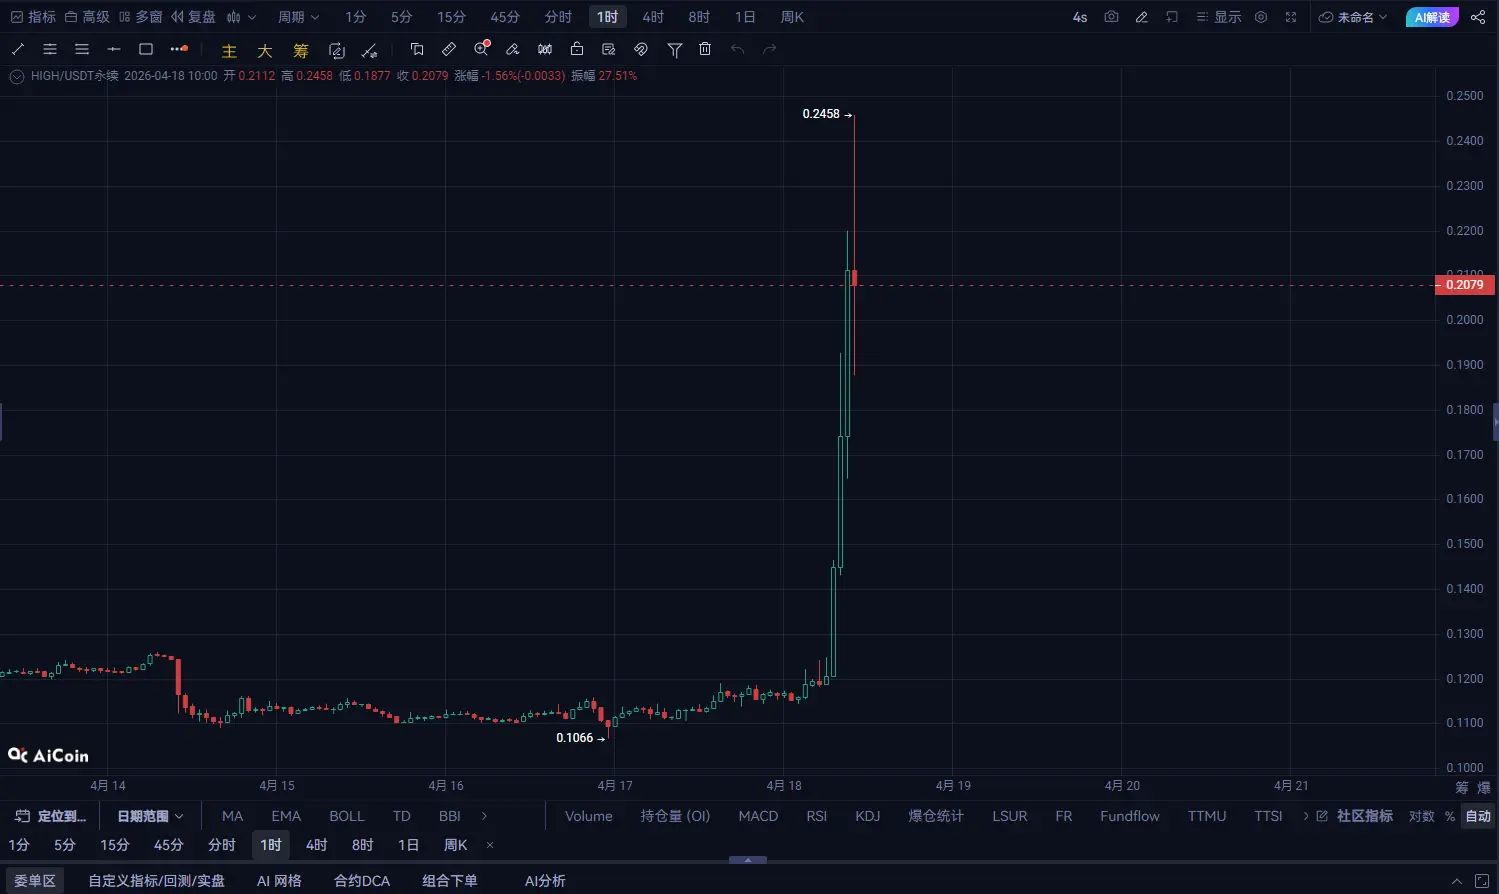
The one-hour chart reflects intense short-term price fluctuations:
Last night, the price surged to 0.25, then briefly pulled back
Currently oscillating around 0.20, with rapid fund inflows and outflows
Frequent ups and downs indicate extremely unstable market sentiment
This indicates:
👉 Funds lack a clear direction in the short term
👉 After the rally, the price pulled back near support levels, still carrying short-term consolidation risk
Key levels:
Support: 0.20 / 0.18
Resistance: 0.24 / 0.25
One-hour conclusion:
Trend: Consolidation phase
State: Short-term bulls and bears are in stalemate, awaiting a clear direction
HIGH coin’s current market is highly “emotionally explosive,” with a short-term surge in price, breaking through 0.20 and entering a high-level consolidation phase.
Daily: Violent rally followed by consolidation, trend remains bullish but momentum wanes
Four-hour: Short-term consolidation, still within a range, breakout is key
One-hour: Sharp price fluctuations, market sentiment is quite unstable
Therefore, this rally is a short-term, fund-driven surge, currently entering a consolidation period. If it cannot break through 0.25 in the short term, a pullback may occur.
Trading Suggestions (Key Points)
1️⃣ For holders (recommended actions)
Gradual profit-taking: The current price is near the high; consider gradually reducing positions in the 0.20-0.25 range.
Trend unchanged, risk increases: If the price falls below 0.18, consider reducing or stopping losses.
2️⃣ For new long positions (cautious)
Wait for the price to stabilize around 0.18-0.20 before considering low buy-ins, only for conservative traders.
If it breaks 0.25, try chasing the high, target 0.30.
3️⃣ Short position strategies (advanced traders)
Near 0.25, if signs of stagnation appear and there are consecutive lower shadows, consider shorting.
Stop-loss: above 0.27, target: 0.20-0.18.
Risk Warning (must pay attention)
Currently, market sentiment is very high. After such a violent rally, a sharp correction often follows. If it fails to break through 0.25 effectively, the risk of a short-term pullback increases.