Futures
Access hundreds of perpetual contracts
TradFi
Gold
One platform for global traditional assets
Options
Hot
Trade European-style vanilla options
Unified Account
Maximize your capital efficiency
Demo Trading
Introduction to Futures Trading
Learn the basics of futures trading
Futures Events
Join events to earn rewards
Demo Trading
Use virtual funds to practice risk-free trading
Launch
CandyDrop
Collect candies to earn airdrops
Launchpool
Quick staking, earn potential new tokens
HODLer Airdrop
Hold GT and get massive airdrops for free
Launchpad
Be early to the next big token project
Alpha Points
Trade on-chain assets and earn airdrops
Futures Points
Earn futures points and claim airdrop rewards
More
Zhang Yaoxi: Trump signals a ceasefire again, gold prices remain bullish and rebound mainly
Zhang Yaoxue: Trump sends out a ceasefire signal again; gold price remains mainly focused on a bullish rebound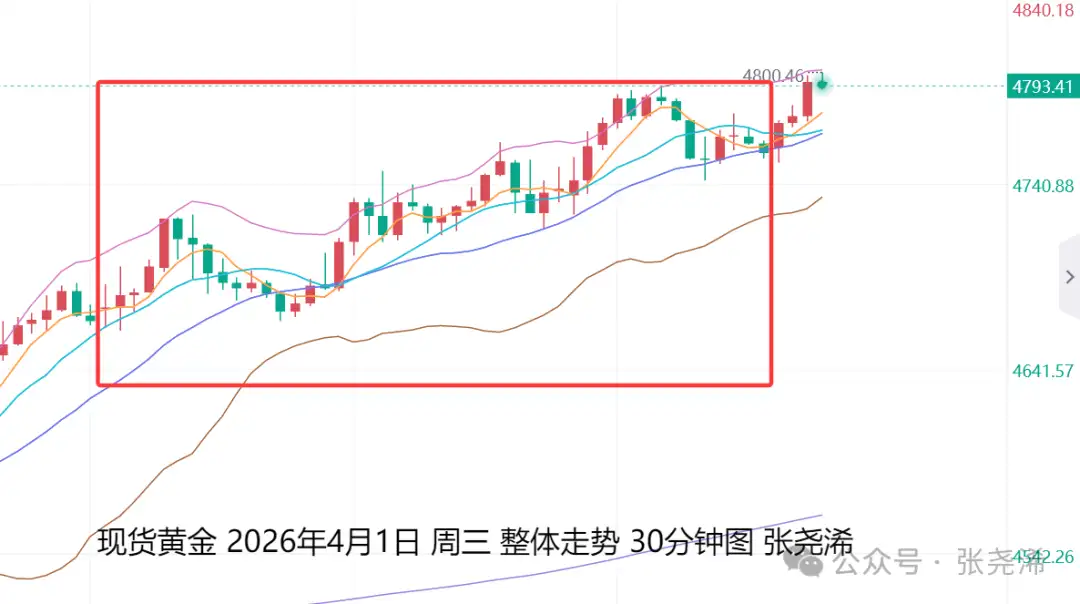
On the previous trading day, Wednesday (April 1): International gold continued to be supported by easing Middle East tensions. The White House also previewed that Trump would deliver a national address, sparking initial hopes that the Middle East conflict could be nearing its end, plus buying pressure, which kept the rebound going and the price closed higher, staying above the 100-day moving average support. Bullish momentum increased, and in the short term gold is still expected to strengthen further to reach the next target at the 60-day moving average resistance of $4,900 or higher.
In terms of the specific move, gold opened in the Asian session at $4,671.29 per ounce, first recording an intraday low of $4,661.67, then maintained a rangebound rebound, extending into the U.S. session to touch an intraday high of $4,792.57. It met some resistance and pulled back, but ultimately still held a mostly upward rebound, closing at $4,757.87. The day’s range was $130.9, it rose by $86.58, and the increase was 1.85%.
Outlook for today, Thursday (April 2): International gold’s open continues to show strength; the U.S. dollar index weakened in the early session. Near-term crude oil outlook looking bearish provides supportive fuel for gold prices;
Although the U.S. 3月 ADP employment change (10,000) and the U.S. 2月 retail sales month-over-month rate released yesterday were better than expected, after a brief dip, bulls still hold the upper hand. Clearly, the change in the data is difficult to outweigh the impact of geopolitical conditions and monetary policy.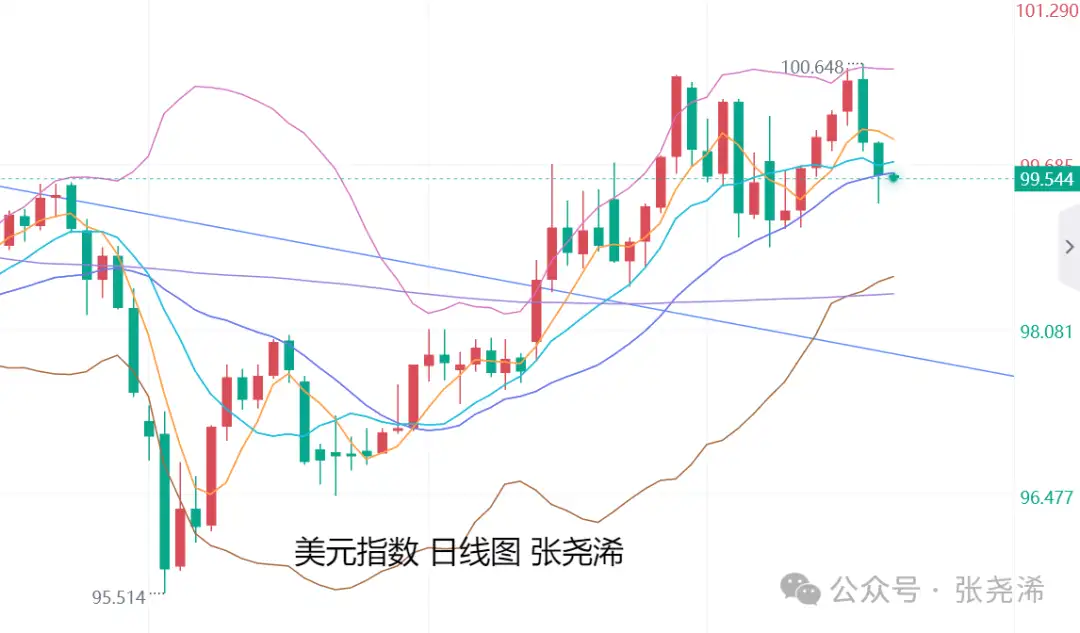
In addition, today’s focus will be on initial jobless claims data. Market expectations are favorable for gold prices. And on Friday there will also be the Non-Farm Payrolls data; market expectations are better than the prior figure, but the expected value is still low. Also, the forecast for the U.S. average hourly earnings month-over-month for March is lower. Therefore, in terms of data, the overall impact on gold prices will mainly be rangebound volatility, and there is still a tendency for further strength. So, for now, for the week’s trading strategy, we will keep the stance of staying in low buying and bullish outlook unchanged.
On the fundamentals, concerns about the Middle East’s outlook are currently easing. Trump keeps issuing ceasefire signals—from the start of the week saying he is willing to end the war even if the Strait of Hormuz remains closed, to the White House preview that Trump will deliver a national address, announcing that the war is about to end, and so on.
Therefore, as the Middle East conflict may end quickly, the outlook for crude oil strength weakens. The outlook for rising inflation also weakens, and expectations for the Fed to hike rates also weaken. In addition, this week, Fed Chair Jerome Powell said he will wait and observe the impact of the war on the economy and inflation, and will not consider rate hikes for now. Fed governor Milan also said the Fed can gradually cut rates by one percentage point within a year, etc. The market will once again revisit the rate-cut expectations. Then, even if geopolitical conditions end, the market will return to the Fed rate-cut cycle again, along with structural bullish factors such as central bank gold buying and de-dollarization. Therefore, I still lean to the view that this wave of gold’s decline is only a mid-course correction within a larger upward cycle. Over the next year, it is still expected to rise again and refresh highs.
Technically, at the monthly level: Gold’s March closing price is above an uptrend line, maintaining a bullish/bull market outlook. This month’s opening also continued the strength led by March’s rebound. As long as the price does not close below this trend line, there will still be expectations for new highs.
At the weekly level: Gold this week, as expected, continued last week’s pattern of bottoming out, rebounding, and stopping the decline into a bullish formation, along with rebound momentum, and it has moved further higher. It has also initially broken through the resistance of the midline, and bullish momentum is strengthening. Although it initially touched the 5–10 week moving average resistance and there is a risk of pullback, as long as this week’s close remains above the midline— or it breaks above the 5–10 week moving average resistance— then the outlook for the next phase is to refresh historical highs again.
On the daily chart: Gold is currently trading above the 5–10 day short-term moving averages and also above the 100-day moving average. Bullish momentum has an advantage. The attached indicators are still maintaining bullish signals; the ZZ indicator has not yet shown a rebound top. This suggests the short-term trend will remain in a bullish rebound and will further target the 60-day moving average resistance at $4,905. If it breaks and closes above, it may further reach $5,140.
Gold: Support to watch is around $4,735 or $4,655; resistance to watch is around $4,845 or $4,915;
Silver: Support to watch is around $74.40 or $73.30; resistance to watch is around $78.20 or $80.20;
Note:
Gold TD = (International gold price × exchange rate) / 31.1035
If international gold moves by $1, gold TD is about 0.25 yuan in change (theoretical).
U.S. futures gold price = London spot price × (1 + gold swap interest rate × number of days to futures maturity / 365)
Follow me—so your gold trading ideas will be clearer!
Review the historical causal chain, interpret the current environment, look ahead to future directions, and adhere to the bold-forecast yet cautious-trading principle. --Zhang Yaoxue
The views and analysis above only represent the author’s personal thinking. They are for reference only and do not constitute trading advice. If you act on them, you take full responsibility for any gains or losses.
You decide your own money.