Trade
Basic
Futures
Futures
Hundreds of contracts settled in USDT or BTC
Options
HOT
Trade European-style vanilla options
Unified Account
Maximize your capital efficiency
Demo Trading
Futures Kickoff
Get prepared for your futures trading
Futures Events
Participate in events to win generous rewards
Demo Trading
Use virtual funds to experience risk-free trading
Earn
Launch
CandyDrop
Collect candies to earn airdrops
Launchpool
Quick staking, earn potential new tokens
HODLer Airdrop
Hold GT and get massive airdrops for free
Launchpad
Be early to the next big token project
Alpha Points
NEW
Trade on-chain assets and enjoy airdrop rewards!
Futures Points
NEW
Earn futures points and claim airdrop rewards
Investment
Simple Earn
Earn interests with idle tokens
Auto-Invest
Auto-invest on a regular basis
Dual Investment
Buy low and sell high to take profits from price fluctuations
Soft Staking
Earn rewards with flexible staking
Crypto Loan
0 Fees
Pledge one crypto to borrow another
Lending Center
One-stop lending hub
VIP Wealth Hub
Customized wealth management empowers your assets growth
Private Wealth Management
Customized asset management to grow your digital assets
Quant Fund
Top asset management team helps you profit without hassle
Staking
Stake cryptos to earn in PoS products
Smart Leverage
NEW
No forced liquidation before maturity, worry-free leveraged gains
GUSD Minting
Use USDT/USDC to mint GUSD for treasury-level yields
More
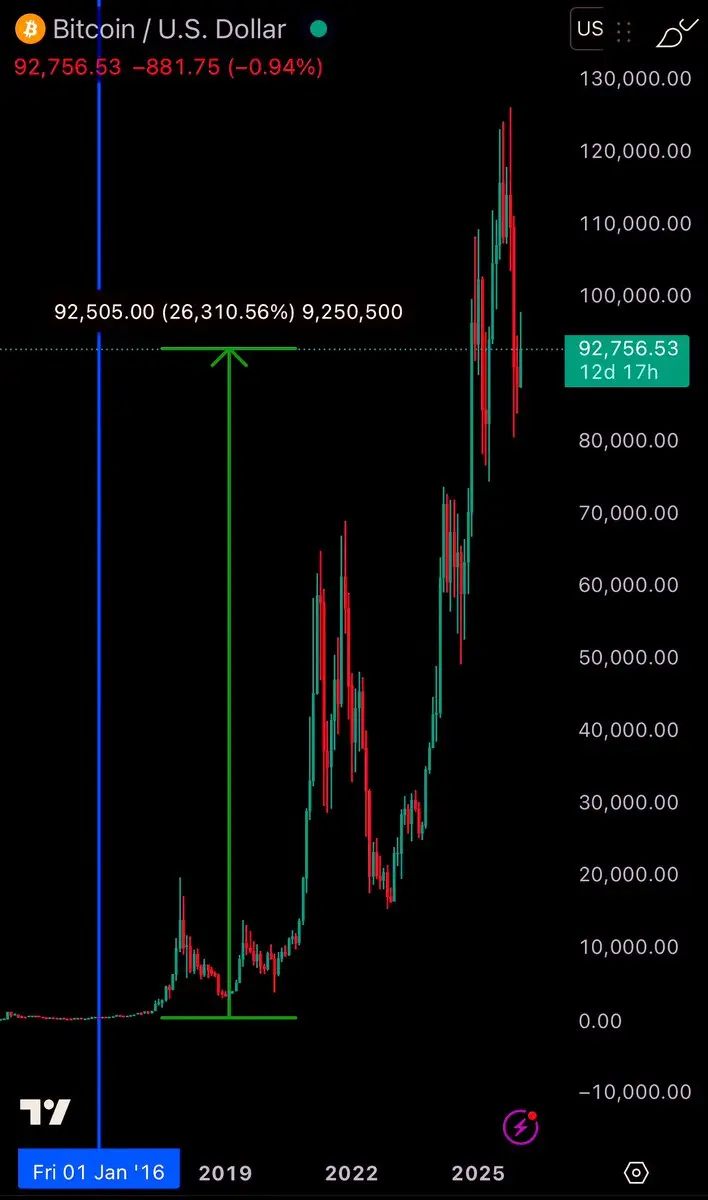
#Crypto Total Market Cap (Weekly) – Structure Does Not Lie
This chart is repeating history.
We have now printed yet another double bottom at prior resistance turned support, the same structure that preceded every major expansion phase in past cycles.
🔹 Price is holding above the 200 EMA
🔹 It is visually presenting 300 MA as Macro Bottom
🔹 No distribution structure
🔹 No loss of trend
🔹 Acceptance above the ~$3T regime level
That is not bearish behavior. That is bull market continuation behavior.
Probability Outlook:
▫️3 Months: Bullish continuation / consolidation bias → 65–70%
▫️6 Months

- Reward
- like
- Comment
- Repost
- Share
GM Fam! Hyped for a new week? ❤️
#crypto
#crypto

- Reward
- like
- Comment
- Repost
- Share
快上马
快上马
Created By@VKidney
Listing Progress
0.10%
MC:
$3.54K
Create My Token
Tip: →♥
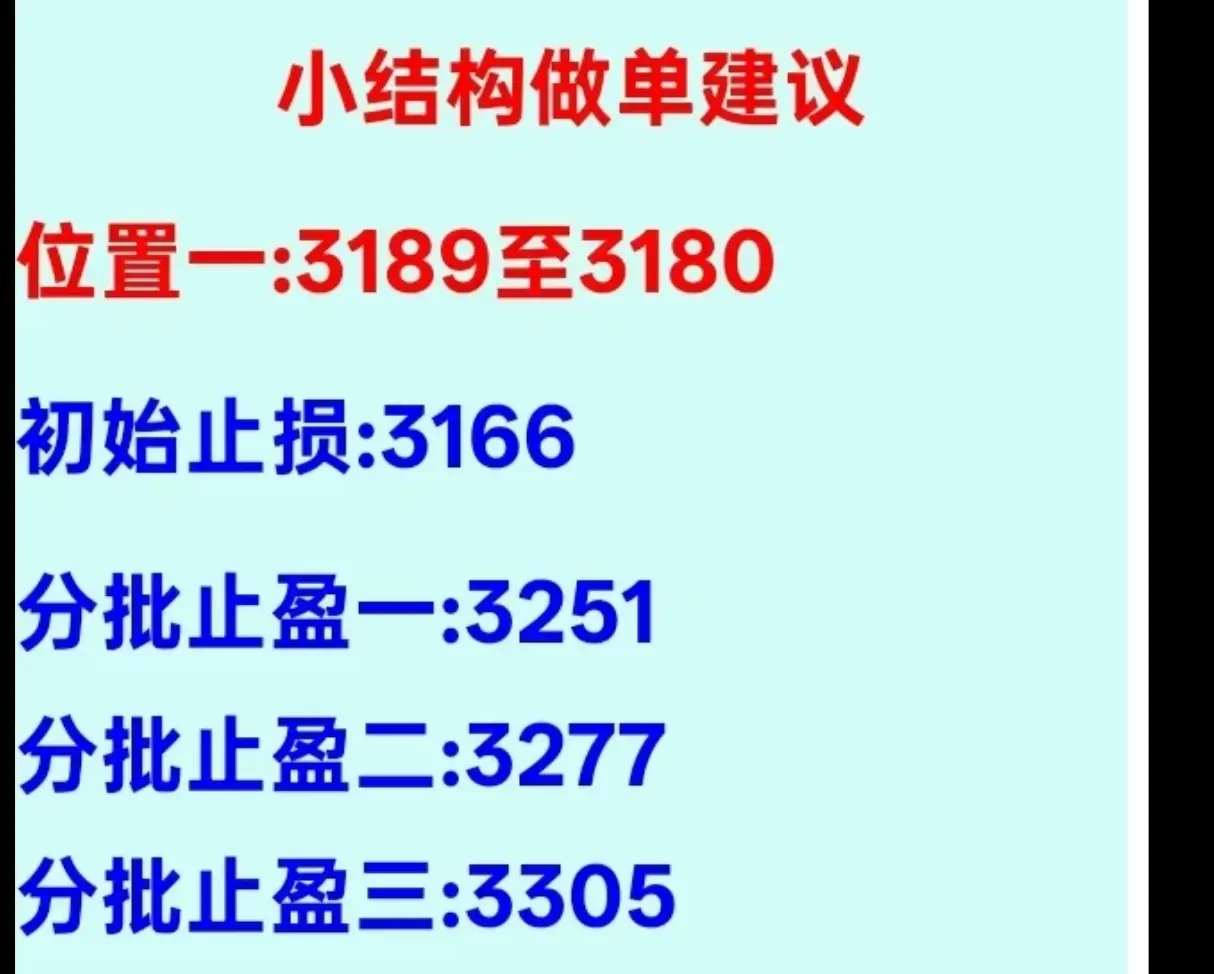
ETH position 1 has already triggered entry, and for Bitcoin (BTC), the position is also slightly adjusted, with a suggestion that a tolerance of about 200 points up and down for Bitcoin is appropriate. Currently, just observe how the rebound effect unfolds. Litecoin is bottoming out in the 64-66 range, which is also just right at the target. If Bitcoin and Ethereum can reach the first take-profit level, you can reduce most of the position, and the remaining can be pushed to break even.
View OriginalETH position 1 has already triggered entry, and for Bitcoin (BTC), the position is also slightly adjusted, with a suggestion that a tolerance of about 200 points up and down for Bitcoin is appropriate. Currently, just observe how the rebound effect unfolds. Litecoin is bottoming out in the 64-66 range, which is also just right at the target. If Bitcoin and Ethereum can reach the first take-profit level, you can reduce most of the position, and the remaining can be pushed to break even.

- Reward
- like
- Comment
- Repost
- Share
Saw people can get X Premium+ for free with 5,000+ verified subscriber followers.
True?
I’ve got 8,739...
Why am I still paying? 🤔
@elonmusk @nikitabier @X
True?
I’ve got 8,739...
Why am I still paying? 🤔
@elonmusk @nikitabier @X

- Reward
- like
- Comment
- Repost
- Share
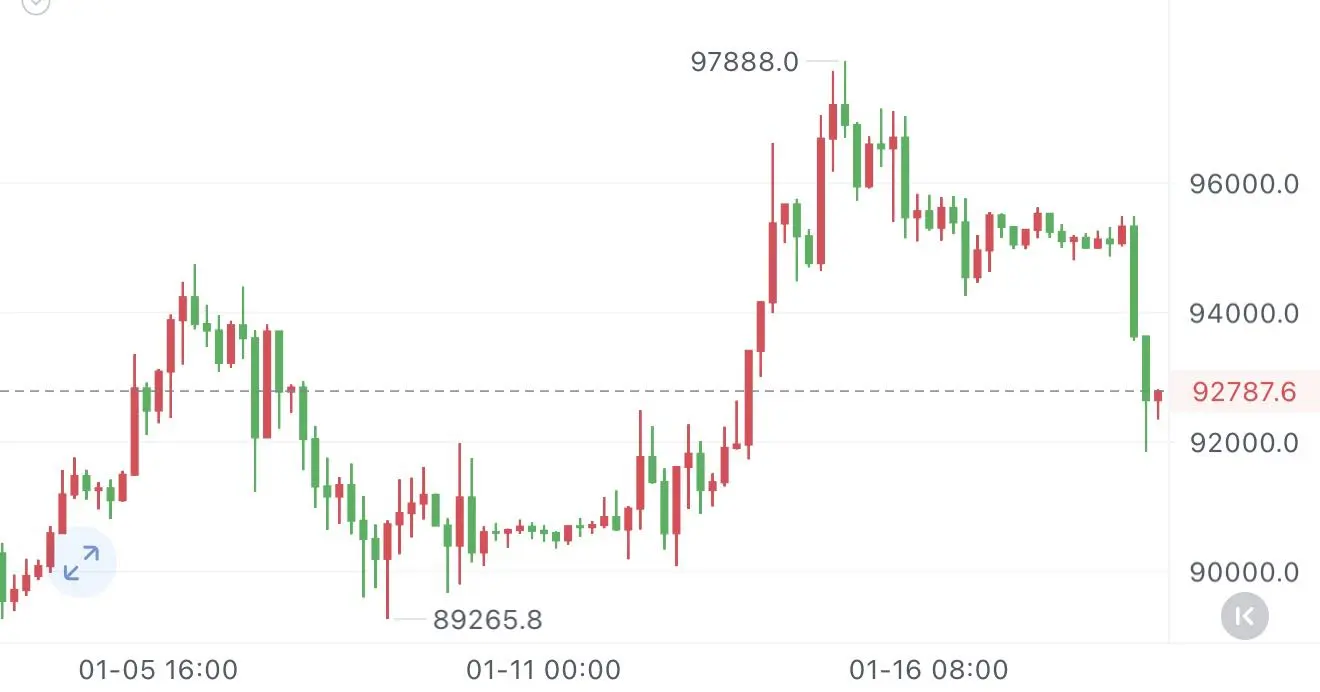
Little Genius: Bitcoin is expected to decline further, down to around 90,000
This morning, it broke below the 93,000 target level, and short positions gained 3,000 points. The upcoming trend is still downward; the lower band of the four-hour Bollinger Bands has already been broken, and the probability of bulls regaining ground is very low. Continue to short around 93,000 and above.
Short around 93,300, target at 90,000#BTC
BTC-2,08%
- Reward
- 1
- 1
- Repost
- Share
GateUser-2af1f29e :
:
Little Genius: Bitcoin is expected to decline further, down to around 90,000 This morning, it broke below the 93,000 target level, and short positions gained 3,000 points. The upcoming trend is still downward; the lower band of the four-hour Bollinger Bands has already been broken, and the probability of bulls regaining ground is very low. Continue to short around 93,000 and above.
Short around 93,300, with a target of 90,000 #BTC
👀 A quiet look at what real capital is doing on JustLendDAO
📥 Supply side is stacking serious liquidity:
🥇 ETH: $1.56B
🥈 sTRX: $748.5M
🥉 TRX: $710M
📤 Borrow side shows what the market actually needs:
🥇 USDT: $139.9M
🥈 TRX: $47.7M
🥉 BTC: $4.38M
This tells a simple story:
People park value in ETH & TRX,
and borrow stability in USDT to move, build, and deploy capital.
Not noise.
Not speculation.
Just real usage, real demand, real liquidity flowing through the system.
This is what a working DeFi money market looks like. 🏗️
And JustLendDAO is quietly becoming one of its core pillars. 🚀
@
- Reward
- like
- Comment
- Repost
- Share
- Reward
- like
- Comment
- Repost
- Share
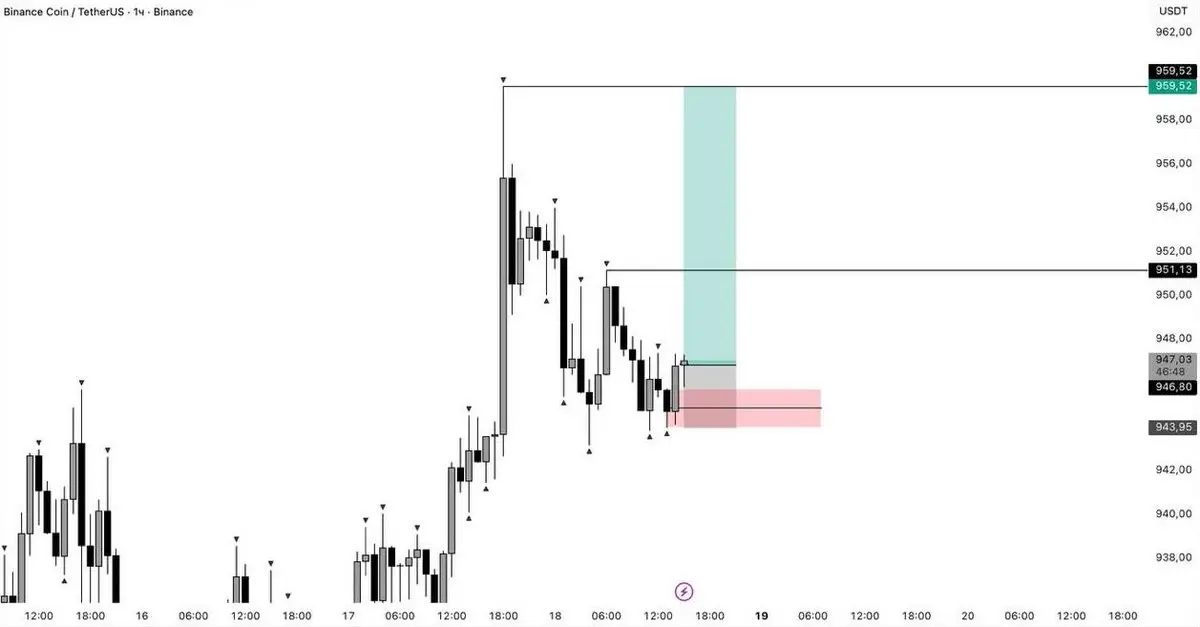
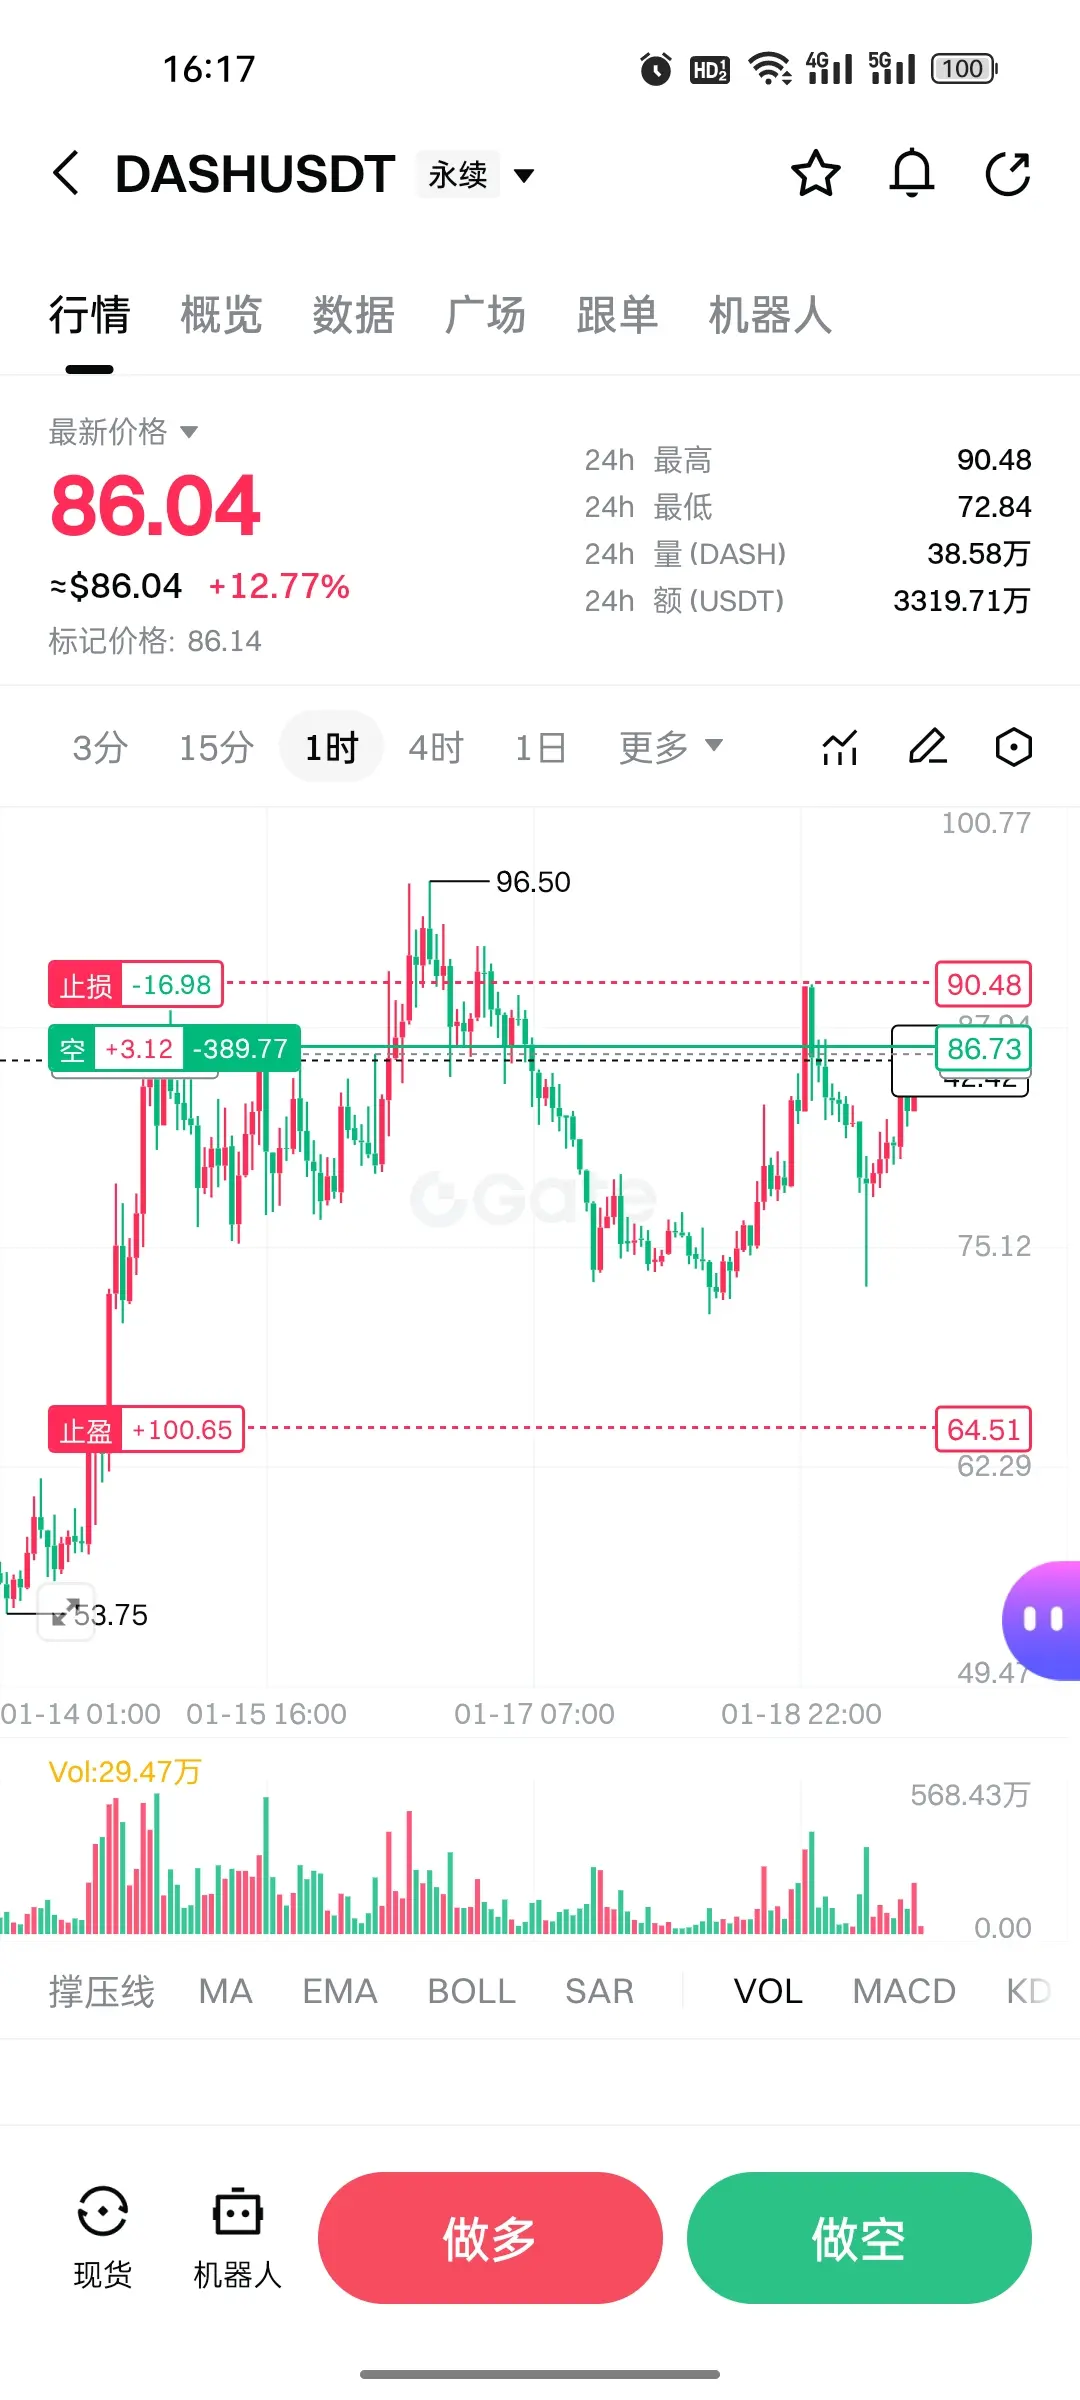
DASH Short-term Downtrend Confirmed, Technical Collapse Approaching
From a technical perspective, DASH's upward momentum has been completely exhausted. After an initial rally, the price faced resistance at 96.50, forming a double top pattern. The subsequent correction directly broke the key neckline, confirming a reversal signal.
Currently, the MACD indicator has formed a death cross at a high level, with the red histogram continuously shrinking and the green histogram rapidly expanding, indicating that the bearish force is dominating the market. Although the KDJ indicator has temporarily rebo
DASH9,41%
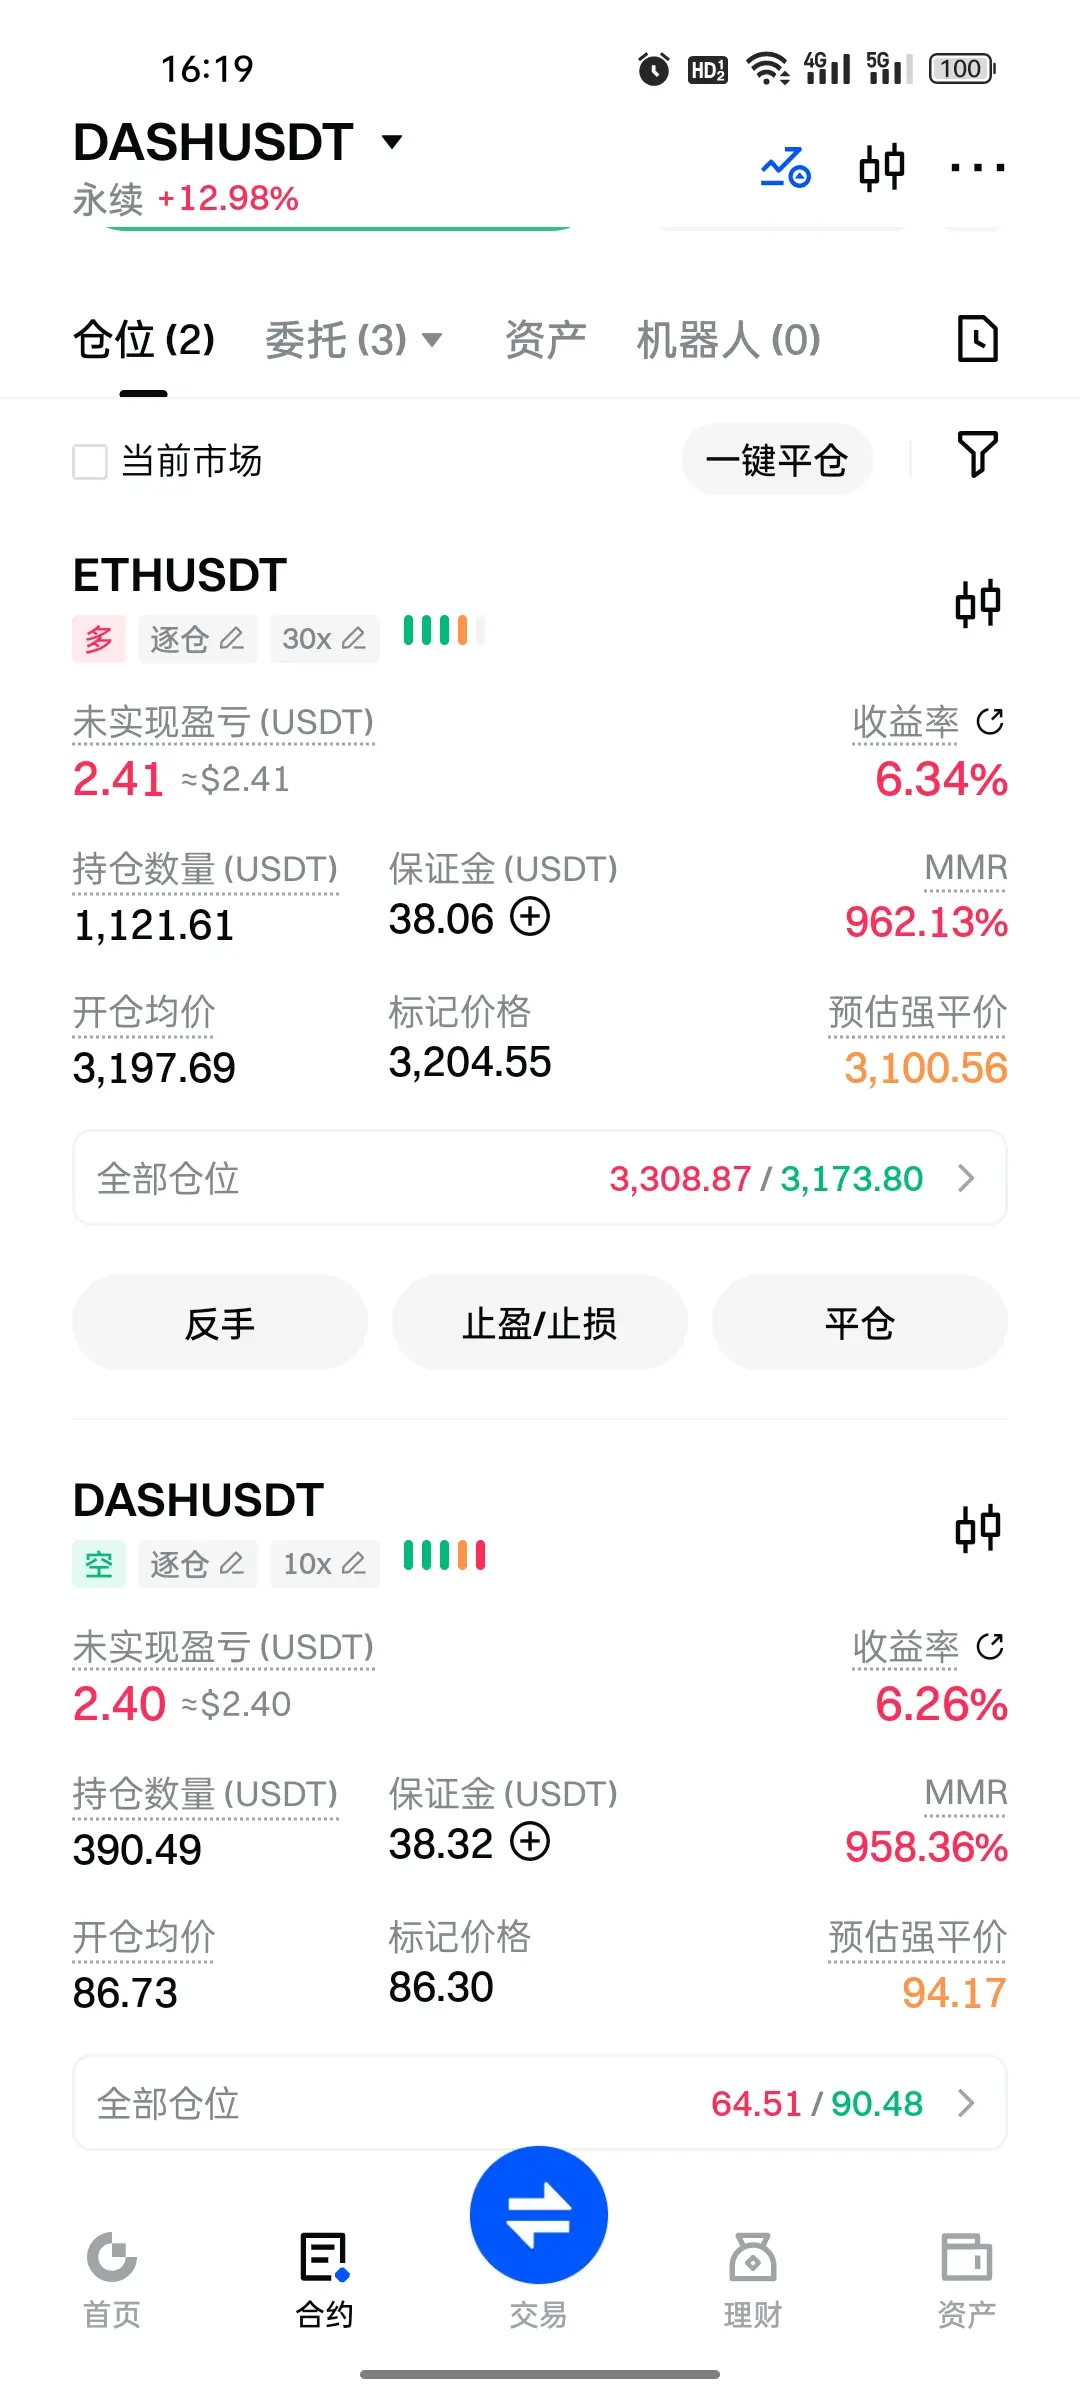
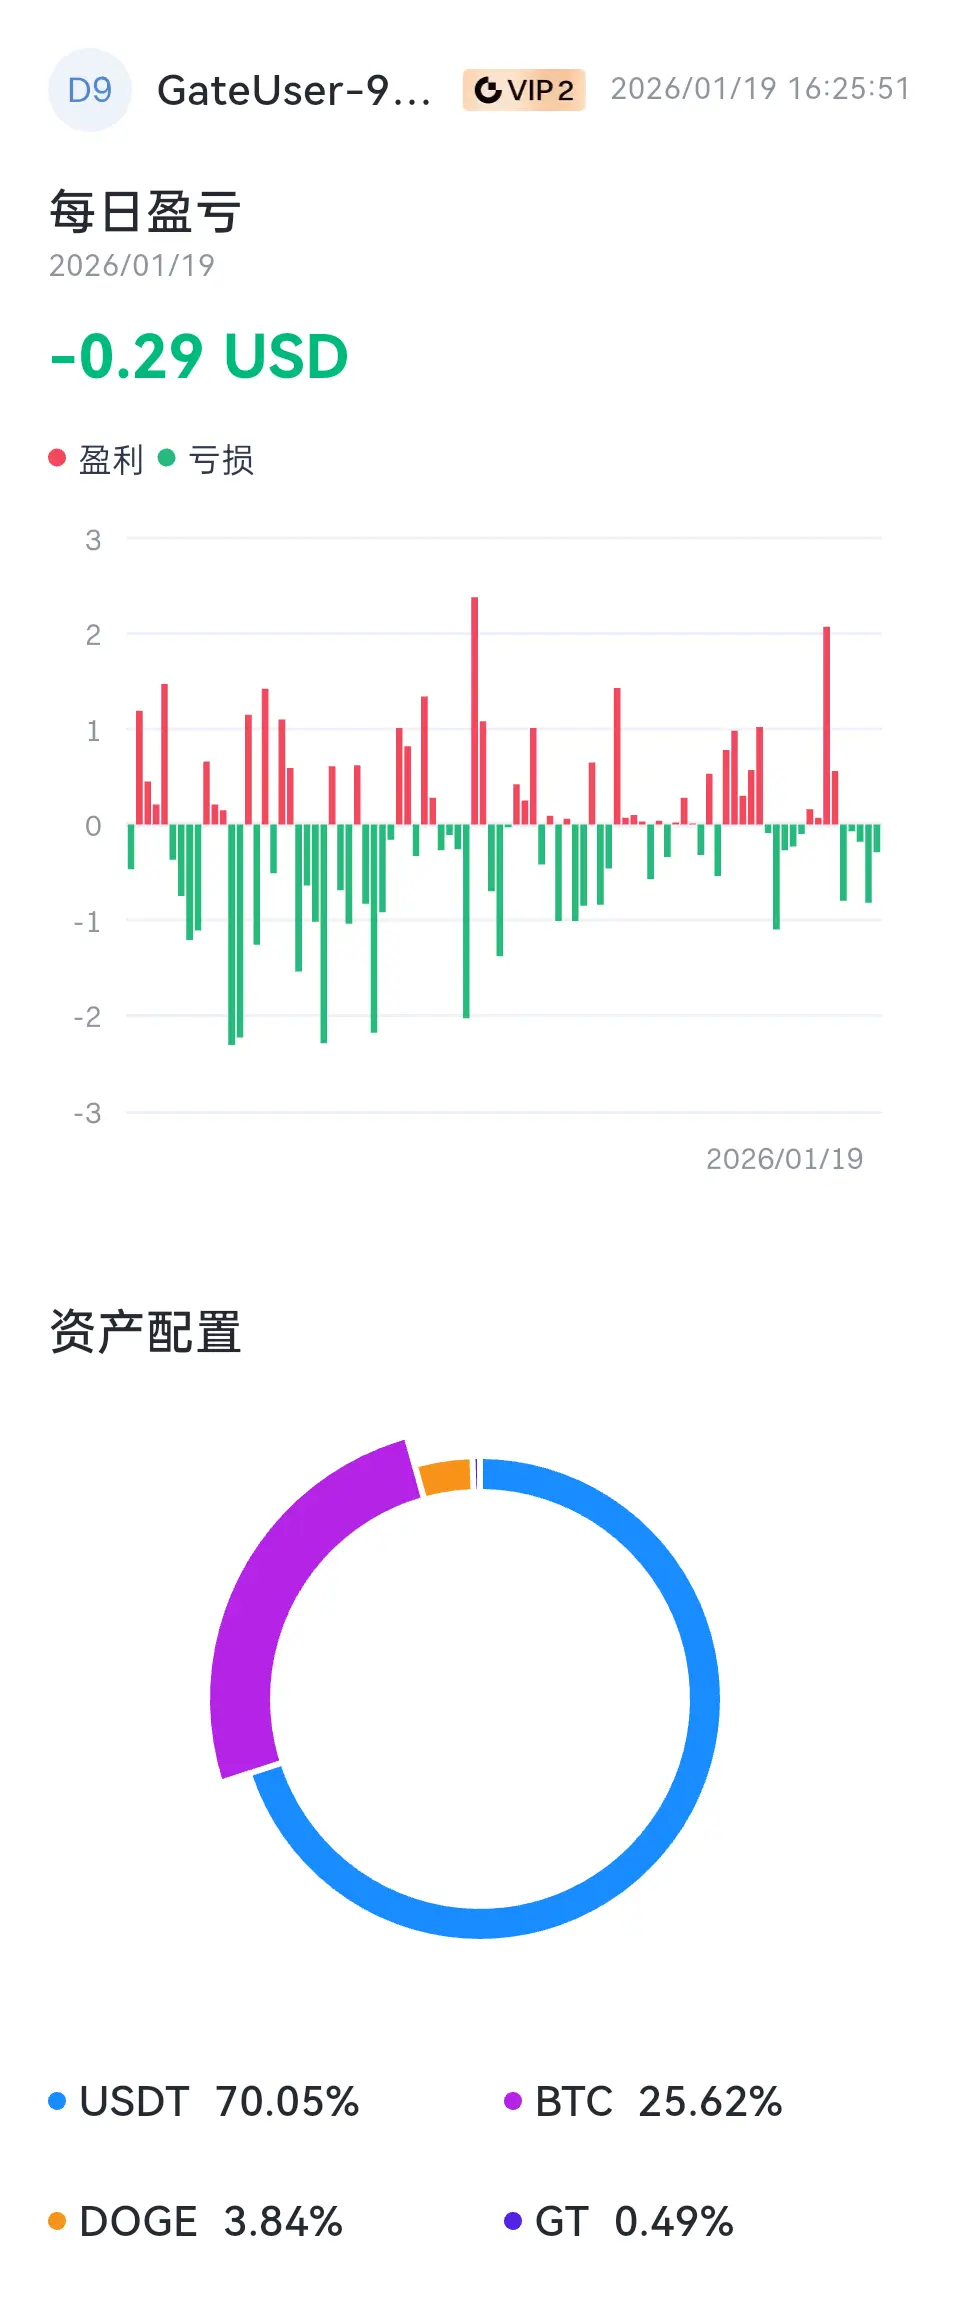
[The user has shared his/her trading data. Go to the App to view more.]
- Reward
- like
- Comment
- Repost
- Share
#AIBT Opportunity knocks but once, AIBT is your golden key to unlock the door to wealth!
View Original


- Reward
- like
- Comment
- Repost
- Share
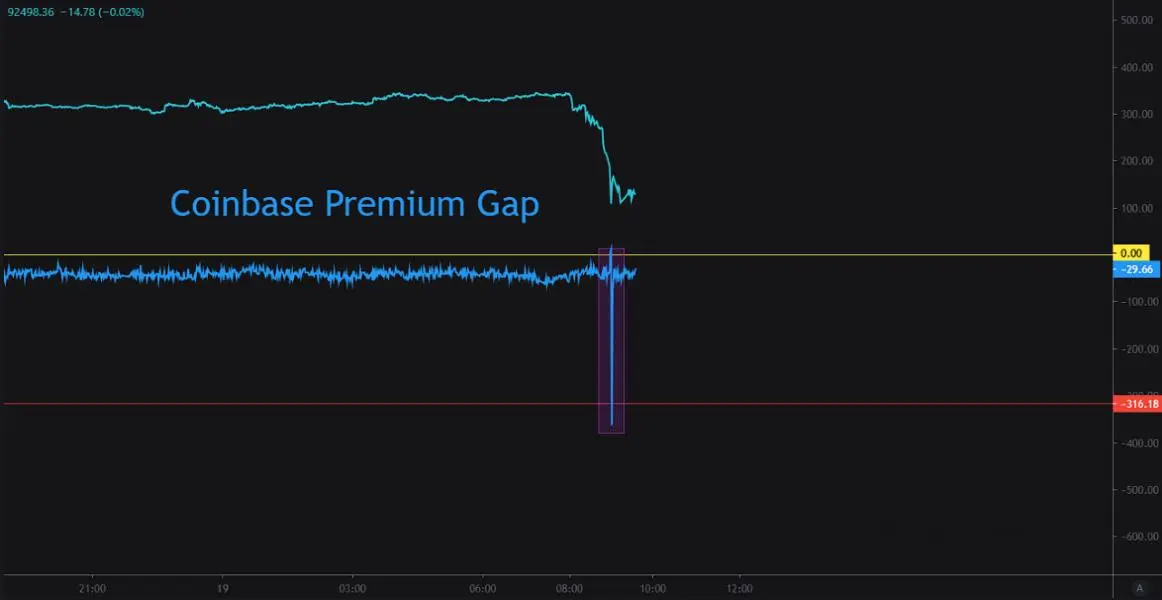
Strongest CPG #Premium in Recent Periods
“Since the #ETF market was not open at the time, this selling pressure is coming from U.S. whales operating outside of ETFs.”, By Mignolet
#crypto
“Since the #ETF market was not open at the time, this selling pressure is coming from U.S. whales operating outside of ETFs.”, By Mignolet
#crypto
- Reward
- like
- Comment
- Repost
- Share
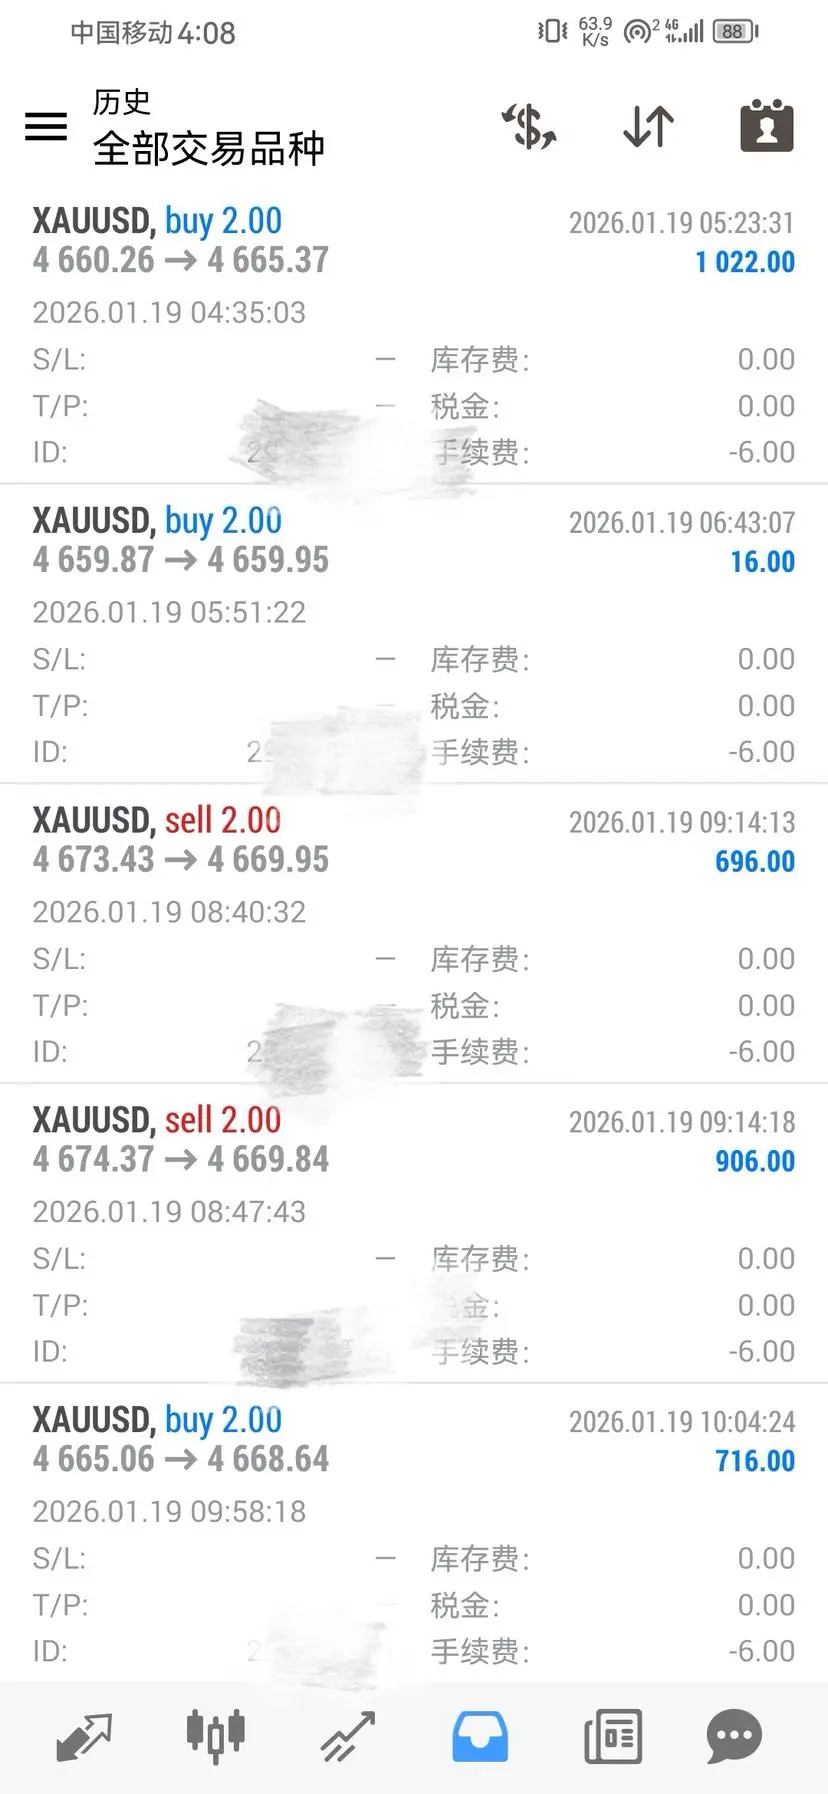
The first day of the lunar new year brings continuous wins! Gold continues to profit intraday, boosting the team's confidence, with laughter and joy all around. Good luck is in place, and this year must be a bountiful year🔥
View Original

- Reward
- like
- Comment
- Repost
- Share
🔹 ETH breaks below $3,200 — is this a short-term panic flush or a signal of trend reversal?
251
- Reward
- like
- Comment
- Repost
- Share
马年大吉
马年大吉
Created By@VKidney
Listing Progress
0.00%
MC:
$3.47K
Create My Token
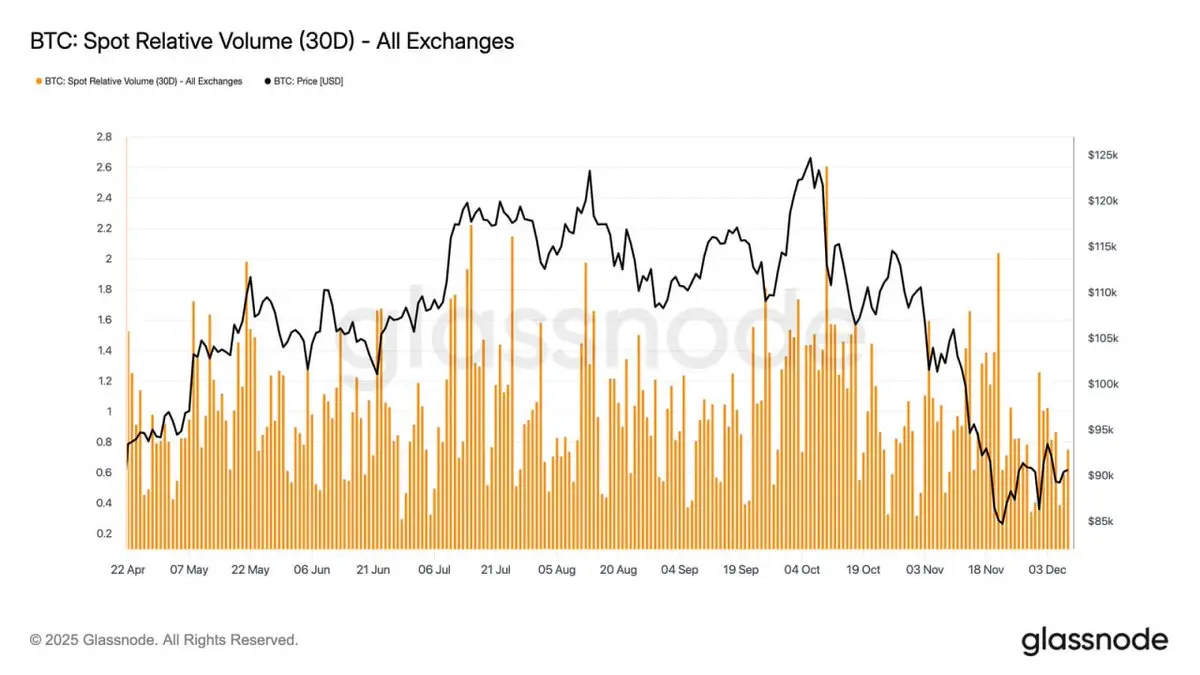
Bitcoin's spot volume near 30-day range lows 📉📊. Activity weakened through November-December, mirroring price decline and showing participation retreat ⚡️💼.
Volume contraction reflects defensive positioning with less liquidity for volatility 👀. Attention shifts to FOMC meeting for potential catalyst 🎯💰.
Volume contraction reflects defensive positioning with less liquidity for volatility 👀. Attention shifts to FOMC meeting for potential catalyst 🎯💰.
BTC-2,08%
- Reward
- like
- Comment
- Repost
- Share
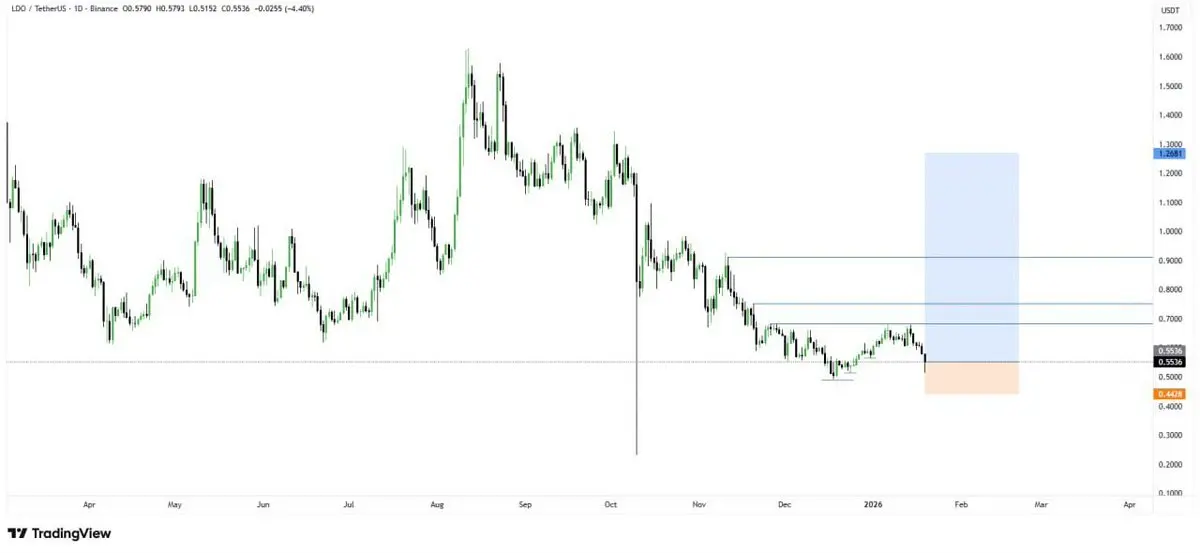
$LDO Re-Buy (Spot) 📈
Entries: 0.553 / 0.505 / 0.465
Targets: 0.61 → 0.665 → 0.72 → 0.79 → 0.90 | HODL: 1.35 – 1.85
Stop: 0.4428
Scale in, manage risk. 💎
Entries: 0.553 / 0.505 / 0.465
Targets: 0.61 → 0.665 → 0.72 → 0.79 → 0.90 | HODL: 1.35 – 1.85
Stop: 0.4428
Scale in, manage risk. 💎
- Reward
- like
- Comment
- Repost
- Share
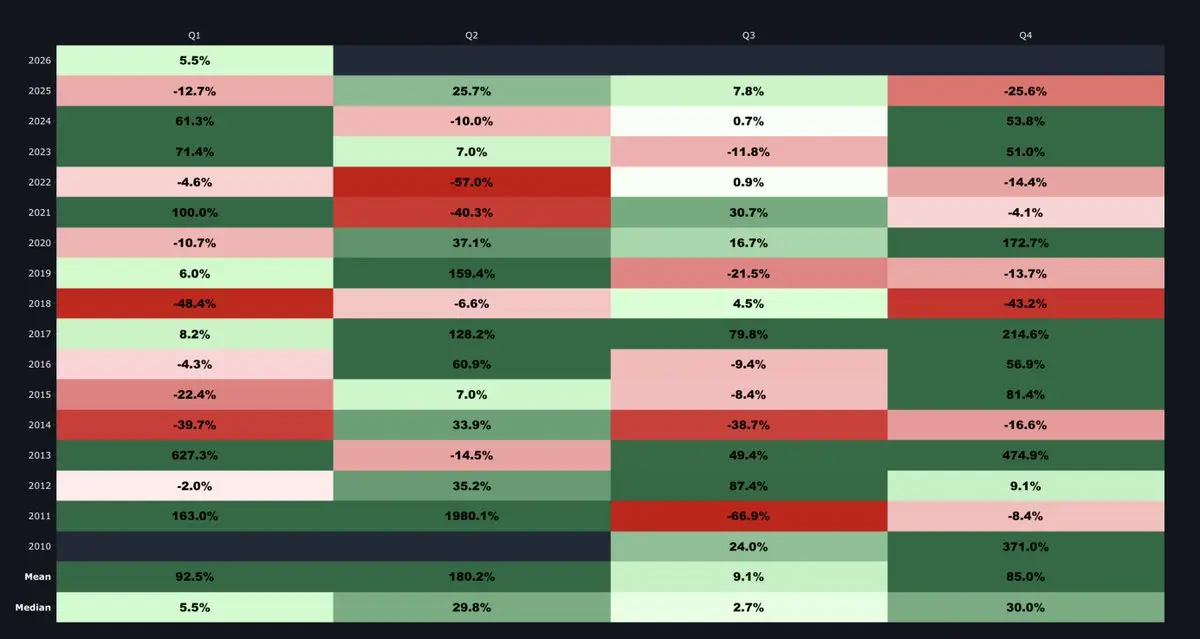
EVERY RED Q4 HAS BEEN FOLLOWED BY A GREEN Q1.
THE PATTERN HAS NEVER FAILED.
THE PATTERN HAS NEVER FAILED.
- Reward
- like
- Comment
- Repost
- Share
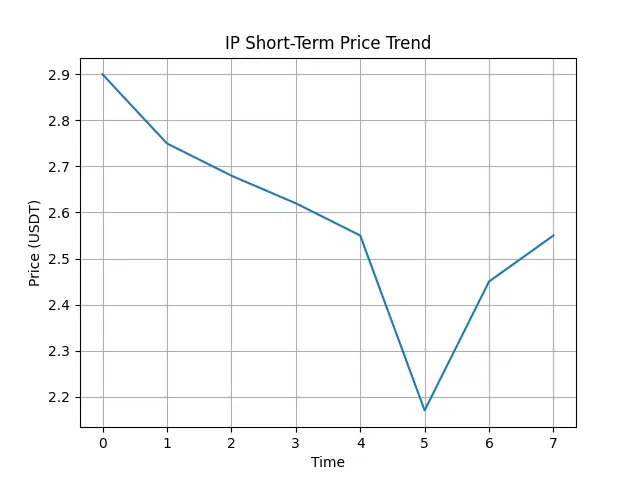
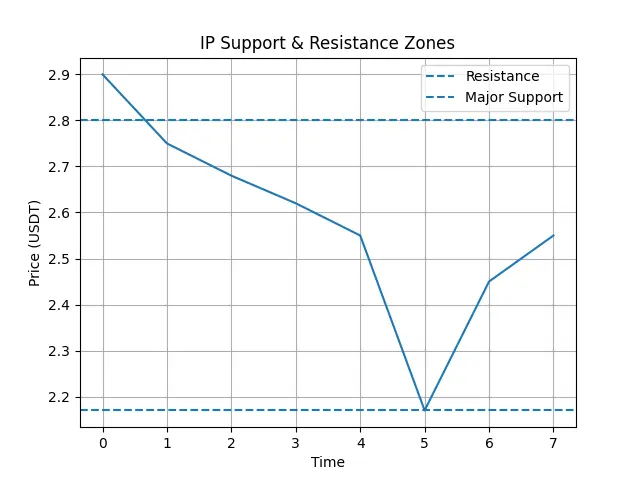
$IP IP saw a strong rejection near the 2.90 zone, followed by a sharp downside move toward 2.17. That drop looks like a fast liquidity sweep. After touching that low, price bounced and is now stabilizing around 2.55.
Selling pressure has slowed, but buyers are still cautious.
🔍 Short-Term View (15m – 1h)
Price is below short EMAs, showing short-term weakness
Momentum indicators are mixed, not fully oversold
2.45–2.40 is the nearest support area
Holding above this zone keeps the structure stable.
⏳ Mid-Term View (4h)
Trend is bearish to neutral
Strong resistance sits around 2.70–2.80
A real
IP-8,89%
- Reward
- like
- Comment
- Repost
- Share
- Reward
- like
- Comment
- Repost
- Share
Market Analysis And Key Levels
157
- Reward
- like
- Comment
- Repost
- Share
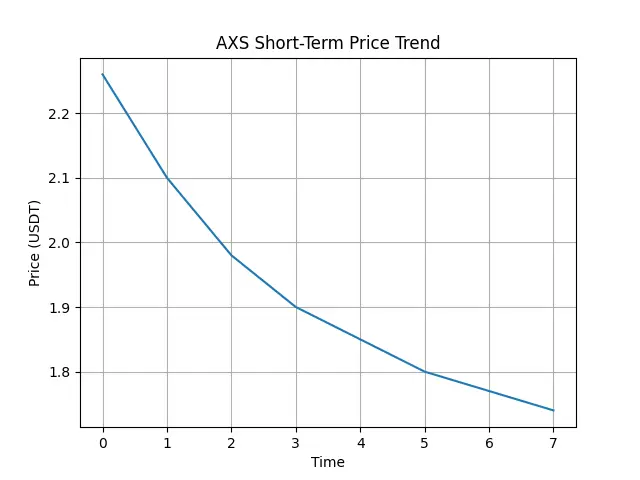
$AXS AXS is under pressure right now. After failing to hold above the 2.00+ zone, price has been slowly grinding down and is currently trading around 1.77. Selling looks controlled, not panic — but buyers are clearly cautious.
Volume has also cooled, which usually signals a slow decision phase.
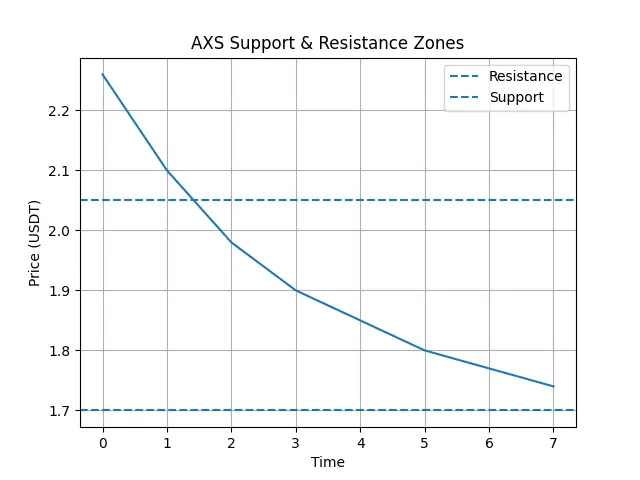
🔍 Short-Term View (15m – 1h)
Price is below short EMAs, showing bearish control
Momentum indicators are weak but not deeply oversold
1.70–1.72 is the nearest support zone to watch
A reaction from this area would be normal.
⏳ Mid-Term View (4h)
Trend is slightly bearish
EMA resistance sits around 1.85
Volume has also cooled, which usually signals a slow decision phase.
🔍 Short-Term View (15m – 1h)
Price is below short EMAs, showing bearish control
Momentum indicators are weak but not deeply oversold
1.70–1.72 is the nearest support zone to watch
A reaction from this area would be normal.
⏳ Mid-Term View (4h)
Trend is slightly bearish
EMA resistance sits around 1.85
AXS-9,75%
- Reward
- 1
- 1
- Repost
- Share
ybaser :
:
2026 GOGOGO 👊Load More
Join 40M users in our growing community
⚡️ Join 40M users in the crypto craze discussion
💬 Engage with your favorite top creators
👍 See what interests you
Trending Topics
View More4.88K Popularity
326.14K Popularity
36.63K Popularity
2K Popularity
1.84K Popularity
News
View MoreImmunefi(IMU) will be launched on the Gate Instant Exchange platform on January 22, supporting one-click exchange for 2200 cryptocurrencies.
12 m
Japanese Prime Minister: Dissolving the House of Representatives on January 23 and holding early elections
19 m
SNP500 rose 2535.68% after launching Alpha, current price 0.0024177 USDT
36 m
Today's Cryptocurrency News (January 19) | Gold Hits New High; Trump Tariff Threats Escalate
36 m
Alpha Token Launch: SOLANUM is now live
43 m
Pin