
SEI dropped close to $0.048 and then snapped back within minutes, which immediately changed the tone around the asset. That quick recovery after a sharp selloff has raised a key question. Is this the kind of move that appears near a bottom, or is it just a pause before another leg lower?
Some early signs point toward exhaustion from sellers. At the same time, the broader trend still leans downward, which keeps the outlook balanced between caution and opportunity.
Activity around the $0.05 level stands out as one of the most important developments. Large transactions appeared across multiple wallets, with millions of SEI tokens bought at slightly different price levels.
CryptoPanca has focused heavily on this zone. He argues that this type of buying behavior often appears when larger players begin to accumulate positions quietly. His view centers on the idea that these participants tend to step in before a wider recovery becomes visible.
Another key observation involves the liquidity sweep near $0.048. Price dipped below support, then reversed quickly and recovered within minutes. CryptoPanca describes this as a classic pattern that sometimes appears near cyclical bottoms.
That reaction reveals something important. Sellers pushed price lower, yet demand absorbed that move almost instantly. CryptoPanca sees this as a sign that downside pressure may be weakening, even though the trend has not fully changed.
He also pointed to rising attention around SEI-related content, which may indicate growing interest at these lower levels.
- Technical Indicators Show Oversold Conditions But Trend Remains Bearish
- Broader Trend Structure Still Keeps SEI In A Downtrend
- Key Levels That Could Confirm A Real SEI Bottom
- SEI Price Outlook Shows Early Bottoming Signs But No Confirmation Yet
Technical Indicators Show Oversold Conditions But Trend Remains Bearish
A separate look at the SEI chart provides more context beyond market behavior.
The Relative Strength Index shows deeply oversold conditions. RSI 14 sits around 22, and RSI 7 is near 12. These levels often appear after extended selloffs and tend to precede short term relief moves or temporary floors.
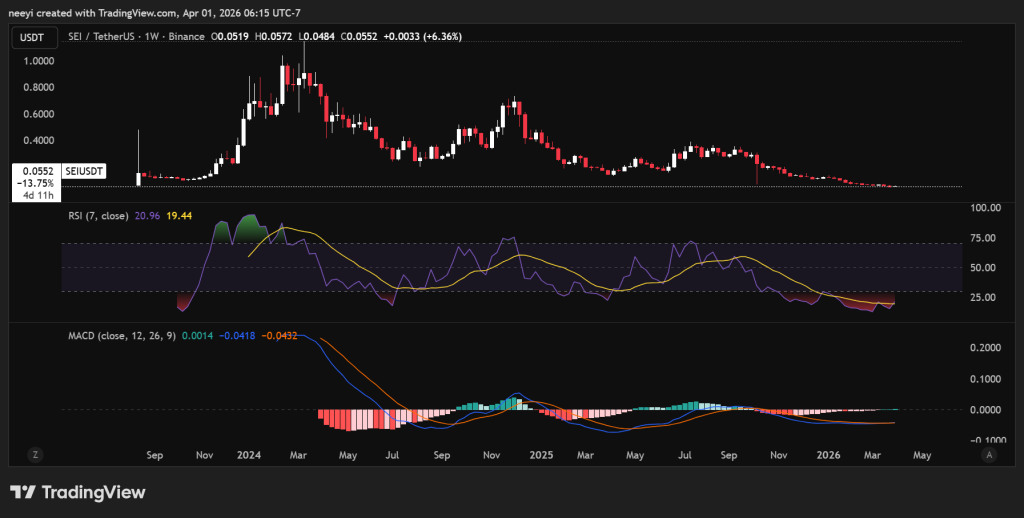
SEI Price Chart / Source: TradingView.com
Momentum indicators add to this view. The MACD remains below zero and under its signal line, yet the histogram has become small. That change shows bearish momentum is slowing down, even though the market has not turned bullish.
Price structure also shows a slight improvement in the short term. After the drop toward $0.051, SEI moved back toward the 7 day SMA around $0.054 to $0.055. That movement suggests sellers are no longer fully controlling price action on every attempt lower.
Broader Trend Structure Still Keeps SEI In A Downtrend
Despite these early signals, the larger trend still points downward.
SEI trades well below its key moving averages. The 30-day SMA sits near $0.0627, and the 200-day SMA is much higher, around $0.1431. Price staying below these levels shows that the broader structure has not shifted.
Momentum confirms this weakness. The MACD line remains below both the signal line and the zero level, which means the market has not entered a bullish phase yet.
Another factor reinforces the bearish structure. SEI has dropped roughly 20% over the past 30 days. That sustained decline shows that sellers have dominated the market over a longer period, even if short-term rebounds appear.
Key Levels That Could Confirm A Real SEI Bottom
A potential bottom needs confirmation from price structure, not just a quick bounce.
The first level to watch sits around $0.05. Price needs to hold above this region consistently to show that buyers are defending it over time.
A move above the 30-day SMA would mark the next step. That level sits between $0.06 and $0.063, and reclaiming it would indicate that short-term structure is improving.
Momentum indicators must also support the move. RSI needs to recover toward the 40 to 50 range, and MACD needs to move closer to a bullish crossover.
Until these conditions appear, the current setup still looks like an oversold bounce inside a broader downtrend. That leaves room for another test of recent lows if sellers return.
How Much Could XRP Be Worth if Bitcoin Price Crashes to $45,000?_**
SEI Price Outlook Shows Early Bottoming Signs But No Confirmation Yet
SEI now sits at a turning point where both scenarios remain possible. Accumulation patterns and liquidity behavior suggest that a base may be forming. At the same time, the broader trend still shows weakness, and key resistance levels remain intact.
CryptoPanca continues to treat this zone as an area worth accumulating, yet that stance does not confirm a reversal. It highlights a belief that value may exist here, even if price needs more time to stabilize.
The next few moves will likely decide the outcome. A strong hold above $0.05 combined with a push toward $0.06 would strengthen the recovery case. Failure to maintain support could open the door to another dip.
Disclaimer: The information on this page may come from third parties and does not represent the views or opinions of Gate. The content displayed on this page is for reference only and does not constitute any financial, investment, or legal advice. Gate does not guarantee the accuracy or completeness of the information and shall not be liable for any losses arising from the use of this information. Virtual asset investments carry high risks and are subject to significant price volatility. You may lose all of your invested principal. Please fully understand the relevant risks and make prudent decisions based on your own financial situation and risk tolerance. For details, please refer to
Disclaimer.
