
The Bitcoin price has entered a fragile phase after losing one of its most important trend supports. The latest chart shared by analyst Crypto Patel suggests the market may still face a deeper correction before the next major bull cycle begins.
Top analyst Patel shared on X that the current setup closely mirrors previous Bitcoin cycles. In those periods, the market first experienced a sharp drawdown that forced weaker hands out before starting the next explosive rally.
This time, the analyst believes the long-term upside could eventually stretch as high as $350,000, but the path there may involve a painful drop first.
At the moment, Bitcoin is trading roughly 47% below its $126,200 all-time high, and several technical signals on the chart show the structure has weakened in the short term.
- Here’s What Bitcoin Chart Is Showing
- Bitcoin Long-Term Targets Stretch Toward $350K
- Why These Levels Matter For Bitcoin
Here’s What Bitcoin Chart Is Showing
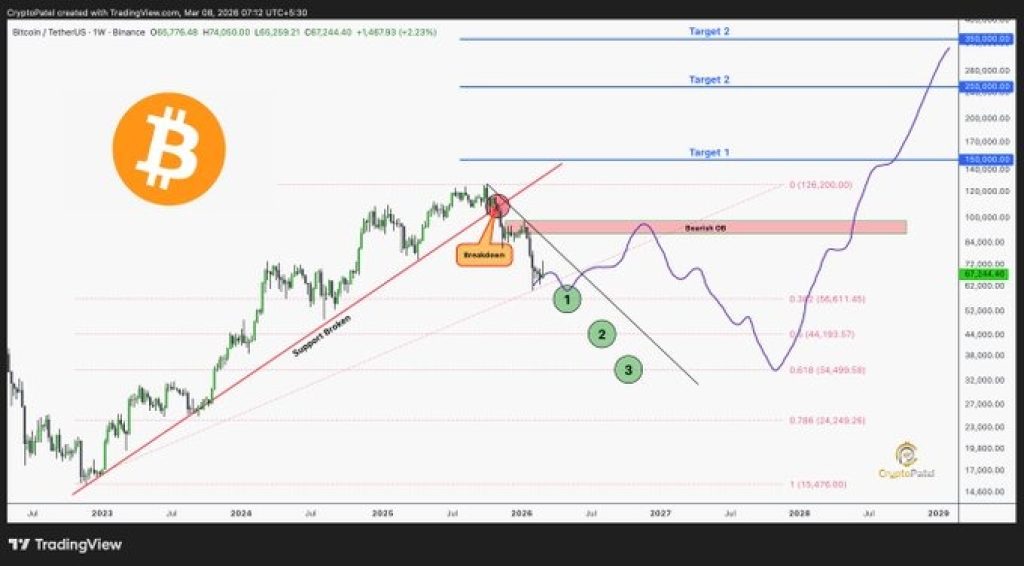
The chart above points to a major technical change that happened after Bitcoin lost the ascending trend line that has been supporting the price action since November 2023. This line has been the backbone of the previous price rallies.
Once that support gave way, the market structure flipped bearish. The breakdown also pushed the BTC price back below a key resistance region between $90,000 and $98,000, which Patel identifies as a bearish order block currently limiting any strong upside attempts.
This combination of a broken trendline and overhead resistance creates the conditions for a deeper retracement before the next major move begins.
The projection on the chart outlines a descending path that could take Bitcoin through several key Fibonacci retracement levels where long-term buyers may begin accumulating again.
Source: X/CryptoPatel
Patel identifies three significant zones where the Bitcoin price is likely to see strong buying pressure during the deeper correction.
The first level is at $56,611. This level is where the 0.382 Fibonacci retracement level is. This is the first significant buying zone for the Bitcoin price.
However, if the selling pressure continues for the Bitcoin price, the next significant level is at $44,193. This level is where the 0.5 Fibonacci retracement level is. The Bitcoin price has historically visited this level during the mid-cycle retracement before continuing the long-term uptrend.
The last key buying level for the Bitcoin price is at $34,499. This level is where the 0.618 Fibonacci retracement level is. This is often referred to as the golden pocket. This level has historically attracted strong institutional buying during previous cycles.
_****Silver Price Could Explode as Banks Rush to Cover Massive Short Positions**
Bitcoin Long-Term Targets Stretch Toward $350K
While the near-term outlook remains cautious, the long-term projection in Patel’s chart paints a far more bullish picture.
Once the accumulation phase ends, the analyst believes that a new cycle of expansion will begin for Bitcoin. This cycle may cause the BTC price to achieve various milestones.
The first long-term milestone for the price of Bitcoin will be $150,000. After that, the price may rise to $250,000. The last milestone for the price of Bitcoin is shown in the last projection of the chart. The price of Bitcoin may rise to $350,000.
The curved projection drawn on the BTC chart reflects the kind of exponential growth Bitcoin has historically experienced once new bull markets gain traction.
Why These Levels Matter For Bitcoin
The logic behind these zones comes from how Bitcoin has behaved in previous cycles. Major rallies were often preceded by sharp corrections that pushed the price back to Fibonacci support levels where stronger hands began accumulating.
During those phases, retail traders often panic and sell into weakness, while larger players gradually build positions.
Patel believes the same pattern may play out again. If that happens, the next major opportunity could appear during periods when sentiment across the market turns extremely negative.
For now, the chart suggests the Bitcoin price may still need to complete its corrective phase before the next major upward expansion begins.
Disclaimer: The information on this page may come from third parties and does not represent the views or opinions of Gate. The content displayed on this page is for reference only and does not constitute any financial, investment, or legal advice. Gate does not guarantee the accuracy or completeness of the information and shall not be liable for any losses arising from the use of this information. Virtual asset investments carry high risks and are subject to significant price volatility. You may lose all of your invested principal. Please fully understand the relevant risks and make prudent decisions based on your own financial situation and risk tolerance. For details, please refer to
Disclaimer.
Gerelateerde artikelen
Bitcoin ETF Inflows Turn Positive for Year, All Flow Metrics Green for First Time in Months
Gate News message, April 23 — Bitcoin spot ETFs are gaining momentum as all flow metrics tracked by Bloomberg turned positive for the first time in months, according to Bloomberg Senior ETF Analyst Eric Balchunas. Ben Slavin, global head of ETFs at BNY Asset Servicing (which services 80% of the
GateNews3m geleden
Bloomberg Analyst Mike McGlone Flags $75,000 as Critical Bitcoin Level for 2026
Gate News message, April 23 — Bloomberg analyst Mike McGlone has released an assessment of Bitcoin's performance relative to traditional markets, highlighting $75,000 as a critical threshold for BTC in 2026.
According to McGlone's analysis, Bitcoin and the S&P 500 have shown similar performance
GateNews1u geleden
Bitcoin Eyes $80,000 as ETF Inflows, Whale Buying Support Rally
Bitcoin is trading near $78,400 on Thursday after reaching an intraday high of $79,426 on Wednesday, according to The Block's price data. Institutional flows have supported the advance, with spot Bitcoin ETFs recording $11.8 million in inflows on April 21 as part of a six-day streak, while spot Ethe
CryptoFrontier1u geleden
Bitcoin at $81,848 Would Trigger $1.56B in Short Liquidations on Major CEXs
Gate News message, April 23 — According to Coinglass data, if Bitcoin breaks above $81,848, cumulative short liquidations across major centralized exchanges would reach $1.56 billion.
Conversely, if BTC drops below $74,105, cumulative long liquidations would total $1.428 billion.
GateNews3u geleden
Bitcoin Futures Open Interest Declines 5.74% in 24 Hours, Total Positions at $60.08B
Gate News message, April 23 — According to Coinglass data, Bitcoin futures open interest across all exchanges fell 5.74% over the past 24 hours, with total positions now standing at $60.08 billion.
Among major platforms, a leading CEX
GateNews5u geleden
Bitcoin and Ethereum Options Worth $98.7B Set to Expire
Gate News message, April 23 — Bitcoin and Ethereum options with a combined notional value of $98.7 billion are set to expire this month. According to on-chain data, 109,000 BTC options will expire with a put-call ratio of 0.93 and a maximum pain point of $72,000, representing a notional value of $85
GateNews5u geleden