The Sei (SEI) price has spent the past weeks under steady pressure, sliding lower and shaking out weak hands along the way.
Now, the chart is starting to show signs that this move may be losing strength. Top analyst Sjuul from AltCryptoGems shared on X that SEI could be in the process of building a base, which often happens before a meaningful move higher.
This does not mean a rally is guaranteed, but it does suggest that sellers are no longer in full control.
- What the SEI chart is showing
- Why support and resistance matter here For SEI Price
- Short-term outlook for SEI
What the SEI chart is showing
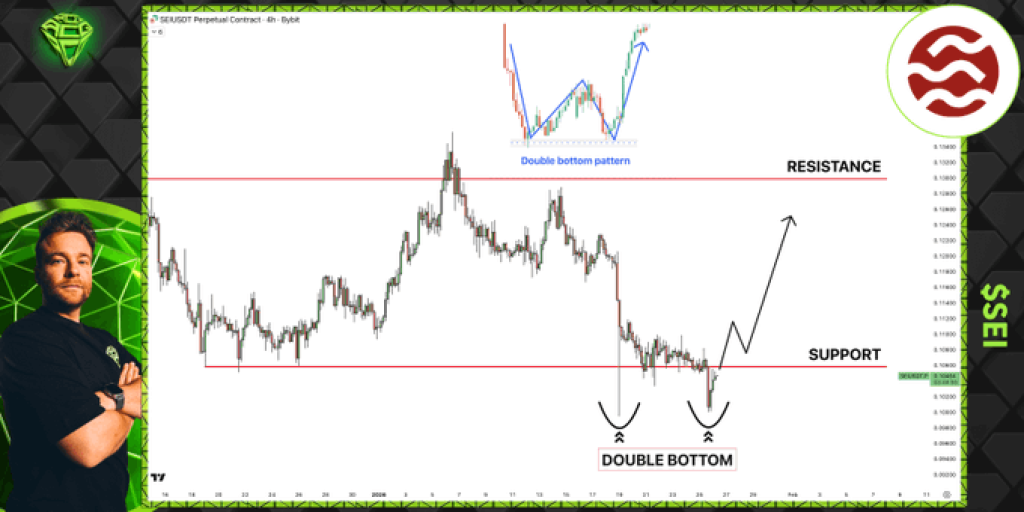
On the chart, SEI has tested the same support area twice after a prolonged decline. Each time price reached that zone, it failed to push much lower and quickly bounced back above it.
That behavior matters because it shows buyers are stepping in at roughly the same price level. Instead of the SEI price continuing to fall freely, it is now reacting and stabilizing around this support.
More importantly, the second visit to that area did not lead to new lows. That usually signals that selling pressure is fading and that the market may be starting to build a floor rather than preparing for another leg down.
Source: X/Sjuul
Why support and resistance matter here For SEI Price
Right now, SEI is trading just above a clearly defined support zone. As long as price stays above that level, the structure remains constructive in the short term.
Above, there is a visible resistance level where price was previously rejected. This is the zone that needs to be reclaimed for any sustained upside to develop. Till then, the SEI price remains in the recovery phase rather than an uptrend.
Essentially, holding the support keeps the bullish picture alive, while breaking the resistance opens the gates to more follow-through.
_****BlackRock Investors Are Pulling Out of Bitcoin and Crypto!**
Moreover, Sjuul noted that the key is acceptance back above support.That means not just touching it, it means being above it and building up your own prices.
If the SEI price holds this level, starts making higher lows, it may be a sign that buyers are gradually gaining ground. Then, the jump to the next resistance level would be an impending target in the short term.
If, however, SEI loses this support and closes clearly below it, the entire setup would weaken and shift focus back to downside risk.
Short-term outlook for SEI
For now, SEI is in a waiting phase, as the weakness in the downside momentum that has characterized the past is declining, but no signs of a strong trend can yet be ascertained.
This will be the very first indicator of the reversal formation if the rise of the price can be sustained past the resistance level. However, the investors may remain cautious unless the SEI price rises past the support.
Overall, it would seem that SEI may be looking to establish a foothold, but the coming few sessions may be indicative of whether or not this is a pause or the beginning of something more.
Disclaimer: The information on this page may come from third parties and does not represent the views or opinions of Gate. The content displayed on this page is for reference only and does not constitute any financial, investment, or legal advice. Gate does not guarantee the accuracy or completeness of the information and shall not be liable for any losses arising from the use of this information. Virtual asset investments carry high risks and are subject to significant price volatility. You may lose all of your invested principal. Please fully understand the relevant risks and make prudent decisions based on your own financial situation and risk tolerance. For details, please refer to
Disclaimer.
Gerelateerde artikelen
BNB Holds $600 as Hard Fork Nears and Bulls Eye Breakout
Key Insights:
BNB holds above 600 as traders lock profits while attention shifts toward Osaka. The Mendel upgrade is expected to influence short-term price direction.
Fast finality and fee stability improvements aim to attract institutional usage, while increased activity could accelerate to
CryptoNewsLand51m geleden
Solana Price Compresses at Key Level as Security Upgrades Emerge
Key Insights
The Solana price compresses near the triangle apex as the EMA cluster and CRT range align, creating conditions that often precede sharp directional volatility expansion.
The quantum readiness report confirms Falcon integration, ensuring Solana can activate post-quantum
CryptoNewsLand51m geleden
Shiba Inu Faces Pressure After Whale Offloads 800B Tokens
Key Insights
A single SHIB wallet sold 800 billion tokens for $4.9 million, yet still controls over 99 trillion tokens in remaining holdings.
SHIB price remains range-bound between $0.0000060 support
CryptoNewsLand56m geleden
Shiba Inu Faces Pressure After Whale Offloads 800B Tokens
Key Insights
A single SHIB wallet sold 800 billion tokens for $4.9 million, yet still controls over 99 trillion tokens in remaining holdings.
SHIB price remains range-bound between $0.0000060 support
CryptoNewsLand56m geleden
Chainlink Price Tightens Range as Breakout Pressure Builds
Key Insights:
Chainlink trades within a narrowing range as buyers defend support while sellers cap gains, creating a compression pattern that often precedes strong directional price moves.
Momentum weakens near resistance despite price holding above key averages, indicating reduced bullish s
CryptoNewsLand1u geleden
Solana Price Weakens as Bearish Pattern Builds Below $90
Key insights
Solana trades near $83 after repeated rejection below $90, forming a rounded top pattern that signals weakening bullish momentum across lower timeframes.
The $78 to $80 support zone remains critical, as a breakdown could trigger further downside toward $75 and possibly extend lo
CryptoNewsLand1u geleden