
**Date: **Wed, Jan 07, 2026 | 06:20 AM GMT
The broader cryptocurrency market continues to show strong New Year momentum, with Bitcoin (BTC) up around 4% and Ethereum (ETH) gaining over 9% on a weekly basis. This improving sentiment is gradually spilling over into major altcoins — including the DePIN-focused token Akash Network (AKT).
AKT has already posted an impressive 20% weekly gain. While this short-term strength has caught traders’ attention, the more important development is unfolding on the higher-timeframe chart. Recent price action suggests a meaningful shift in market structure, hinting that AKT may be transitioning out of a prolonged corrective phase and into the early stages of a bullish continuation.
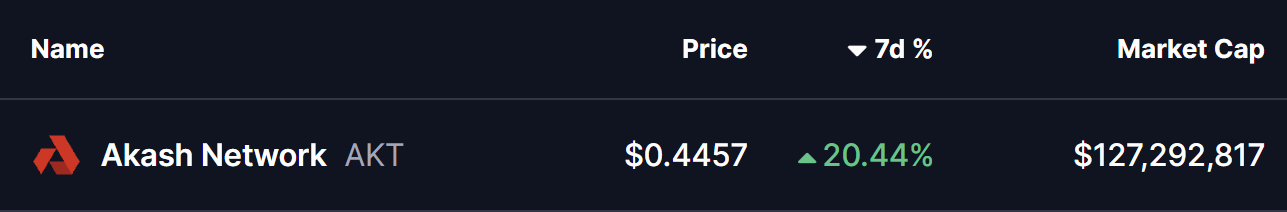
Source: Coinmarketcap
Falling Wedge and Rounding Bottom in Play
On the daily chart, AKT has been trading within a broader falling wedge — a structure that often precedes bullish reversals as selling pressure gradually weakens. Within this larger wedge, price action is also shaping a developing rounding bottom pattern, reflecting steady accumulation and seller exhaustion.
The formation began after AKT faced strong rejection near the $0.5441 resistance zone in late November. That rejection triggered a sharp sell-off, pushing price lower toward the $0.3465 region. However, bears failed to extend losses beyond this area. Instead, demand stepped in, downside momentum slowed, and price began to stabilize.
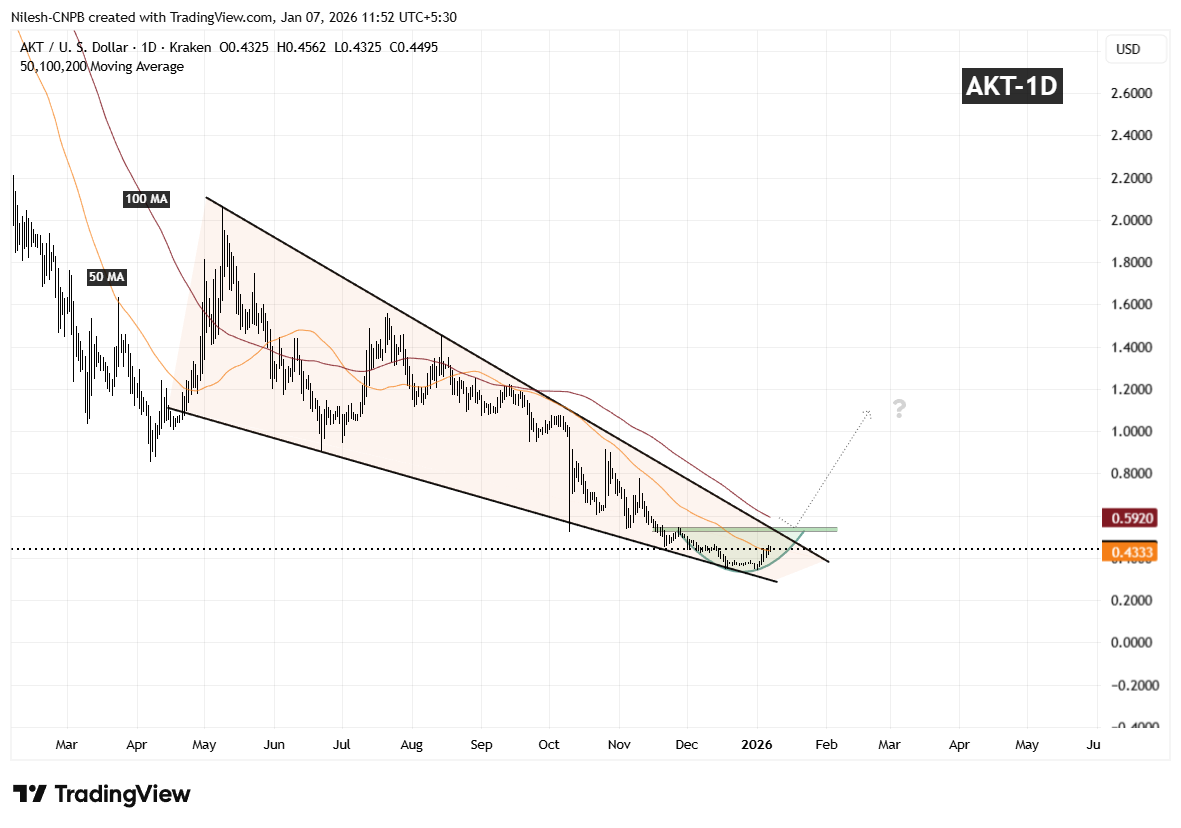
Akash Network (AKT) Daily Chart/Coinsprobe (Source: Tradingview)
Over the following weeks, volatility compressed and AKT started to curl higher in a smooth, rounded fashion — closely matching the textbook behavior of a rounding bottom. Importantly, the recent rebound has pushed price back above the 50-day moving average around $0.4333, a level that had previously acted as resistance and is now beginning to flip into support.
What’s Next for AKT?
If AKT can continue to hold above the 50-day moving average, this area may act as a solid base for further upside attempts. From here, attention shifts toward the descending resistance trendline of the falling wedge, which aligns closely with the $0.5441 resistance zone.
A clean and decisive breakout above this confluence area, followed by sustained acceptance, would confirm a broader bullish expansion phase and mark a clear trend reversal from the prior downtrend. Such a move would likely attract renewed momentum participation as the market recognizes the structural shift.
Until that breakout occurs, the pattern remains in development. Short-term consolidation or shallow pullbacks are still possible as price digests recent gains. However, as long as AKT continues to print higher lows above the established base, the broader technical structure remains constructive.
Overall, the chart suggests AKT is approaching a critical inflection point — one that could determine whether this recovery evolves into a sustained bullish trend as 2026 progresses.
Disclaimer: The views and analysis presented in this article are for informational purposes only and reflect the author’s perspective, not financial advice. Technical patterns and indicators discussed are subject to market volatility and may or may not yield the anticipated results. Investors are advised to exercise caution, conduct independent research, and make decisions aligned with their individual risk tolerance.
About Author: Nilesh Hembade is the Founder and Lead Author of Coinsprobe, with over 5 years of experience in the cryptocurrency and blockchain industry. Since launching Coinsprobe in 2023, he has been providing daily, research-driven insights through in-depth market analysis, on-chain data, and technical research.
Disclaimer: The information on this page may come from third parties and does not represent the views or opinions of Gate. The content displayed on this page is for reference only and does not constitute any financial, investment, or legal advice. Gate does not guarantee the accuracy or completeness of the information and shall not be liable for any losses arising from the use of this information. Virtual asset investments carry high risks and are subject to significant price volatility. You may lose all of your invested principal. Please fully understand the relevant risks and make prudent decisions based on your own financial situation and risk tolerance. For details, please refer to
Disclaimer.
Gerelateerde artikelen
PENGU Holds Key Support as Price Tightens Near Breakout Zone
Key Insights
PENGU maintains stability near $0.010 while forming higher lows, signaling early accumulation as buyers steadily absorb supply during reduced selling pressure phases.
The $0.011 to $0.013 resistance zone remains critical, with a breakout above this range likely unlocking higher
CryptoNewsLand51m geleden
Bitcoin Reaches 67-Day Negative Funding Streak as K33 Flags Short Squeeze Risk
Bitcoin (BTC) traded above $82,000 on Wednesday, reaching its highest level in over three months, while the longest negative funding streak this decade could amplify short squeeze risk, according to research and brokerage firm K33. The 67 consecutive days of negative 30-day average funding rates
CryptoFrontier54m geleden
Bitcoin Spot ETFs Record $1.6B Inflows Over 4 Days
## Spot Bitcoin ETFs Attract $1.6 Billion in Four Days
United States spot Bitcoin (BTC) exchange-traded funds (ETFs) have recorded a net cash inflow of approximately $1.644 billion over four consecutive days through May 5, according to data from SoSoValue. The inflows have increased total Bitcoin h
CryptoFrontier1u geleden
Altcoins Change Trend, Ripple and Solana Are the Only Altcoins Seeing Positive Inflows
Ripple and Solana are the only altcoins seeing positive inflows.
Altcoins change trend, could this lead to a fortuitous altseason pump phase?
XRP and SOL both show bullish indicators for new ATH targets.
The crypto market continues to move in an upward direction this week, allowing the p
CryptoNewsLand1u geleden
Bitcoin Price Continues to Trade Above $80,000, Is It the Right Time to Buy?
Bitcoin price continues to trade above $80,000.
Is it the right time to buy into the crypto market?
Analysts say more patience could deliver higher gains.
The crypto community is thrilled to see the price of Bitcoin (BTC), the pioneer crypto asset, trade above the $80,000 price range. Th
CryptoNewsLand3u geleden
比特币站稳 80,000 美元关口,加密市场恐慌与贪婪指数自 1 月来首回「中性」
比特币站稳 80,000 美元,恐慌与贪婪指数自 1 月来首回中性。分析情绪反转成因、ETF 资金动向及监管进展,解读机构入场逻辑。
GateInstantTrends3u geleden