
The broader cryptocurrency market has been experiencing choppy price action over the past several weeks, a phase that began after the sharp sell-off on October 10. That correction dragged Ethereum (ETH) down by nearly 27% over the last 60 days, keeping sustained pressure on major altcoins, including **Xrp (XRP).**
XRP has declined by more than 25% over the same period, reflecting the broader risk-off environment. However, while price action has remained weak on the surface, the daily chart is now starting to reveal an emerging structure that could set the stage for a recovery attempt if key levels continue to hold.
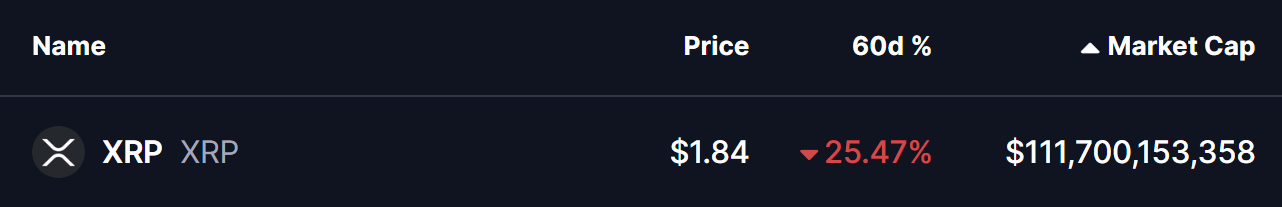
Source: Coinmarketcap
Harmonic Pattern Signals Potential Upside
On the daily timeframe, XRP appears to be forming a Bearish Cypher harmonic pattern — a structure that often produces upside momentum during its final CD leg before price reaches the Potential Reversal Zone (PRZ).
The pattern began at point X near the $2.69 region, where XRP topped out before entering a sharp corrective move. Price then declined into point A, followed by a rebound toward point B near the 0.382 retracement zone. From there, XRP rolled over again and extended lower into point C around $1.77, completing the core structure of the pattern.
Since tagging this level, XRP has started to stabilize and grind higher, now trading near the $1.84 area. This slow recovery suggests selling pressure may be easing, with buyers beginning to defend the recent lows. The shape and proportions of the pattern remain intact, keeping the harmonic setup technically valid for now.
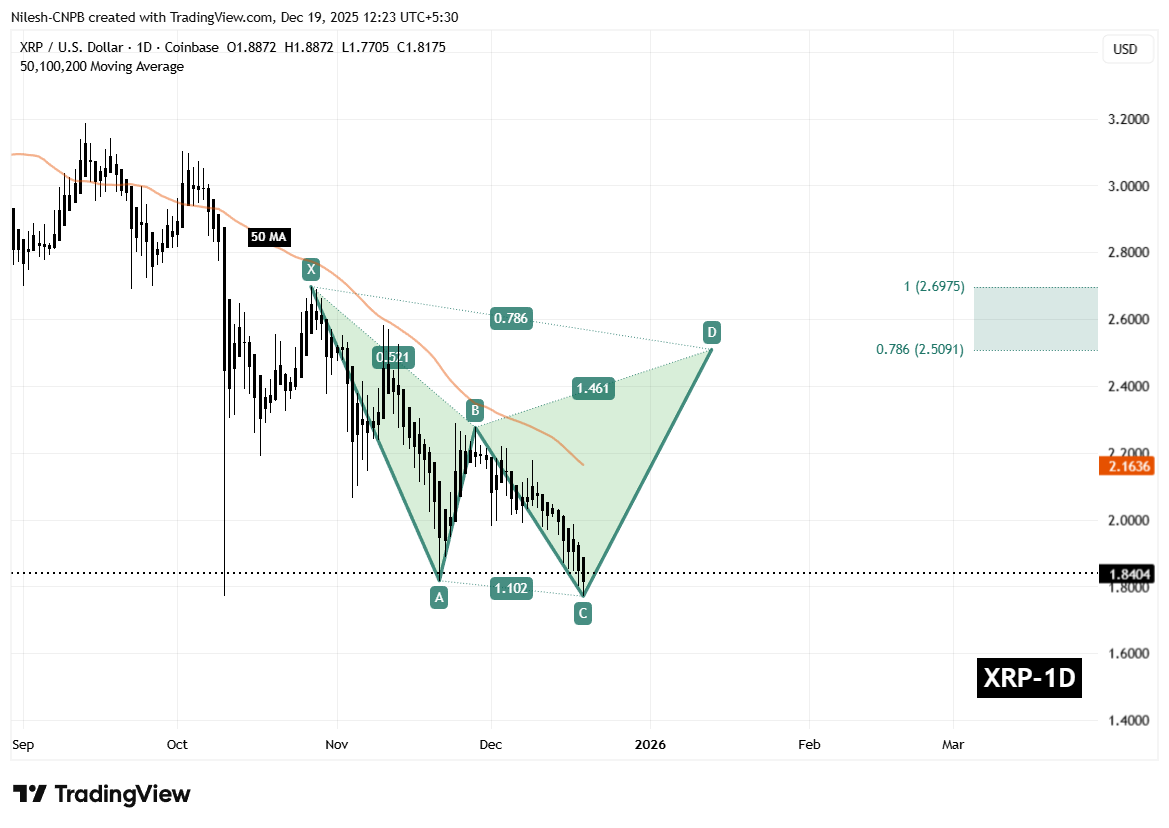
XRP Daily Chart/Coinsprobe (Source: Tradingview)
A key technical factor aligning with this structure is the 50-day moving average, currently positioned near $2.16. This level has consistently acted as dynamic resistance throughout the downtrend and represents an important hurdle for bulls to overcome.
What’s Next for XRP?
In the short term, the most critical level to monitor is the C-leg support around $1.77. As long as XRP holds above this zone, the harmonic pattern remains active and the bullish CD-leg scenario stays in play.
If price continues to build strength from this base, the next major test will be a reclaim of the 50-day moving average near $2.16. A decisive move above this level would signal improving momentum and could accelerate upside continuation.
Based on the harmonic structure, the projected upside targets sit within the Potential Reversal Zone, defined between the 0.786 Fibonacci extension near $2.50 and the 1.0 extension around $2.69. This zone represents the area where the Cypher pattern is expected to complete and where stronger resistance or a pause in the move could emerge.
On the downside, failure to hold above $1.77 would weaken the bullish setup significantly. A breakdown below this support could invalidate the pattern and expose XRP to deeper downside pressure before any sustainable recovery attempt can develop.
For now, the chart suggests XRP is at a technically important juncture. While confirmation is still needed, the presence of a well-formed harmonic structure indicates that a short- to medium-term bounce remains a realistic possibility if buyers can defend current levels and reclaim key resistance zones.
Disclaimer: The views and analysis presented in this article are for informational purposes only and reflect the author’s perspective, not financial advice. Technical patterns and indicators discussed are subject to market volatility and may or may not yield the anticipated results. Investors are advised to exercise caution, conduct independent research, and make decisions aligned with their individual risk tolerance.
Disclaimer: The information on this page may come from third parties and does not represent the views or opinions of Gate. The content displayed on this page is for reference only and does not constitute any financial, investment, or legal advice. Gate does not guarantee the accuracy or completeness of the information and shall not be liable for any losses arising from the use of this information. Virtual asset investments carry high risks and are subject to significant price volatility. You may lose all of your invested principal. Please fully understand the relevant risks and make prudent decisions based on your own financial situation and risk tolerance. For details, please refer to
Disclaimer.
Articoli correlati
Crypto Price Analysis March 27: ETH, XRP, ADA, BNB, and HYPE
This Friday, we examine Ethereum, Ripple, Cardano, Binance Coin, and Hyperliquid in greater detail.
Ethereum (ETH)
--------------
Ethereum is down 4% this week after sellers held strong at the $2,400 resistance and even tested the $2,000 support. Another push, and they could break this key
CryptoPotato39m fa
Bullish XRP Analyst Uses the Fibonacci Division to Expect New ATH Targets at $8, $21, and $27
Bullish XRP analyst uses the Fibonacci Division to expect new ATH targets.
The analyst has set three bullish targets for XRP from $8 to $21 and $27.
These targets have always been in play, which, if hit, could open a path to XRP at $60.
Despite the fact that BTC has sunk below the $70,00
CryptoNewsLand44m fa
XRP Price Prediction: $1.40 Support Holds as Market Awaits Breakout
XRP remains one of the most closely watched altcoins in the crypto market, with price action now centered around the $1.40 zone. This level has emerged as a key short-term inflection point, separating consolidation from potential breakdown. While long-term narratives often focus on ambitious
Blockzeit2h fa
All Zeroes? XRP Ledger Posts Critically Low Values - U.Today
XRP's market is weak
Price and network falling behind
Weak technical structure and dwindling on-chain activity are coming together for XRP, and neither is currently providing any cause for optimism. XRP is still trending lower on the chart, staying capped below the 50 EMA and failing to recover i
UToday2h fa
