$EDGE #CreatorLeaderboard Here’s a complete technical and behavioral analysis.
1. Chart Pattern & Price Trend
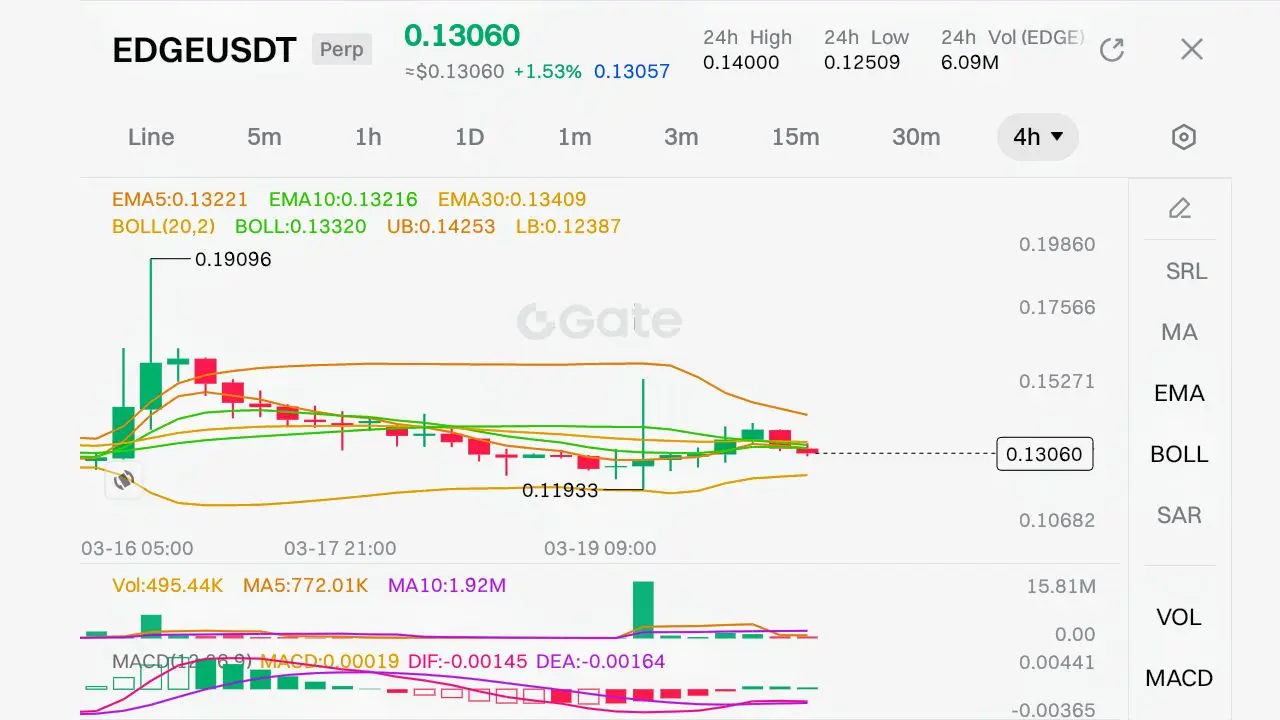
· Current Price: ~0.13060 USDT
· Structure: Price is compressing inside a descending triangle or falling wedge on higher timeframes, with lower highs and a flat support zone (~0.12500–0.12750).
· Lower timeframe (1H): Bollinger Bands are tightening (UB: 0.13203, LB: 0.12941), indicating low volatility and a potential breakout.
· EMA Alignment (5,10,30):
· On the first chart (daily): EMA5 < EMA10 < EMA30 → bearish alignment
· On the second chart (1H): EMAs are nearly flat, suggesti