
Bitcoin pulled back sharply after failing to hold above $70,000, and that rejection has started to ripple across the broader market. XRP price and SOL price followed the same path, with both assets slipping as momentum weakened.
That reaction reveals something important about the current market phase. Buyers still exist, yet conviction fades each time price approaches key resistance.
-
Bitcoin Price Reaction Shows Rejection Near $71,000 And Weak Short-Term Momentum
- BTC Price Prediction for Today
-
XRP Price Structure Shows Lower Highs And Pressure Near $1.40 Resistance
- XRP Price Prediction for Today
-
Solana Price Decline Shows Weak Altcoin Momentum And Slowing Selling Pressure
- SOL Price Prediction for Today
Bitcoin Price Reaction Shows Rejection Near $71,000 And Weak Short-Term Momentum
Bitcoin (BTC) price now trades around $68,600 after dropping close to 2% over the past 24 hours. Price moved between $68,125 and $71,371 during that period. The failed attempt to hold above $70,000 forced a quick reversal, and liquidation data confirms that many short positions got cleared during that move.
| Metric |
| Value |
| — |
| Current Price |
| $68,812 |
| 24H Change |
| -2.83% to -3.12% |
| Weekly High |
| $71,985 |
| Weekly Low |
| $67,372 |
| RSI |
| Around 45 |
| MACD |
| Negative, Histogram Still Bearish |
A broader view of the past week shows BTC losing around 3% its weekly high of $71,985. The weekly low near $67,372 still acts as a nearby support zone. This pullback also ended a short recovery phase that lasted two weeks.
Momentum indicators give a mixed signal. RSI (14) levels near 45 suggest neutral to bearish conditions. MACD remains negative, and the histogram is also still red. That combination shows selling pressure and that a major reversal is not close.
BTC Price Prediction for Today
BTC price today may continue to trade within a narrow band. Price could move between $67,500 and $70,000. A move above $69,500 with strong volume may open a path above $71,000 again.
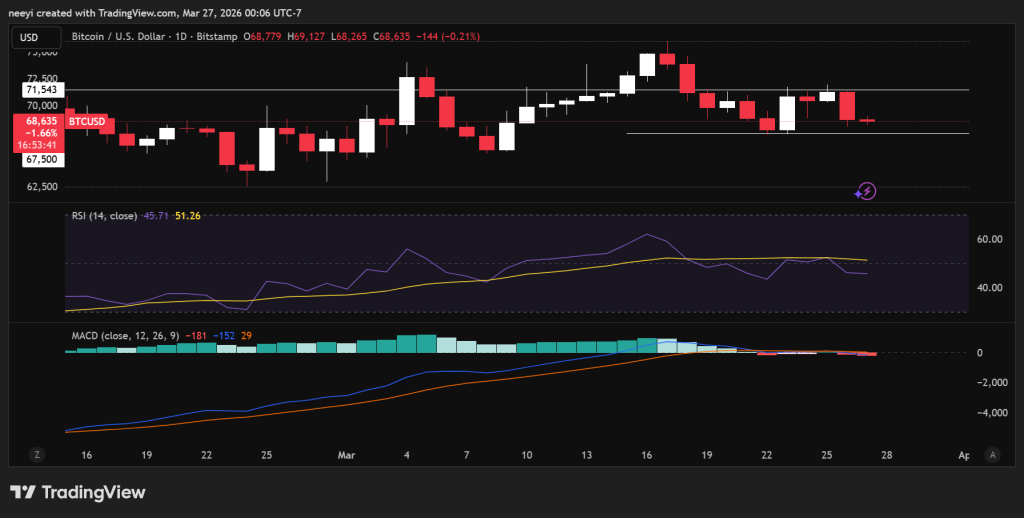
BTC Price Chart / Source: TradingView.com
A break below $67,500 could expose $65,500 to $67,000 if selling pressure increases.
XRP Price Structure Shows Lower Highs And Pressure Near $1.40 Resistance
XRP price continues to trade within a bearish structure, with lower highs and lower lows shaping the chart. Current price sits around $1.36 after losing around 2% over the past 24 hours. The intraday range stayed between $1.34 and $1.41.
| Metric |
| Value |
| — |
| Current Price |
| $1.37 |
| 24H Change |
| -2.22% to -3.89% |
| Weekly High |
| $1.45 |
| Weekly Low |
| $1.34 |
| RSI |
| 41 to 45 |
| MACD |
| Slightly Negative, Histogram Bearish |
The past week adds more context. XRP has dropped around 6%, with price failing to hold above the key $1.40 resistance level. That failure pushed price back toward its weekly low near $1.34.
Momentum remains neutral to slightly weak. RSI at 42 shows no strong oversold condition. MACD still leans negative, with the bearish histogram bar appearing to get longer, showing the current bearish sentiment is slightly strengthening.
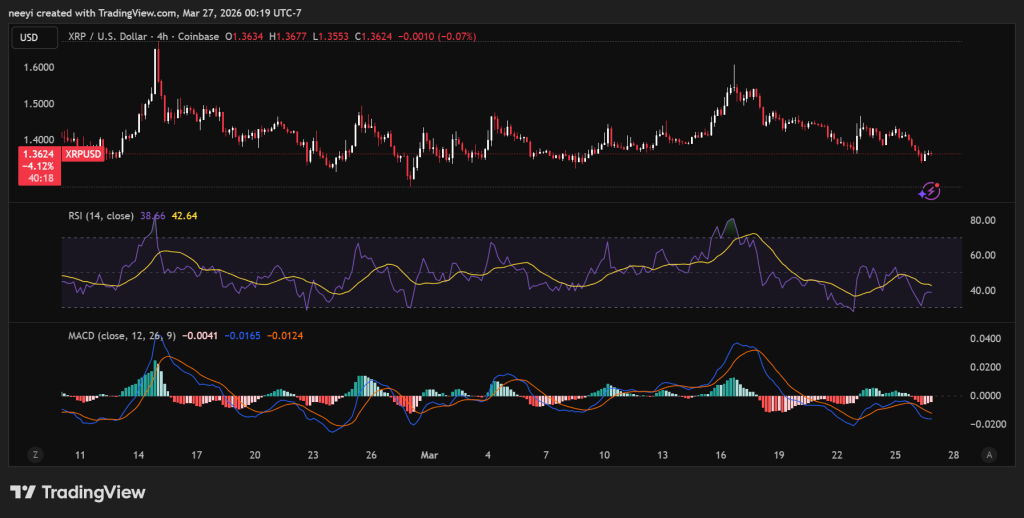
XRP Price Chart / Source: TradingView.com
XRP Price Prediction for Today
XRP price may remain trapped between $1.34 and $1.40 today. Most activity could stay around $1.35 to $1.37 unless a breakout occurs.
A push above $1.40 may lead to a move toward $1.43. A drop below $1.34 could open the door toward $1.31.
Solana Price Decline Shows Weak Altcoin Momentum And Slowing Selling Pressure
Solana (SOL) price trades around $86 after dropping around 3% in the past 24 hours. Price ranged between $85 and $93 during that period. This move places SOL among the weaker large-cap assets in the current market phase.
| Metric |
| Value |
| — |
| Current Price |
| $86.37 |
| 24H Change |
| -6.76% |
| Weekly High |
| $93.32 |
| Weekly Low |
| $85.11 |
| RSI |
| 37 |
| MACD |
| Negative, Histogram Increasingly Bearish |
The weekly picture also shows a decline of around 3%, with a high near $93.32 and a low close to $85.11. A key factor behind this weakness comes from reduced on-chain activity, with DEX volume dropping significantly in recent weeks.
Momentum indicators again show a familiar pattern. RSI (14) levels around 45 point to mild bearish conditions. MACD remains negative and the histogram is showing increasing bearish pressure.
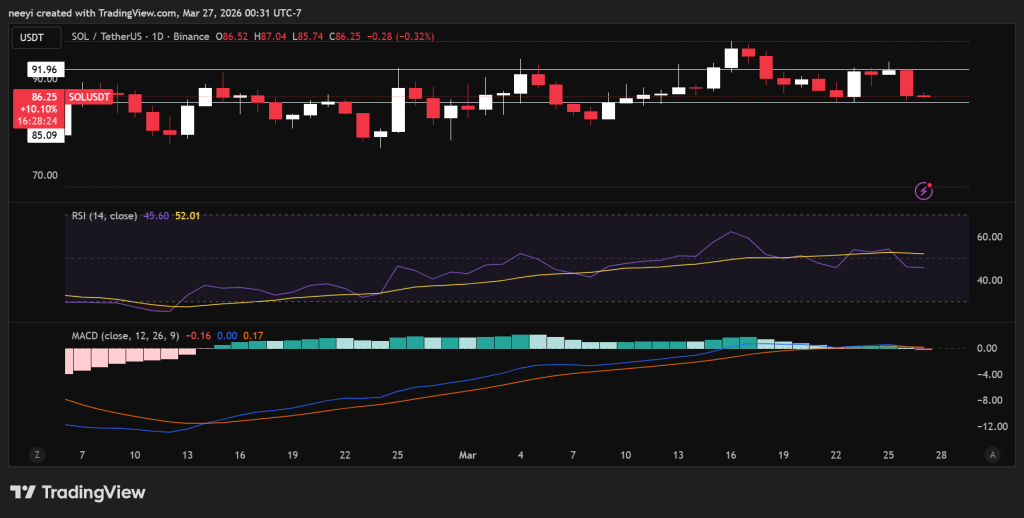
SOL Price Chart / Source: TradingView.com
SOL Price Prediction for Today
SOL price today may move between $84 and $90. A recovery above $89 or $90 could push the price toward $93 again.
A breakdown below $85 may lead to a move into the low $80s if the broader crypto market stays weak.
Disclaimer: The information on this page may come from third parties and does not represent the views or opinions of Gate. The content displayed on this page is for reference only and does not constitute any financial, investment, or legal advice. Gate does not guarantee the accuracy or completeness of the information and shall not be liable for any losses arising from the use of this information. Virtual asset investments carry high risks and are subject to significant price volatility. You may lose all of your invested principal. Please fully understand the relevant risks and make prudent decisions based on your own financial situation and risk tolerance. For details, please refer to
Disclaimer.
