The silver price had another pretty volatile session overnight. The metal briefly dropped to around $81. However, the dip didn’t last long. Buyers stepped in quickly, pushing silver back above $84 by the morning, which just shows that demand is still present near key support levels.
The sudden drop and rebound came without any major macro news, which left traders focusing mostly on technical structure. One silver chart that looks interesting came from an account called Economic Office on X. The account is still relatively unknown, but the analysis they shared created interest because it frames the current silver move within a larger Elliott Wave structure that could define where prices go next.
Silver Price Analysis: Elliott Wave Structure Points to a Large Consolidation Phase
In the chart shared by Economic Office, silver’s explosive rally toward $121 earlier this year is labeled as the completion of Wave 3 in a broader bullish cycle. After such a strong impulsive move, the analyst believes the market has now transitioned into Wave 4, which typically appears as a corrective consolidation.
According to their model, silver is currently forming a triangle pattern, which is common during fourth-wave corrections. The structure shows several sub-waves labeled (a), (b), ©, (d), and (e) gradually compressing price action between rising support and descending resistance lines.
The recent rejection from the $96 area is marked as Wave (b), and the ongoing decline toward the lower boundary of the triangle is labeled as Wave ©. If this interpretation is correct, silver could continue moving sideways inside this narrowing range for some time as volatility compresses.
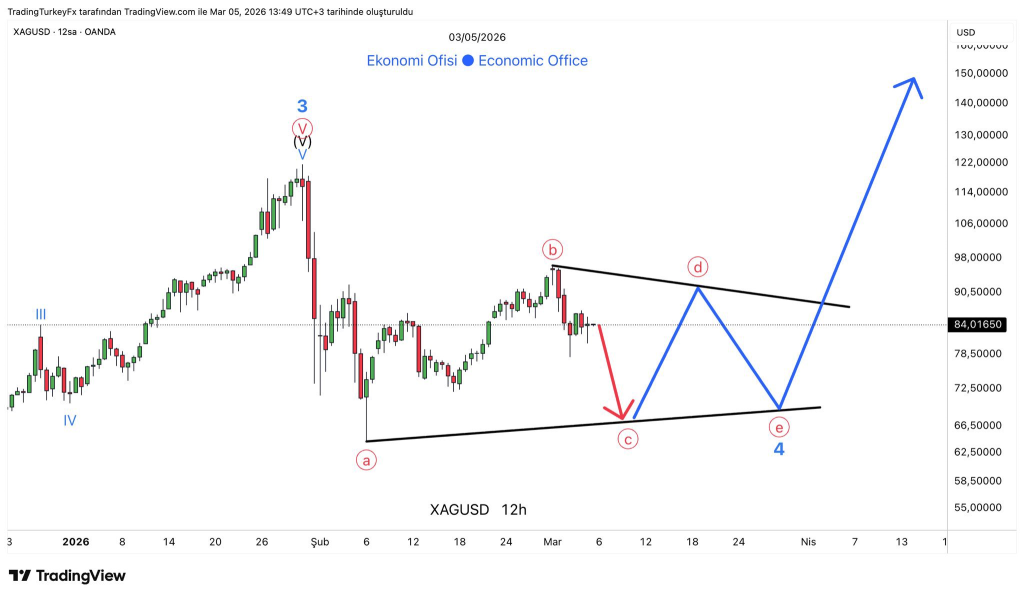
Source: X/@Economic_Office
This kind of structure often frustrates traders because it produces choppy price action with multiple fake breakouts before the real move begins. In other words, the current environment may remain unstable until the triangle pattern fully matures.
Silver Price Prediction: The Long-Term Target: $150 and Beyond
Despite the near-term uncertainty, the bigger message in the silver chart is clearly bullish. The analyst argues that as long as the $64–$67 zone holds, the larger bullish structure remains intact.
That level represents the lower boundary of the triangle and a critical support area. If silver stays above it, the consolidation could simply be a pause before the next major impulsive move.
Once the triangle pattern completes, the chart suggests Wave 5 could begin. In Elliott Wave theory, the fifth wave often drives price toward a final expansion phase before the broader cycle ends.
Economic Office places the potential target for that next leg above $150, which would represent a massive continuation of the long-term bull trend in silver.
For now, however, the analyst warns that the structure is not finished yet. Entering too early inside a triangle formation can expose traders to sudden swings in both directions.
Until the pattern completes and a breakout becomes clearer, the silver price may remain stuck in a volatile
Read also: ChatGPT Predicts The Price Of Bitcoin And Silver If U.S. And Iran Agree To End The War
Disclaimer: The information on this page may come from third parties and does not represent the views or opinions of Gate. The content displayed on this page is for reference only and does not constitute any financial, investment, or legal advice. Gate does not guarantee the accuracy or completeness of the information and shall not be liable for any losses arising from the use of this information. Virtual asset investments carry high risks and are subject to significant price volatility. You may lose all of your invested principal. Please fully understand the relevant risks and make prudent decisions based on your own financial situation and risk tolerance. For details, please refer to
Disclaimer.
