比特coins Marktkapitalisierung hat die 2,1 Billionen US-Dollar Marke überschritten. Hinter jeder heftigen Volatilität im Jahr 2025 stehen stille Veränderungen bei Sicherheiten, Basis und ETF-Fondsflüssen. Finanzierungssätze, Margin-Discounter und Spot-ETF-Hedging haben heute denselben Einfluss auf den Bitcoin-Preis wie jede makroökonomische Nachricht. Das Marktumfeld im Oktober hat diese Zusammenhänge hervorgehoben: Zwischen dem 10. und 11. Oktober wurden etwa 19 Milliarden US-Dollar an Positionen liquidiert.
Faktor 1: ETF-Fondsflüsse werden zur treibenden Kraft des Preises
Die Volatilität des Bitcoin-Preises im Jahr 2025 wird zunehmend von ETF- und ETP-Fondsflüssen beeinflusst. Im Oktober schwankten die ETF-Fondsflüsse stark: Von Rekordzuflüssen zu Abflüssen und wieder zu Zuflüssen, was wiederum die Spotbestände und die Absicherungsflüsse der Händler beeinflusste. CoinShares berichtet, dass in der Woche bis zum 4. Oktober 59,5 Milliarden US-Dollar an Kapital zuflossen; in der Woche bis zum 20. Oktober flossen 513 Millionen US-Dollar ab; und in der Woche bis zum 27. Oktober flossen 921 Millionen US-Dollar wieder zu. Innerhalb weniger Tage änderten sich dadurch die Hedging-Anforderungen der Händler und die Spot-Kurse.
Doch diese Trendwende im Oktober wurde erneut umgekehrt. Anfang November verzeichneten digitale Vermögensfonds wieder Nettoabflüsse, wobei der Bitcoin-ETF fast 10 Milliarden US-Dollar verlustierte. Dies unterstreicht, wie schnell ETF-Hedging-Fondsflüsse sich verändern können. Bei positiven Flüssen und großem Basis besteht die Gefahr, dass Arbitrage-Händler mit ETF-Emittenten um Token-Quellen konkurrieren, was die Börsenguthaben verringert. Bei Umkehr der Flüsse oder negativen Kapitalströmen steigen die Liquidationen, erhöhen die Reserven und drücken den Bitcoin-Preis in Richtung Liquidationscluster.
Der Handel mit ETPs und ETFs ist entscheidend für die Bitcoin-Entwicklung im Jahr 2025. Bei positiven Flüssen und großem Basis konkurrieren Arbitrageure mit ETF-Emittenten um Token, was die Börsenguthaben reduziert. Bei Flussumkehr steigen die Liquidationen, was den Preis in Richtung Liquidationscluster treibt. Dieses Mechanismus zeigte sich im Oktober besonders deutlich: Die Richtungsänderung der Flüsse innerhalb weniger Tage führte zu einer kompletten Umkehrung der Marktstruktur.
Für Bitcoin-Investoren ist die Beobachtung der ETF-Fondsflüsse heute wichtiger als technische Indikatoren. Wenn eine Woche mehr als 3 Milliarden US-Dollar zufließen, deutet dies oft auf einen bevorstehenden Preisanstieg in den nächsten Tagen hin. Umgekehrt signalisieren zwei aufeinanderfolgende Wochen mit Abflüssen von mehr als 1 Milliarde US-Dollar einen kurzfristigen Top. Ob Bitcoin 2025 höhere Niveaus erreicht, hängt stark davon ab, ob die ETF-Zuflüsse anhalten.
Faktor 2: Basis-Trade und Finanzierungssätze bestimmen Arbitragemöglichkeiten
Der Basis-Trade ist zentral für das Verständnis der Bitcoin-Preisschwankungen. Wenn Perpetual- oder Futures-Preise überhöht sind, kaufen Arbitrageure Spot-Bitcoin und verkaufen Perpetuals oder Futures, um die Spanne zu sichern. Dies führt dazu, dass Kryptowährungen von Börsen abgezogen werden, die Liquidität sinkt und die Cash-Reserven steigen. Bei negativen Zinsen und schmaler Basis verkaufen sie Spot und schließen Short-Positionen bei Perpetuals, was die Bestände an den Börsen erhöht und den Preis drückt.
Ende Oktober lag die mittlere Jahresbasis für März-Bitcoin-Futures bei etwa 6-6,5 %, deutlich über den dreimonatigen US-Staatsanleihen. Danach schwächte sich dieser Aufwärtstrend ab: Die Basis für März liegt jetzt bei etwa 5 %, nur noch 150-200 Basispunkte über den Staatsanleihen. Solange die Kreditkosten kontrolliert werden und die Margin-Discounter stabil bleiben, ist die Teilnahme an Arbitrage-Strategien weiterhin möglich.
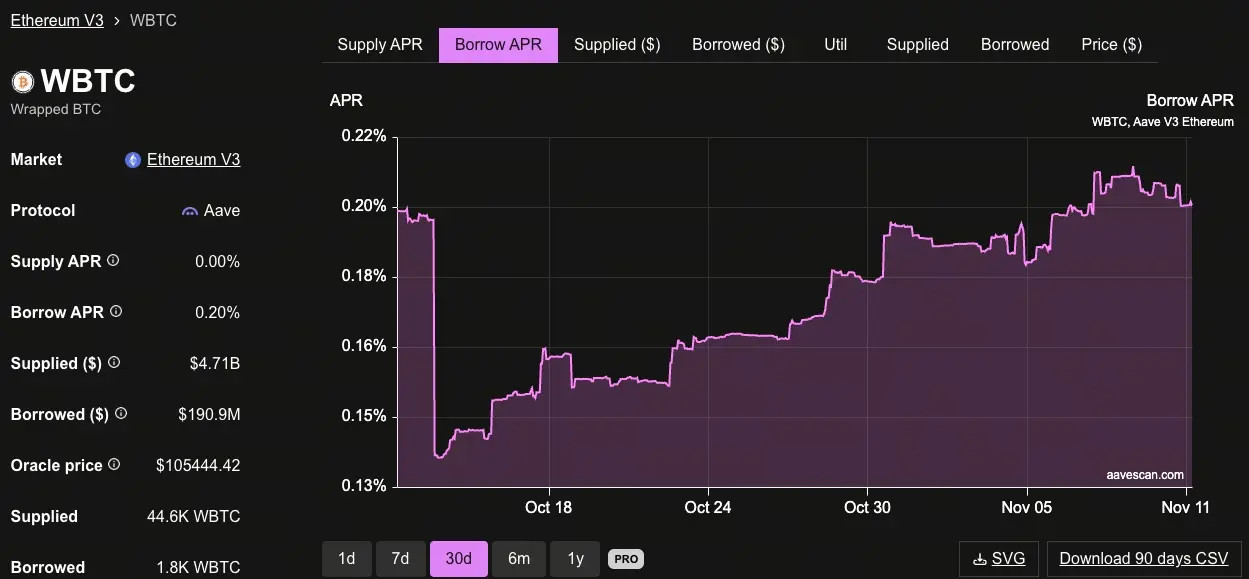
Finanzierungskosten und Discounter bestimmen, wie hoch das Hebelniveau im Spread sein kann. In DeFi sind die Kreditkosten in einigen Bereichen noch niedrig: Laut Aavescan liegt der Leihzins für Aave v3 WBTC bei etwa 0,2 %, mit niedriger Auslastung. Bei zentralisierten Plattformen variieren Margin-Kreditzinsen für Bitcoin und Stablecoins stark, was die Nettoerträge beeinflusst.
Ein einfaches delta-neutrales Beispiel: Der Nettoertrag entspricht den jährlichen Kosten minus Finanzierung, Gebühren und Slippage, abzüglich der Kreditkosten. Bei einem mittleren Zinssatz von 6,3 % und einem Zins von 3,8 % ergibt sich vor Abzügen eine ungefähre Buchrendite von 2,5 %. Wenn Händler mit Stablecoins auf Börsen finanzieren und Zinsen zwischen 3 % und 6 % zahlen, gleichen die Gebühren den Spread oft aus, was den Gewinn nahezu null oder sogar negativ macht.
Laut ApeX entspricht die 8-Stunden-Finanzierung bei Perpetuals multipliziert mit 3 und 365, ergibt eine jährliche Rendite von etwa 11 % bei einem Zinssatz von 0,01 % für 8 Stunden. Eine annualisierte Rendite über 8 % bei längerfristigen Anleihen lockt oft neue Absicherungsnachfrage, was die Spot-Nachfrage nach Bitcoin antreibt.
Faktor 3: Sicherheiten-Setups und Liquidationsmechanismen – Kettenreaktionen
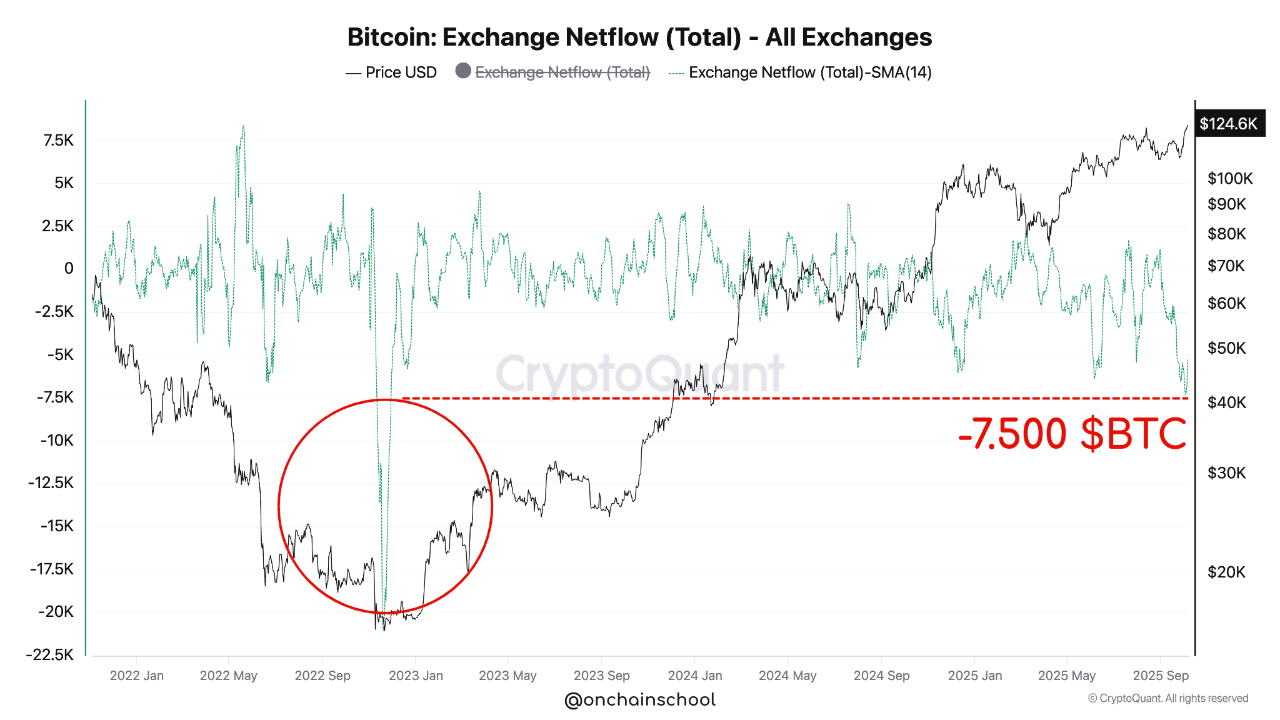
(Quelle: CryptoQuant)
Die Sicherheiten-Setups bei Futures und Leihplattformen beeinflussen den Spot-Preis durch forcierte Hedging- und Liquidationsmechanismen. Der Markt im Oktober hat diese Zusammenhänge erneut verdeutlicht: Zwischen dem 10. und 11. Oktober wurden rund 19 Milliarden US-Dollar an Positionen liquidiert, nachdem Kapital- und Basisdruck wieder neu eingestellt wurden. Seit Mitte September haben Börsen auch die Kreditformeln und Sicherheitenparameter angepasst, was die Arbitrage-Renditen und Liquidationsschwellen verändert hat.
Sicherheiten-Discounter und Leverage stehen in direktem Zusammenhang. Wenn der effektive Leverage proportional zu Anfangssicherung und Sicherheiten-Discounter ist, führen 5-10 % Discounter zu einer Reduktion des verfügbaren Hebels um 10-20 % und erhöhen das Liquidationsrisiko. Selbst bei unveränderten Bitcoin-Preisen zwingt dies Kapital in die Risikovermeidung.
Liquidationen und Versicherungspools beschleunigen den Prozess. Die Berechnung der Margin kann Händler bei hohem Hebel durch kleine Schwankungen zum Ausstieg zwingen. Versicherungspools absorbieren Verluste bis zu einem festgelegten Limit. Im Jahr 2023 nutzte dYdX rund 9 Millionen US-Dollar aus seinem v3-Versicherungspool, um Verluste im YFI-Markt aufzufangen – es blieb noch Restkapazität. Diese Puffermaßnahmen dämpfen, anstatt die Hebelwirkung vollständig zu eliminieren.
CryptoQuant zeigt, dass die Netto-Fondsflüsse an Börsen auf einem Dreijahres-Tief sind, mit anhaltendem Abfluss, der die Börsenreserven im Oktober auf ein Mehrjahrestief sinken ließ. Wenn die Basis Kryptowährungen aus den Börsen zieht und diese Flüsse umkehren, verringert sich das verfügbare Angebot. Erste Kaiko-Analysen zeigen, dass 1 % der Markttiefe bei Bitcoin etwa 5 Millionen US-Dollar beträgt, was ein nützlicher Indikator ist, um zu sehen, wie eine 10-Milliarden-Dollar-Basis die Spot-Preise innerhalb eines Tages über mehrere Preisbereiche hinweg beeinflusst.
Drei Wege für Bitcoin im Jahr 2025 und drei sofortige Indikatoren
In den kommenden Wochen sind drei Szenarien entscheidend für die Bitcoin-Entwicklung:
Weg 1: Basis-Expansion treibt den Aufwärtstrend Wenn die Basis mehrere Tage hintereinander auf 8-12 % wächst, erhöhen Arbitrageure typischerweise ihre Spot-Long-Positionen und CME-Futures-Shorts, was die Lieferungen reduziert und die positiven Flüsse aufrechterhält. In diesem Szenario steigt der Bitcoin-Preis weiter.
Weg 2: Basis-Kompression löst Korrektur aus Wenn die Basis auf 3 % oder weniger sinkt und ETF-Fondsflüsse innerhalb weniger Tage negativ werden, führen Liquidationen dazu, dass Spot-Angebote auf die Börsen zurückkehren und die Margin-Regionen belasten. Dies löst eine Preiskorrektur aus.
Weg 3: Anpassungen bei Sicherheiten und Deleveraging Auch ohne makroökonomische Veränderungen können Margin-Reduktionen oder Portfolio-Anpassungen die Risiken schneller senken, da fallende Sicherheitenwerte den effektiven Hebel verringern und Liquidationen in den gleichen Preisregionen auslösen.
Drei Sofort-Indikatoren für die nächsten Schritte bei Bitcoin
Jahresrendite-Index: Über 8 % bei längerfristigen Anleihen, die mehrere Tage anhalten, ziehen oft neue Absicherungsnachfragen an.
Negativ-Fonds-Index: Massive negative Kapitalflüsse bei Hauptakteuren auf CoinGlass korrespondieren mit Spot-Verkäufen und Wiederaufbau der Reserven.
Sicherheiten-Änderungs-Index: Beiträge von Krypto-Exchanges zu Sicherheitenquoten oder Portfolio-Margin-Änderungen können Frühwarnsignale für Leverage-Beschränkungen liefern.
Disclaimer: The information on this page may come from third parties and does not represent the views or opinions of Gate. The content displayed on this page is for reference only and does not constitute any financial, investment, or legal advice. Gate does not guarantee the accuracy or completeness of the information and shall not be liable for any losses arising from the use of this information. Virtual asset investments carry high risks and are subject to significant price volatility. You may lose all of your invested principal. Please fully understand the relevant risks and make prudent decisions based on your own financial situation and risk tolerance. For details, please refer to
Disclaimer.
Verwandte Artikel
Aktuelle Entwicklungen zur Lage im Iran: Eskalation der Kontrolle über die Straße von Hormus, Bitcoin konsolidiert nahe 77.000 US-Dollar
25. April erhöhte der Iran erneut die Kontrolle über die Verwaltung im Ärmelkanal/über die Straße von Hormus; der Bitcoin pendelt um 77.500 USD, Gold notiert bei 4.709 USD, Rohöl der Sorte Brent liegt über 106 USD. Das geopolitische Auf und Ab flammt erneut auf – wie verknüpfen sich die drei Vermögenswerte miteinander?
GateInstantTrends1Std her
Michael Saylor:Der Krypto-Winter ist vorbei, institutionelle und staatliche Akzeptanz könnten den nächsten Aufschwung antreiben
Gate-News-Mitteilung, 25. April — Michael Saylor, Mitgründer von MicroStrategy, sagte „Der Winter ist vorbei“, als Bitcoin auf ungefähr $78.000 stieg und damit auf eine Veränderung der Marktrichtung hinwies.
Laut Analyst Mati Greenspan seien die jüngsten Marktentwicklungen seit dem Flash-Crash Korrekturen innerhalb eines breiteren Bullenmarkts gewesen, wobei der Boden bei Bitcoin nun gesetzt sei.
GateNews4Std her
SHIB-Reserven erreichen 61,8 Bio. angesichts gemischter Signale für Verkaufsdruck und Akkumulation
Gate News-Meldung, 25. April — Die On-Chain-Kennzahlen von Shiba Inu zeigen auseinanderlaufende Marktkräfte, da die SHIB-Reserven eines großen CEX auf 61,8 Billionen Tokens stiegen, während gleichzeitig etwa 86 Milliarden SHIB aus Börsen abflossen. Daten von CryptoQuant zeigen, dass der Anstieg der Reserven etwa Mitte März begann und
GateNews4Std her
SHIB steht kurz vor einem Ausbruchspunkt, nachdem es eine starke Unterstützungszone erneut getestet hat
SHIB besucht erneut eine wichtige Unterstützungszone, die zuvor große Kursrallyes ausgelöst hat.
Preiskompression- und Akkumulationssignale deuten auf einen möglichen Ausbruch in der Zukunft hin.
Analysten erwarten ein starkes Aufwärtspotenzial, obwohl die Marktbedingungen extreme Gewinne begrenzen könnten.
Shiba Inu ist zu einem Preisniveau zurückgekehrt, das auf
CryptoNewsLand8Std her
PEPE-Preisprognose: Der Fall für einen überraschenden „Unglaubens-Rallye“ voraus
PEPE zeigt eine schwache Sentiment-Lage bei fallendem Preis, Volumen und Open Interest.
Eine starke Short-Bias könnte einen überraschenden Rallye-Ausbruch über Liquidations-Cluster auslösen.
Eine seitwärts tendierende Kursbewegung deutet auf einen möglichen Trap hin, bevor es mit dem bärischen Trend weitergeht.
PepeCoin — PEPE hat erneut einen Rückschlag erlitten, und das Sentiment
CryptoNewsLand9Std her
Crypto Fear and Greed Index fällt auf 30 und signalisiert einen Panikzustand
Gate-News-Meldung, 25. April — Der Crypto Fear and Greed Index liegt derzeit bei 30, ist laut Coinglass-Daten um 8 Punkte gegenüber gestern gesunken. Der Sieben-Tage-Durchschnitt liegt bei 33, während der 30-Tage-Durchschnitt bei 18 liegt, was auf eine Verschiebung hin zu Panikstimmung auf dem
GateNews10Std her