- November, DUSK-Preis setzt den starken Aufwärtstrend fort, der Handelspreis durchbricht 0,078 USD, bisher in dieser Woche über 60 % gestiegen. On-Chain-Daten zeigen, dass die Anzahl der täglich aktiven Adressen von 59 am Montag auf 312 am Freitag sprunghaft angestiegen ist, eine Verfünffachung und den höchsten Stand seit 20 Monaten, was auf ein erneutes Interesse der Investoren hindeutet.
On-Chain-Datenexplosion: Aktive Adressen auf 20-Monats-Hoch
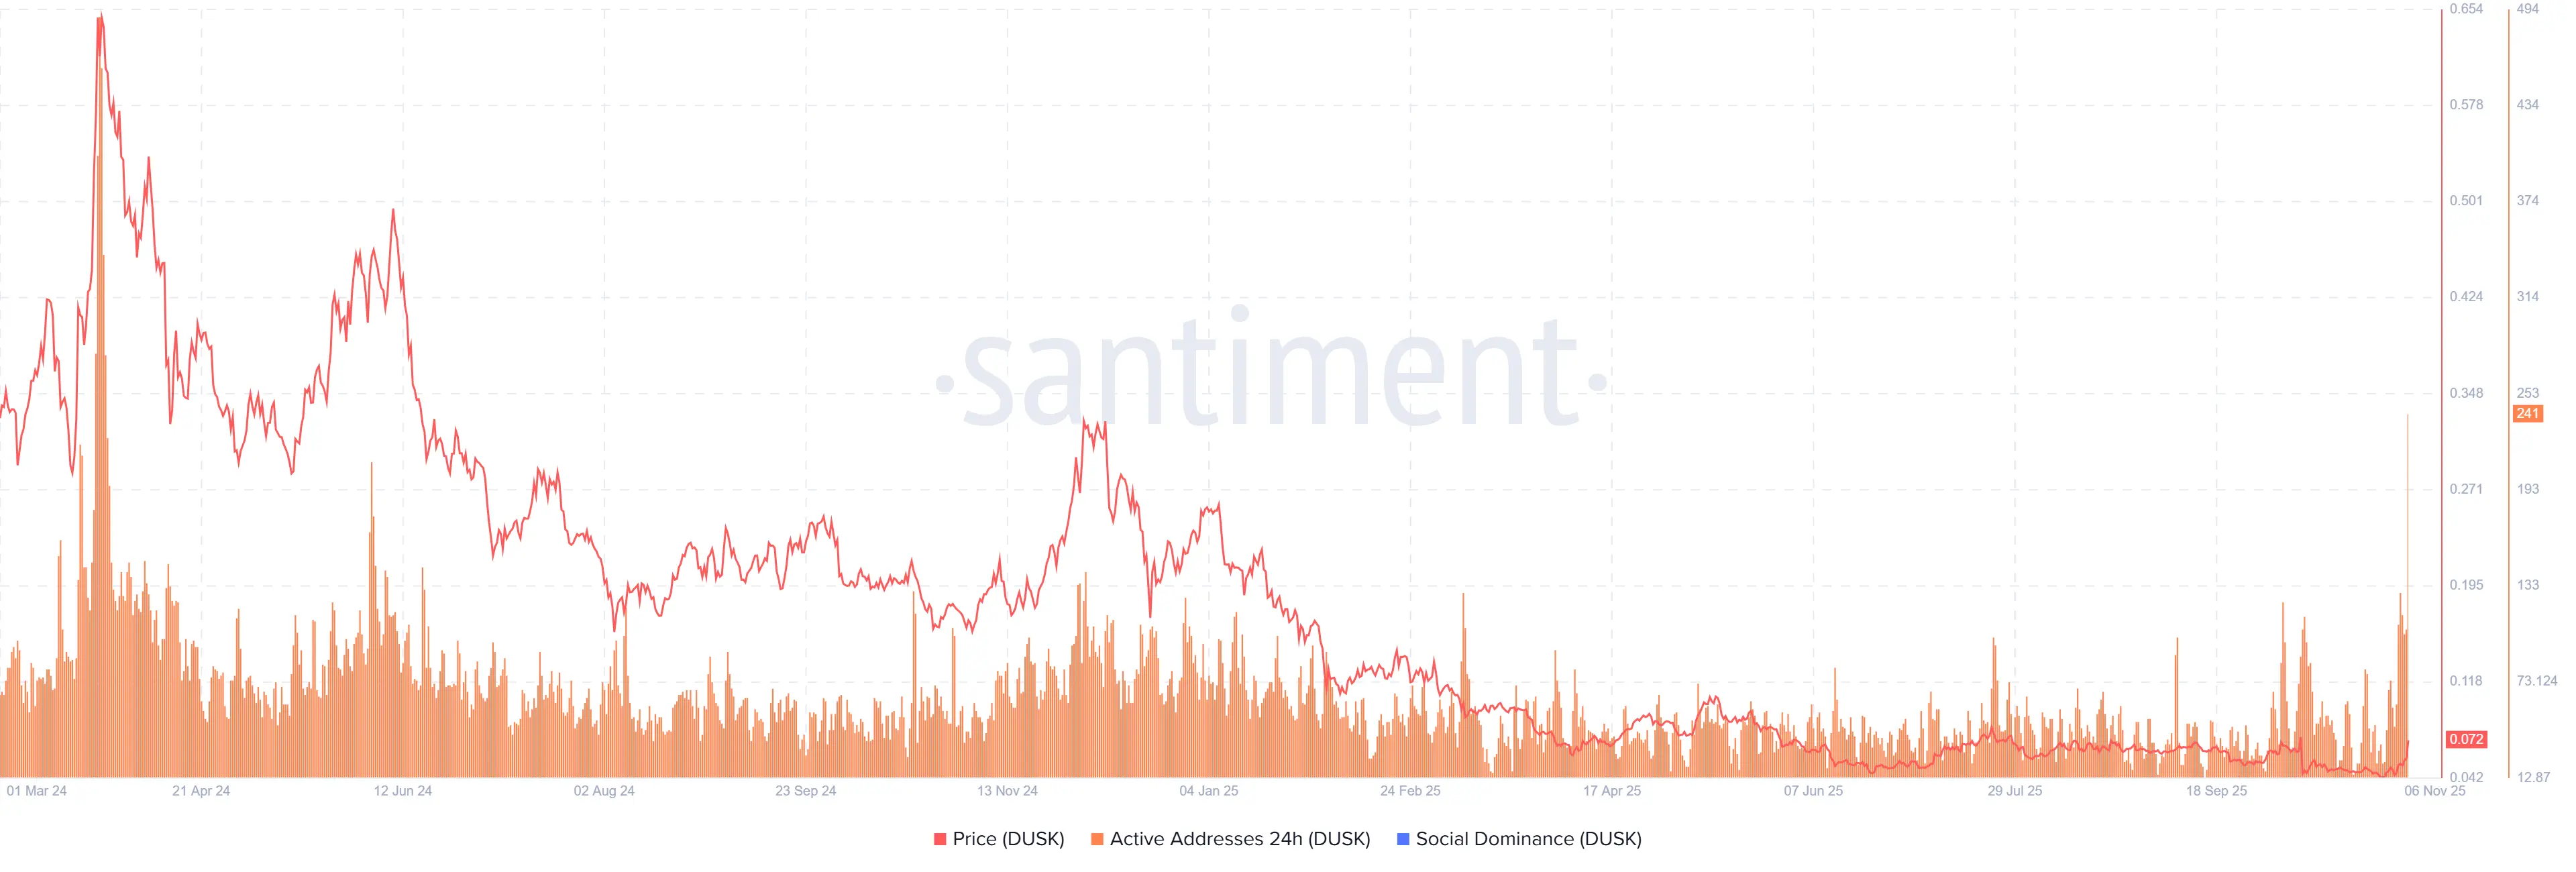
(Quelle: Santiment)
Der tägliche aktive Adressindex von Santiment verfolgt die Veränderungen der Netzwerkaktivität im Zeitverlauf und zeigt eine positive Perspektive für DUSK. Ein Anstieg dieses Indikators deutet auf eine zunehmende Nutzung der Blockchain hin, während ein Rückgang der Adressen auf eine geringere Nachfrage im Netzwerk hinweist. Beim Beispiel DUSK stiegen die täglichen aktiven Adressen von 59 am Montag auf 312 am Freitag, den höchsten Stand seit März 2024.
Dieser Fünffach-Anstieg zeigt, dass die Nachfrage nach DUSK-Blockchain-Anwendungen rapide wächst, was ein äußerst positives Signal für die Preisprognose ist. Tägliche aktive Adressen sind eine zentrale Kennzahl zur Messung der Gesundheit einer Blockchain, da sie die tatsächliche Nutzerzahl widerspiegeln. Wenn die aktiven Adressen sprunghaft ansteigen, bedeutet dies, dass mehr Nutzer Transaktionen durchführen, Smart Contracts deployen oder DeFi-Anwendungen nutzen. Diese echte Nachfrage bildet eine solide Grundlage für Preissteigerungen.
Noch wichtiger ist, dass 312 aktive Adressen den höchsten Stand seit 20 Monaten darstellen, was bedeutet, dass die Aktivität im DUSK-Netzwerk wieder auf das Niveau des Bullenmarkts im März 2024 gestiegen ist. Diese Phase war geprägt von einer starken Gesamtmarktperformance im Kryptobereich. Das erneute Erreichen dieses Niveaus deutet auf eine mögliche neue Aufwärtswelle hin. Historisch gesehen kündigen Höchststände bei On-Chain-Aktivität oft eine Fortsetzung des Preisanstiegs in den kommenden Wochen an.
Santiment-Daten zeigen außerdem, dass der Netzwerk-Wachstumsindex von DUSK von 13 am Montag auf 95 am Donnerstag gestiegen ist, den höchsten Wert seit März 2024. Dieser Index verfolgt die Akzeptanz der Nutzer und den Fortschritt des Projekts und spiegelt die Expansionsgeschwindigkeit des DUSK-Ökosystems wider. Obwohl der Index am Freitag bei etwa 32 stabil blieb, unterstreicht der Höchststand die insgesamt optimistische Perspektive für DUSK.
Der explosive Anstieg des Netzwerk-Wachstumsindex in Verbindung mit dem Anstieg der aktiven Adressen bestätigt die positive Entwicklung. Wenn neue Nutzer in großer Zahl hinzukommen und bestehende Nutzer aktiv bleiben, entfaltet sich ein Netzwerkeffekt: Jeder zusätzliche Nutzer schafft Mehrwert für die bestehenden, was wiederum neue Nutzer anzieht und einen positiven Kreislauf in Gang setzt. Dieser Netzwerkeffekt ist eine der wichtigsten langfristigen Unterstützungen für die Preisentwicklung von DUSK.
Starke Unterstützung im Derivatemarkt: Open Interest steigt um 124 %
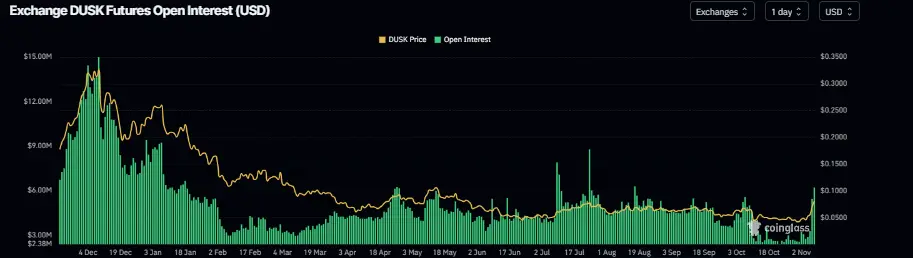
(Quelle: Coinglass)
Die Derivatemarkt-Daten deuten auf eine mögliche weitere Aufwärtsbewegung von DUSK hin. CoinGlass zeigt, dass das Open Interest für DUSK-Futures an Börsen von 2,77 Mio. USD am Montag auf 6,21 Mio. USD am Freitag gestiegen ist, ein Zuwachs von 124 %, was den höchsten Stand seit dem 18. August darstellt.
Der Anstieg des Open Interest bedeutet, dass neues Kapital oder zusätzliche Gelder in den Markt fließen, was den aktuellen Aufwärtstrend bei DUSK antreibt. Open Interest umfasst den Gesamtwert aller ungeklärten Futures-Kontrakte. Ein Anstieg kann zwei Bedeutungen haben: Erstens, dass neue Long-Positionen eröffnet werden, was bullish ist; zweitens, dass neue Short-Positionen aufgebaut werden, was auf eine Korrektur hindeuten könnte. Angesichts des Wochenanstiegs von über 60 % bei DUSK ist die erste Interpretation wahrscheinlicher, also dass die Käufer dominieren und Kapital in den Markt fließt.
Obwohl 6,21 Mio. USD im Vergleich zum Gesamtmarkt nicht enorm erscheinen, ist dies für ein mittelgroßes Projekt wie DUSK beachtlich. Besonders die schnelle Steigerung innerhalb einer Woche von 2,77 Mio. USD auf 6,21 Mio. USD deutet auf bedeutende Narrative oder fundamentale Veränderungen hin. Investoren sollten auf Ankündigungen zu Partnerschaften, technischen Upgrades oder Ecosystem-Erweiterungen achten.
Historisch gesehen erreichte das Open Interest am 18. August seinen Höchststand, gefolgt von einer Korrektur. Das erneute Erreichen dieses Niveaus, zusammen mit den Höchstständen bei On-Chain-Aktivität, erhöht die Wahrscheinlichkeit eines Durchbruchs über frühere Hochs. Die gestiegene Derivatemarkt-Teilnahme verbessert zudem die Liquidität, was größere Transaktionen mit geringeren Slippage ermöglicht und institutionellen Investoren den Einstieg erleichtert.
Technische Analyse: RSI überkauft, aber starke Dynamik
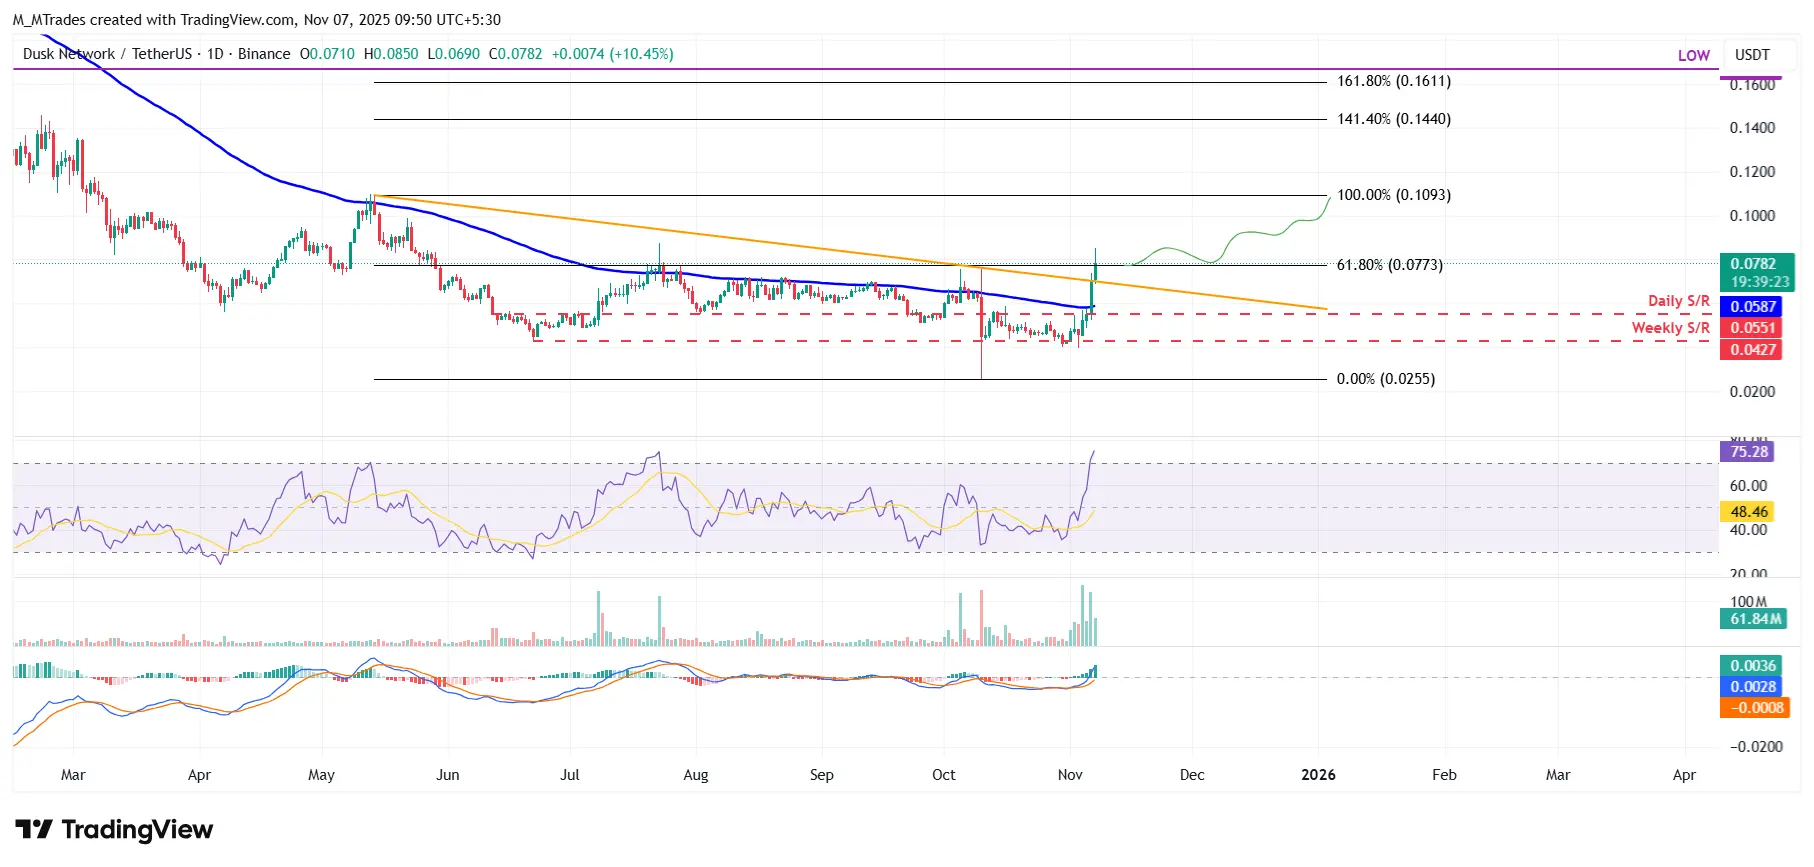
(Quelle: Trading View)
Der DUSK-Preis fand am Montag bei etwa 0,042 USD Unterstützung im Wochenchart und stieg in den folgenden drei Tagen um über 50 %, wobei er am Donnerstag über dem Widerstand bei 0,055 USD schloss. Bis Freitag stieg der Kurs weiter um 10 % und pendelte um 0,078 USD. Wenn DUSK den Aufwärtstrend fortsetzt und den Schlusskurs über 0,077 USD, dem 61,8 %-Fibonacci-Retracement, hält, könnte die Rally bis zur wichtigen psychologischen Marke bei 0,10 USD andauern.
0,077 USD ist eine entscheidende Fibonacci-Retracement-Stufe, die eine frühere Unterstützung in Widerstand umwandelt. Das 61,8 %-Niveau gilt als „Goldener Schnitt“ und ist eine der wichtigsten Retracement-Linien in der technischen Analyse. Das Überschreiten dieses Niveaus und das Halten im Tagesabschluss würde die Trendfortsetzung bestätigen und den Weg zu 0,10 USD ebnen.
0,10 USD ist nicht nur eine runde Zahl, sondern auch eine psychologisch bedeutende Marke. Im Kryptomarkt reagieren Preise oft auf solche Level, da dort häufig Orders konzentriert sind. Der Abstand von 0,078 USD zu 0,10 USD entspricht etwa 28 % Aufwärtspotenzial, was angesichts des Wochenanstiegs von 60 % bei DUSK durchaus realistisch ist.
Wichtige technische Indikatoren
RSI bei 75: Der Relative Stärke Index liegt über 70, was auf Überkauftheit hinweist, aber in stark bullischen Phasen auch längere Zeit bestehen bleiben kann.
MACD bullisches Kreuzen: Der Moving Average Convergence Divergence zeigt ein gültiges bullisches Kreuz, mit steigenden grünen Histogrammen, was die Fortsetzung des Aufwärtstrends signalisiert.
Obwohl der RSI mit 75 im überkauften Bereich liegt, deutet die starke Dynamik in Kombination mit einem positiven MACD-Kreuz auf weiteres Potenzial hin. Bisher gibt es keine Anzeichen für eine Divergenz, die auf eine Trendwende hindeuten würde. Die MACD-Bestätigung bleibt entscheidend: Solange die Signallinie nicht nach unten kippt und die Histogramme weiter wachsen, ist der Aufwärtstrend intakt.
Risiken und Unterstützungsniveaus bei Rücksetzern
Falls DUSK eine Korrektur erfährt, könnte der Kurs bis zum 100-Tage-Durchschnitt bei etwa 0,058 USD fallen. Dieses Niveau stellt die erste Unterstützung bei einer kurzfristigen Korrektur dar und entspricht dem vorherigen Widerstand bei 0,055 USD, der nun als Unterstützung fungiert. Bei einem Unterschreiten von 0,058 USD wäre die nächste Unterstützung auf Wochenbasis bei 0,042 USD, dem Startpunkt der aktuellen Rally.
Nach einem schnellen Anstieg von 60 % ist eine gesunde Korrektur zu erwarten. Ein Rücksetzer auf 0,058 bis 0,065 USD, gefolgt von einer Unterstützung, könnte die Basis für die nächste Aufwärtsbewegung bis 0,10 USD bilden. Wird der Kurs jedoch direkt auf 0,10 USD schießen, ohne vorher zu korrigieren, besteht die Gefahr, dass Gewinnmitnahmen den Kurs wieder nach unten ziehen.
