2025 CSPR Price Prediction: Expert Analysis and Market Forecast for Casper Network Token


Introduction: Market Position and Investment Value of CSPR
Casper (CSPR), a Proof-of-Stake Layer-1 blockchain designed to bring real-world assets on-chain, has established itself as a significant infrastructure player since its mainnet launch in March 2021. As of December 2025, CSPR has achieved a market capitalization of $63.79 million, with a circulating supply of approximately 13.68 billion tokens, trading at around $0.004503. This blockchain, recognized for its innovative Zug Consensus mechanism and native multi-virtual machine support, continues to play an increasingly vital role in enabling tokenized assets and enterprise-grade blockchain applications.
This article provides a comprehensive analysis of CSPR's price trajectory and market dynamics, integrating historical price patterns, market supply-demand mechanics, ecosystem development, and macroeconomic factors to deliver professional price forecasts and practical investment guidance for the period through 2030.
Casper (CSPR) Market Analysis Report
I. CSPR Price History Review and Current Market Status
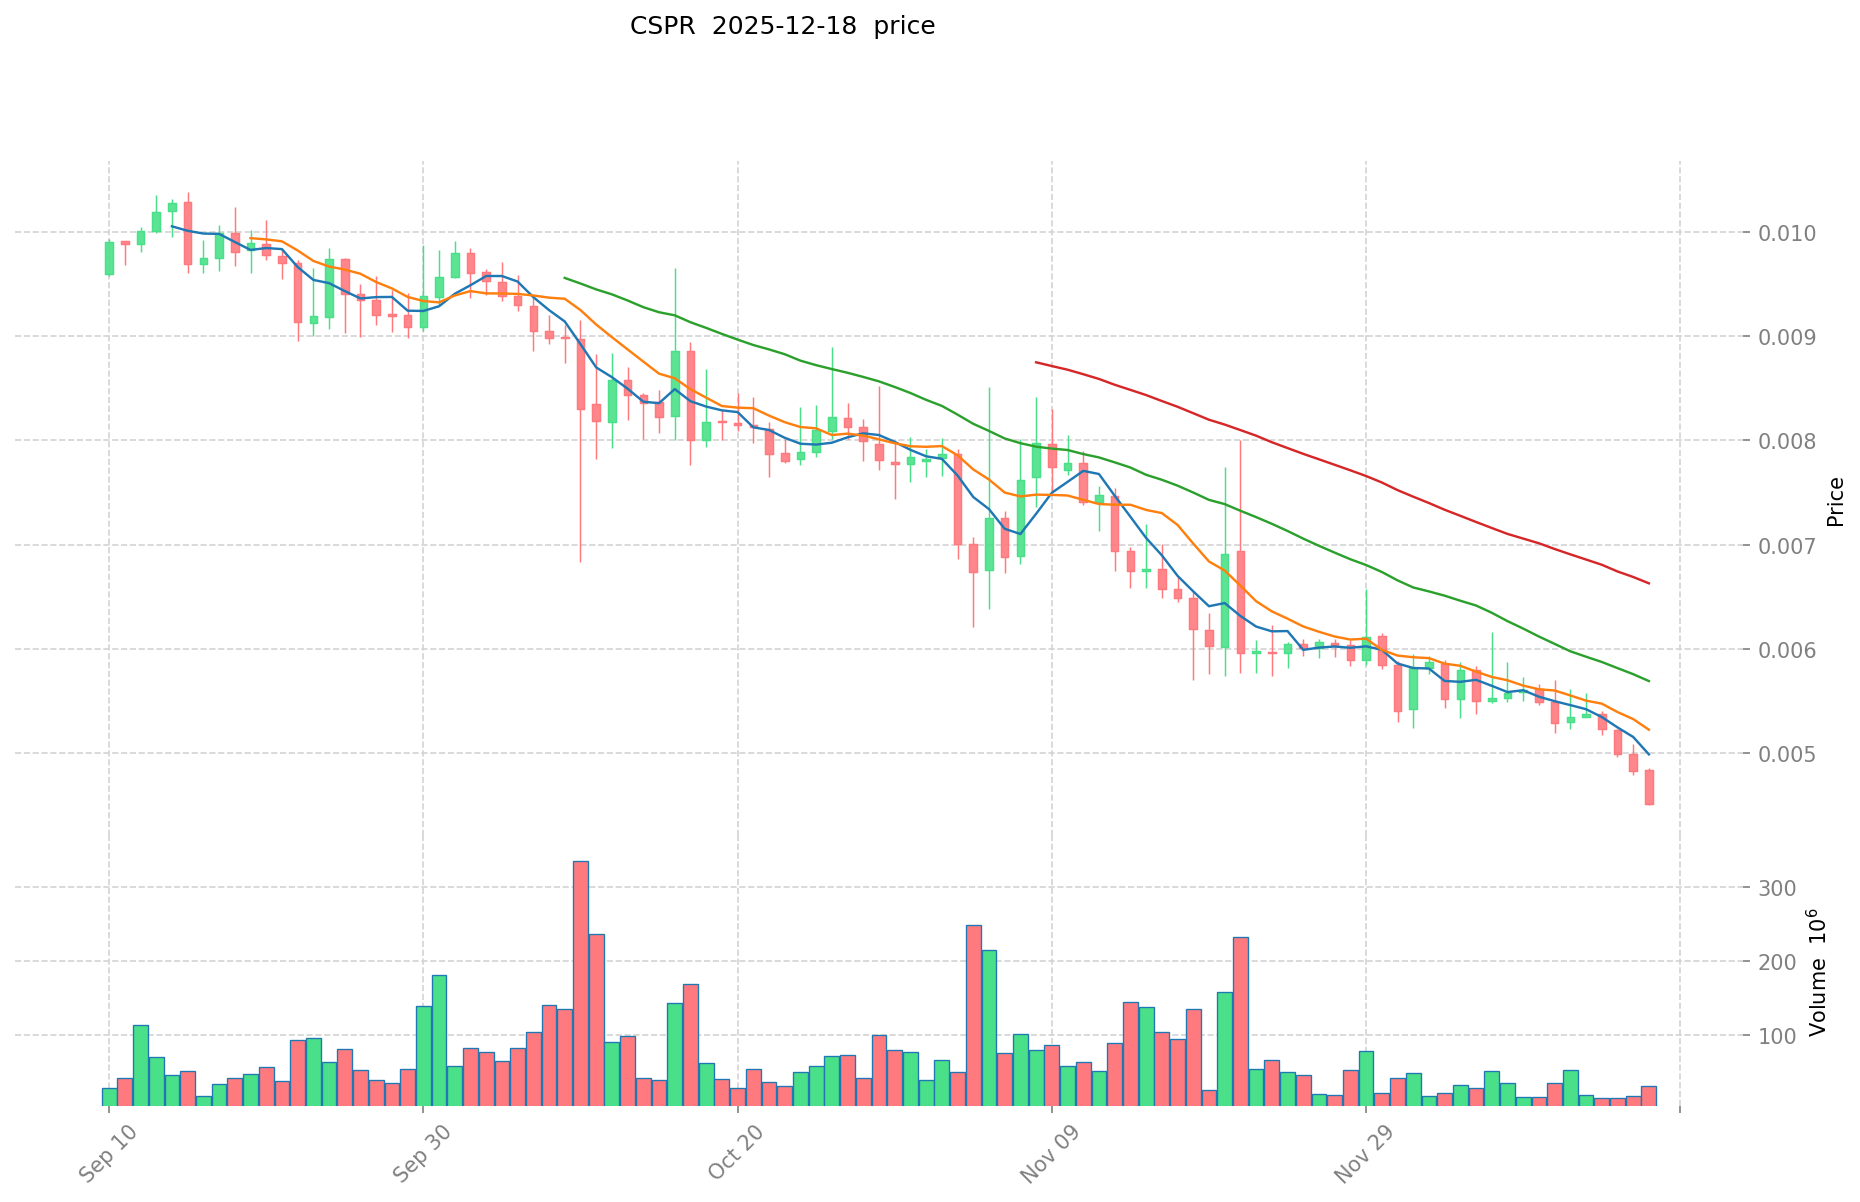
CSPR Historical Price Evolution Trajectory
-
May 2021: Mainnet launch milestone, CSPR reached its all-time high of $1.36330943 on May 12, 2021, marking the peak of initial market enthusiasm following the network's March 2021 mainnet launch.
-
2021-2024: Extended bearish consolidation phase, CSPR experienced significant depreciation from its historical peak, declining approximately 75% over the one-year period.
-
December 2025: Market bottom formation, CSPR reached its all-time low of $0.004504841559455458 on December 18, 2025, representing a 99.67% decline from the all-time high.
CSPR Current Market Status
As of December 18, 2025, CSPR is trading at $0.004503, reflecting a -6% decline over the past 24 hours and a -19.24% weekly decline. The 24-hour trading volume stands at $144,758.95, indicating relatively modest liquidity levels.
The token's market capitalization is approximately $63.79 million with a fully diluted valuation of $63.79 million, representing a market dominance of 0.002%. The circulating supply accounts for 13.68 billion CSPR out of a total supply of 14.17 billion tokens (96.59% circulation ratio), with 344,862 active token holders.
On the one-hour timeframe, CSPR has shown a slight recovery with a +0.04% gain, suggesting minimal near-term momentum. However, the longer-term picture remains challenged, with the token down -30.09% over 30 days and -75.14% over the past year, indicating sustained downward pressure throughout 2025.
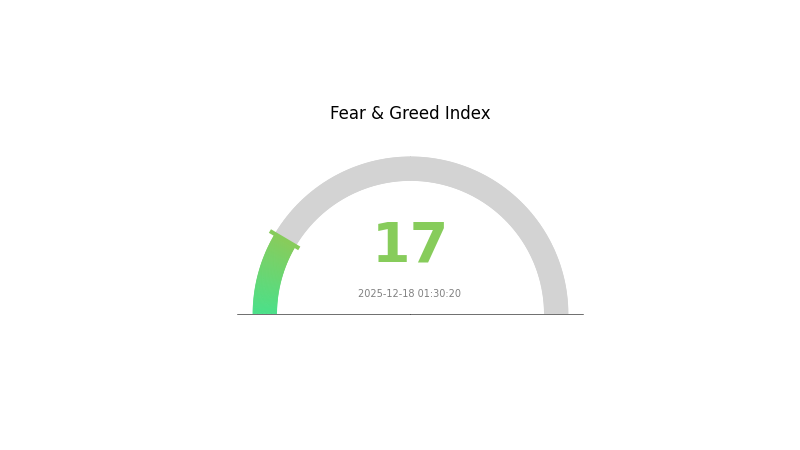
The current market sentiment reflects Extreme Fear (VIX level 17), suggesting heightened risk aversion across the broader cryptocurrency market, which may be constraining CSPR's price action.
Click to view current CSPR market price
CSPR Market Sentiment Indicator
2025-12-18 Fear and Greed Index: 17 (Extreme Fear)
Click to view the current Fear & Greed Index
The CSPR market is currently experiencing extreme fear, with the index at 17, indicating significant market pessimism and heightened risk aversion among investors. This level suggests that market participants are highly concerned about potential downside risks and price volatility. During such periods, it's crucial for traders to exercise caution and avoid panic selling. Long-term investors may view this as a potential accumulation opportunity, as extreme fear often precedes market recoveries. Monitor market developments closely and consider your risk tolerance before making any investment decisions on Gate.com.
CSPR Holdings Distribution
The address holdings distribution represents the concentration of CSPR tokens across different wallet addresses on the blockchain, serving as a key indicator of token ownership structure and market decentralization levels. This metric reveals how tokens are allocated among major holders and the broader user base, providing critical insights into potential market risks and network health.
Current analysis of CSPR's top five addresses shows a combined holding of approximately 30.01% of the total token supply. The largest single address controls 11.12% of all CSPR tokens, while the second and third largest holders maintain 6.40% and 5.29% respectively. The remaining top five addresses each hold between 3.53% and 3.67%, demonstrating a relatively gradual decline in concentration among major stakeholders. Notably, the "Others" category comprises 69.99% of total holdings, distributed across numerous smaller addresses, which suggests meaningful decentralization at the broader level.
This distribution pattern indicates that while CSPR exhibits moderate concentration among its largest stakeholders, the token is not subject to severe centralization risks. The fact that nearly 70% of tokens are held outside the top five addresses demonstrates reasonable token dispersion. However, the combined 30% stake held by the top five addresses warrants monitoring, as coordinated movements by these major holders could theoretically influence market dynamics. The absence of extreme concentration (such as a single address holding over 20-30%) suggests a relatively healthy on-chain structure that balances institutional or early-stage stakeholder interests with broader community participation.
Click to view current CSPR Holdings Distribution
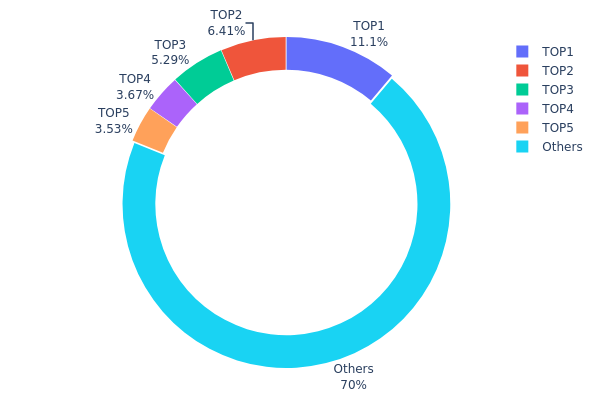
| Top | Address | Holding Qty | Holding (%) |
|---|---|---|---|
| 1 | 01a0d2...fe672f | 1575850.79K | 11.12% |
| 2 | 02038b...eb231f | 907819.84K | 6.40% |
| 3 | 01ee71...c8e60a | 749673.59K | 5.29% |
| 4 | 0203d9...c4c3b3 | 520304.18K | 3.67% |
| 5 | 020232...5e0158 | 500752.50K | 3.53% |
| - | Others | 9912018.38K | 69.99% |
II. Core Factors Affecting CSPR's Future Price
Technology Development and Ecosystem Construction
-
Mainnet Active Address Growth: The increase in active addresses on the Casper mainnet is a critical metric for assessing network health and adoption. Growing active addresses indicate expanding user participation and network utility, which typically correlates with long-term price appreciation.
-
Staking Participation Rate and Node Distribution: The health of the network's staking ecosystem, including staking participation rates and the distribution of validator nodes, directly impacts network security and decentralization. A healthy staking environment with well-distributed nodes strengthens network credibility and can positively influence market sentiment.
-
Enterprise-Level Application Adoption: The real-world adoption and implementation of CSPR within enterprise environments represents a fundamental factor in determining price trajectory. As enterprise-level applications gain traction on the Casper network, it signals practical utility and increased demand for the token.
Market Dynamics
-
Supply and Demand Relationships: CSPR's price fluctuations in the cryptocurrency market are driven by market supply and demand dynamics. During periods of market enthusiasm and increased investor attention, prices may experience significant appreciation.
-
Industry Overall Trends: The broader cryptocurrency market trends and industry sentiment significantly impact CSPR's price performance. Market-wide movements and sectoral developments create the backdrop for individual token price movements.
-
Regulatory Environment Changes: Technological innovation and shifts in the regulatory landscape represent additional factors that can materially influence CSPR's price trajectory and long-term viability in the market.
III. 2025-2030 CSPR Price Forecast
2025 Outlook
- Conservative Forecast: $0.00279 - $0.0045
- Base Case Forecast: $0.0045
- Optimistic Forecast: $0.0054 (requires sustained network adoption and ecosystem development)
2026-2028 Medium-term Outlook
- Market Stage Expectations: Transition phase with gradual accumulation and infrastructure maturation
- Price Range Forecast:
- 2026: $0.00322 - $0.0054 (10% upside potential)
- 2027: $0.00404 - $0.00657 (14% cumulative growth)
- 2028: $0.00311 - $0.00746 (30% cumulative growth)
- Key Catalysts: Enterprise adoption of Casper's proof-of-stake infrastructure, strategic partnerships, and increased institutional participation
2029-2030 Long-term Outlook
- Base Case: $0.00427 - $0.00834 (48% growth by 2029, assuming steady ecosystem expansion)
- Optimistic Scenario: $0.0048 - $0.0087 (66% growth by 2030, contingent on mainstream blockchain integration and enhanced market liquidity)
- Transformational Scenario: $0.0087+ (extreme bullish conditions including major enterprise adoption, regulatory clarity, and significant network utility expansion)
- Dec 18, 2025: CSPR trading near $0.0045 (consolidation phase with moderate volatility expected)
| 年份 | 预测最高价 | 预测平均价格 | 预测最低价 | 涨跌幅 |
|---|---|---|---|---|
| 2025 | 0.0054 | 0.0045 | 0.00279 | 0 |
| 2026 | 0.0054 | 0.00495 | 0.00322 | 10 |
| 2027 | 0.00657 | 0.00518 | 0.00404 | 14 |
| 2028 | 0.00746 | 0.00587 | 0.00311 | 30 |
| 2029 | 0.00834 | 0.00667 | 0.00427 | 48 |
| 2030 | 0.0087 | 0.0075 | 0.0048 | 66 |
Casper (CSPR) Investment Analysis Report
IV. CSPR Professional Investment Strategy and Risk Management
CSPR Investment Methodology
(1) Long-term Hold Strategy
- Suitable for: Investors with high risk tolerance seeking exposure to enterprise blockchain infrastructure and real-world asset tokenization
- Operation recommendations:
- Accumulate CSPR during market downturns, particularly when prices approach support levels, to build a core position in the Layer-1 infrastructure space
- Hold through network development phases, as Casper's multi-VM architecture and developer-friendly environment may attract increasing adoption
- Monitor quarterly developments in enterprise partnerships and tokenization use cases to reassess position thesis
(2) Active Trading Strategy
- Technical analysis tools:
- Support and Resistance Levels: Identify key price points based on historical volatility; current support near $0.0045 and resistance around $0.0050 based on 24H trading range
- Volume Analysis: Monitor trading volume against 24H average of $144,758.95 to confirm trend strength and potential breakout scenarios
- Wave trading key points:
- Trade during high volatility periods when CSPR experiences significant intraday swings, using strict stop-losses at 3-5% below entry
- Consider the 7-day decline of -19.24% and 30-day decline of -30.09% as potential mean-reversion opportunities for short-term traders
CSPR Risk Management Framework
(1) Asset Allocation Principles
- Conservative investors: 0.5-1% of portfolio
- Active investors: 2-4% of portfolio
- Professional investors: 5-10% of portfolio (with systematic rebalancing)
(2) Risk Hedging Solutions
- Position sizing: Limit individual CSPR holdings to ensure no single position exceeds predetermined portfolio risk tolerance
- Rebalancing triggers: Establish quarterly or semi-annual rebalancing schedules to lock in gains if CSPR appreciates significantly from current levels
(3) Secure Storage Solutions
- Hot wallet option: Gate.com Web3 Wallet for frequent trading and active management, offering convenience with security features for intermediate traders
- Cold storage approach: For long-term holders, utilize hardware security solutions to store private keys offline, reducing exposure to exchange or online vulnerabilities
- Security considerations: Enable multi-factor authentication on all exchange accounts; never share private keys or seed phrases; maintain backups in geographically diverse secure locations; verify all transaction details before confirmation
V. CSPR Potential Risks and Challenges
CSPR Market Risk
- Price volatility: CSPR has declined 75.14% over the past year and currently trades near all-time lows ($0.004504), indicating extreme volatility and potential for further downside
- Low trading volume: 24-hour volume of $144,758.95 relative to $61.6 million market cap suggests limited liquidity, which can lead to significant price slippage during larger trades
- Market sentiment: Current market ranking of 444 and declining momentum across multiple timeframes reflects weak investor demand and potential continued bearish pressure
CSPR Regulatory Risk
- Evolving regulatory environment: Real-world asset tokenization remains under regulatory scrutiny in most jurisdictions; changes in securities regulations could impact Casper's core use case
- Compliance requirements: Enterprise adoption of tokenized assets may require additional compliance frameworks that could affect network growth trajectory
- Geographic restrictions: Certain jurisdictions may implement restrictions on Layer-1 blockchains or token trading, limiting addressable market
CSPR Technical Risk
- Execution risk: Multi-VM architecture and protocol-level access control features remain relatively unproven at scale compared to established competitors
- Competition: Other Layer-1 networks with greater market adoption and developer ecosystems may limit Casper's ability to capture market share in enterprise tokenization
- Upgrade complexity: Ongoing protocol upgrades and feature rollouts introduce potential technical vulnerabilities or network disruptions
VI. Conclusion and Action Recommendations
CSPR Investment Value Assessment
Casper presents a specialized investment thesis centered on real-world asset tokenization and enterprise blockchain infrastructure. The protocol's Zug Consensus mechanism, multi-VM support, and developer-friendly environment with Rust, WASM, and mainstream language SDKs position it for potential adoption in regulated asset ecosystems. However, the project faces significant challenges: a 75.14% decline over one year, trading near all-time lows, limited trading liquidity, and unproven enterprise adoption at scale. While the long-term vision of bringing real-world assets on-chain has merit, near-term price momentum remains negative, and regulatory uncertainty surrounding tokenized assets presents execution risks.
CSPR Investment Recommendations
✅ Beginners: Start with micro-positions (0.25-0.5% of portfolio) only after thorough research into blockchain fundamentals and real-world asset tokenization concepts; use dollar-cost averaging over 6-12 months rather than lump-sum purchases given current market weakness
✅ Experienced investors: Consider 2-4% allocations as a speculative bet on enterprise blockchain adoption, but implement strict risk management with position sizing and rebalancing triggers; monitor network development metrics and enterprise partnership announcements
✅ Institutional investors: Evaluate CSPR as a potential 5-10% alternative allocation within blockchain infrastructure strategies, conditional on demonstrable enterprise tokenization use cases and regulatory clarity; conduct thorough due diligence on protocol technical execution and competitive positioning
CSPR Trading Participation Methods
- Direct token acquisition: Purchase CSPR on Gate.com against major trading pairs (USDT, ETH); utilize limit orders to execute positions at desired price levels given low liquidity
- Staking participation: Lock CSPR tokens in network staking to earn yield on holdings while supporting network validation, though staking rewards depend on network participation rates
- Portfolio exposure: Integrate CSPR as a small-cap alternative blockchain allocation within diversified crypto portfolios; rebalance periodically to maintain target allocation percentages
Cryptocurrency investment carries extreme risk. This report does not constitute investment advice. Investors should make decisions based on their own risk tolerance and should consult qualified financial advisors. Never invest capital you cannot afford to lose.
FAQ
Can Casper reach $100 today?
Unlikely today. Casper would need significant bullish momentum and broader market adoption to reach $100. Current market conditions and trading volume make this price level improbable in the short term.
Will CSPR recover?
CSPR shows strong recovery potential supported by solid fundamentals and growing ecosystem development. Market cycles suggest recovery is likely as adoption increases and network utility expands. Historical patterns indicate similar projects bounce back from current levels.
What is the all time high for Casper CSPR?
Casper (CSPR) reached an all-time high of $1.36 on May 11, 2021. Since then, the token has experienced significant price fluctuations in the crypto market.
Is Casper a buy or sell?
Casper shows strong fundamentals with growing adoption in the blockchain ecosystem. Current market conditions and technical indicators suggest a buy opportunity for long-term holders seeking exposure to scalable layer-1 solutions.
Share
Content
Introduction: Market Position and Investment Value of CSPR
I. CSPR Price History Review and Current Market Status
II. Core Factors Affecting CSPR's Future Price
III. 2025-2030 CSPR Price Forecast
IV. CSPR Professional Investment Strategy and Risk Management
V. CSPR Potential Risks and Challenges
VI. Conclusion and Action Recommendations
FAQ
How to Buy Cryptocurrency


Trending Cryptocurrencies


XZXX: A Comprehensive Guide to the BRC-20 Meme Token in 2025

Bitcoin Fear and Greed Index: Market Sentiment Analysis for 2025

Top Crypto ETFs to Watch in 2025: Navigating the Digital Asset Boom

5 ways to get Bitcoin for free in 2025: Newbie Guide

Bitcoin Market Cap in 2025: Analysis and Trends for Investors
2025 Bitcoin Price Prediction: Trump's Tariffs' Impact on BTC

2024's Most Anticipated NFT Innovations
Secure and User-Friendly Digital Wallet for Tezos Blockchain

Creating Your Own Digital Currency: Step-by-Step Development Guide
Comprehensive Guide to the DRC 20 Token Standard

What is DRV: Understanding Dividend Reinvestment Plans and Their Investment Benefits