#BTCMarketAnalysis
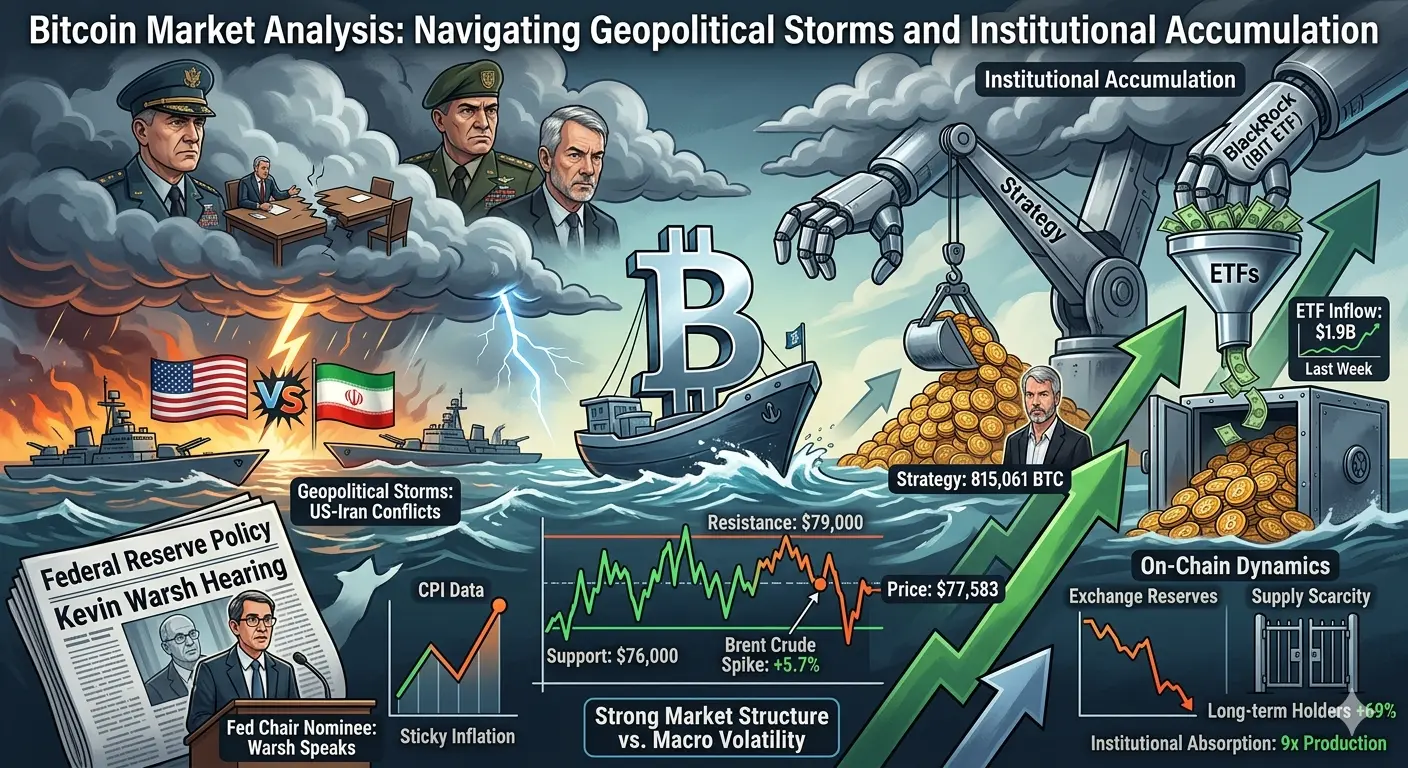
Bitcoin Market Analysis: Navigating Geopolitical Storms and Institutional Accumulation
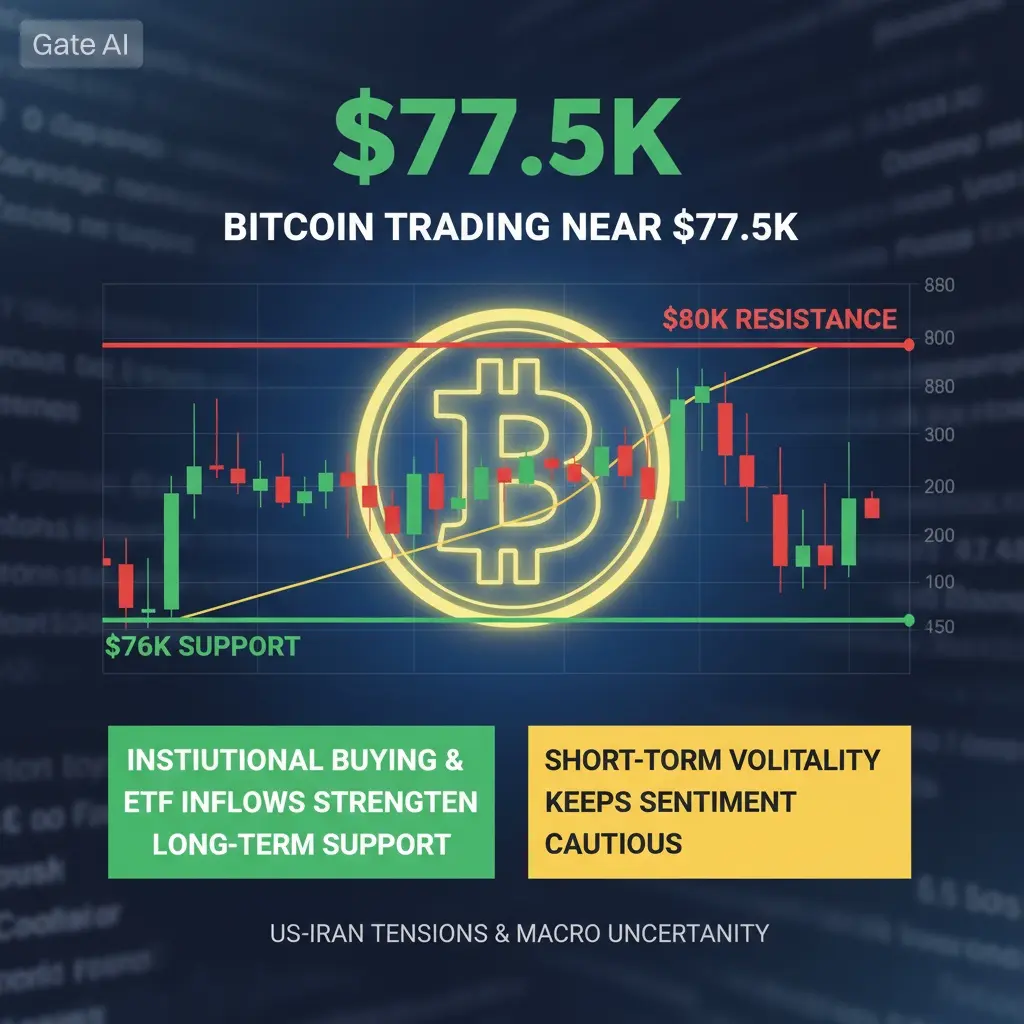
Bitcoin is currently trading around $77,583, having experienced significant volatility over the past week with prices oscillating between $76,000 and $79,000. The market is caught in a complex tug-of-war between mounting geopolitical tensions and unprecedented institutional accumulation, creating a fragile but potentially constructive price structure.
Geopolitical Headwinds and Market Resilience
The collapse of US-Iran peace negotiations has emerged as the primary macro headwind weighing on risk assets. Following the breakdown of talks, Iran reimposed controls on the Strait of Hormuz over the weekend, triggering a 5.7% spike in Brent crude oil prices while European equity futures declined 1.2%. However, Bitcoin demonstrated remarkable resilience, slipping only 1.6% compared to the dramatic moves in traditional markets. This divergence suggests that cryptocurrency markets may have largely priced in geopolitical tail risks, with traders who intended to sell on Iran headlines having already exited positions. The spot ETF bid has established itself as a more reliable floor than the futures-driven weekend gaps that characterized earlier market cycles.
Analyst Nic Puckrin from Coin Bureau characterized Bitcoin's recent recovery as fragile, noting that the cryptocurrency surged roughly 5.8% beginning April 6, briefly topping $73,000, before retreating to around $71,000 after the US-Iran negotiations collapsed. The probability of a 25-basis-point Federal Reserve rate cut has risen to only 33.6% by the July meeting, suggesting Bitcoin may face prolonged macro pressure until monetary policy clarity emerges.
Kevin Warsh Hearing and Fed Policy Implications
The Senate Banking Committee hearing featuring Federal Reserve chair nominee Kevin Warsh sparked intense debate across financial markets. Warsh emphasized the central bank's independence from President Trump's calls for lower interest rates, stating that Trump never demanded rate cuts during their discussions. While his remarks suggested less urgency for immediate rate reductions, market observers anticipate he would still favor lower rates as chairman. Crucially, Warsh's appointment could prove positive for crypto policy, as he would become the first Fed chair with deep ties to the digital asset industry, potentially accelerating regulatory clarity and institutional adoption.
Michael Saylor and the Institutional Arms Race
The most significant development in recent weeks has been Michael Saylor's Strategy officially surpassing BlackRock as the largest single-entity Bitcoin holder. Strategy now holds 815,061 BTC compared to BlackRock's IBIT ETF holding of 802,823 BTC. This milestone was achieved through Strategy's acquisition of an additional 34,164 Bitcoin valued at approximately $2.54 billion, bringing their total holdings to an astounding $60 billion at current prices.
This institutional accumulation reflects a broader trend transforming Bitcoin's market structure. US spot Bitcoin ETFs recorded approximately $1.9 billion in net inflows last week, representing the best five-day stretch since early February. BlackRock's IBIT ETF alone attracted $612 million during this period. Year-to-date 2026 inflows now total nearly $2.3 billion, with BlackRock estimated to be purchasing roughly $280 million of Bitcoin daily through IBIT during the most intense flow periods.
CPI Data and Macro Outlook
Consumer Price Index data continues to influence market expectations for Federal Reserve policy. With inflation remaining sticky above target levels, the market has adjusted expectations for rate cuts, contributing to the cautious sentiment across risk assets. The combination of geopolitical uncertainty and persistent inflation has created a challenging macro environment where Bitcoin must navigate between flight-to-safety flows and risk-off sentiment in traditional markets.
Technical Analysis and Key Levels
From a technical perspective, Bitcoin is testing critical support and resistance zones. The cryptocurrency briefly touched $79,000 before retreating to the $77,000-$78,000 range, with $76,000 serving as immediate support. The 4-hour timeframe shows a bullish alignment with MA7 above MA30 above MA120, indicating underlying strength in the medium-term trend. However, daily indicators present a more cautious picture, with CCI in overbought territory and SAR positioned above recent average highs, suggesting potential for consolidation or pullback.
The 15-minute timeframe reveals oversold conditions on both CCI and Williams %R indicators, hinting at potential short-term bounce opportunities. Volume analysis shows increased trading activity during price declines, indicating some distribution pressure that traders should monitor closely.
Market Sentiment and On-Chain Dynamics
The Crypto Fear and Greed Index currently sits at 31, firmly in the Fear territory, suggesting that despite recent price strength, market participants remain cautious. Social sentiment analysis indicates 69% positive content versus 20% negative, with bullish sentiment dominating discussions. The primary topics circulating on social platforms center around Strategy's accumulation milestone and BlackRock's continued ETF inflows.
On-chain data reveals a profound supply-side transformation. Large holders controlling over 1,000 BTC have increased their positions by 270,000 coins over the past 30 days, marking the largest monthly increase since 2013. Long-term holder supply has surged 69% to 3.6 million BTC, while exchange reserves have fallen to seven-year lows. This supply constriction, combined with institutional absorption rates nine times higher than new supply creation, creates a constructive backdrop for price appreciation once macro headwinds subside.
Conclusion
Bitcoin stands at a critical juncture where geopolitical uncertainty meets institutional conviction. While US-Iran tensions and Fed policy ambiguity create near-term volatility, the underlying market structure has never been stronger. The transfer of supply from short-term traders to long-term institutional holders represents a fundamental shift in Bitcoin's ownership profile. Traders should watch the $76,000 support level closely, as a sustained hold above this zone could set the stage for a push toward $80,000 and beyond once geopolitical clouds clear. The combination of supply scarcity, institutional adoption, and improving regulatory prospects suggests that current volatility may ultimately prove to be a consolidation phase within a larger bull market structure.
Bitcoin Market Analysis: Navigating Geopolitical Storms and Institutional Accumulation
Bitcoin is currently trading around $77,583, having experienced significant volatility over the past week with prices oscillating between $76,000 and $79,000. The market is caught in a complex tug-of-war between mounting geopolitical tensions and unprecedented institutional accumulation, creating a fragile but potentially constructive price structure.
Geopolitical Headwinds and Market Resilience
The collapse of US-Iran peace negotiations has emerged as the primary macro headwind weighing on risk assets. Following the breakdown of talks, Iran reimposed controls on the Strait of Hormuz over the weekend, triggering a 5.7% spike in Brent crude oil prices while European equity futures declined 1.2%. However, Bitcoin demonstrated remarkable resilience, slipping only 1.6% compared to the dramatic moves in traditional markets. This divergence suggests that cryptocurrency markets may have largely priced in geopolitical tail risks, with traders who intended to sell on Iran headlines having already exited positions. The spot ETF bid has established itself as a more reliable floor than the futures-driven weekend gaps that characterized earlier market cycles.
Analyst Nic Puckrin from Coin Bureau characterized Bitcoin's recent recovery as fragile, noting that the cryptocurrency surged roughly 5.8% beginning April 6, briefly topping $73,000, before retreating to around $71,000 after the US-Iran negotiations collapsed. The probability of a 25-basis-point Federal Reserve rate cut has risen to only 33.6% by the July meeting, suggesting Bitcoin may face prolonged macro pressure until monetary policy clarity emerges.
Kevin Warsh Hearing and Fed Policy Implications
The Senate Banking Committee hearing featuring Federal Reserve chair nominee Kevin Warsh sparked intense debate across financial markets. Warsh emphasized the central bank's independence from President Trump's calls for lower interest rates, stating that Trump never demanded rate cuts during their discussions. While his remarks suggested less urgency for immediate rate reductions, market observers anticipate he would still favor lower rates as chairman. Crucially, Warsh's appointment could prove positive for crypto policy, as he would become the first Fed chair with deep ties to the digital asset industry, potentially accelerating regulatory clarity and institutional adoption.
Michael Saylor and the Institutional Arms Race
The most significant development in recent weeks has been Michael Saylor's Strategy officially surpassing BlackRock as the largest single-entity Bitcoin holder. Strategy now holds 815,061 BTC compared to BlackRock's IBIT ETF holding of 802,823 BTC. This milestone was achieved through Strategy's acquisition of an additional 34,164 Bitcoin valued at approximately $2.54 billion, bringing their total holdings to an astounding $60 billion at current prices.
This institutional accumulation reflects a broader trend transforming Bitcoin's market structure. US spot Bitcoin ETFs recorded approximately $1.9 billion in net inflows last week, representing the best five-day stretch since early February. BlackRock's IBIT ETF alone attracted $612 million during this period. Year-to-date 2026 inflows now total nearly $2.3 billion, with BlackRock estimated to be purchasing roughly $280 million of Bitcoin daily through IBIT during the most intense flow periods.
CPI Data and Macro Outlook
Consumer Price Index data continues to influence market expectations for Federal Reserve policy. With inflation remaining sticky above target levels, the market has adjusted expectations for rate cuts, contributing to the cautious sentiment across risk assets. The combination of geopolitical uncertainty and persistent inflation has created a challenging macro environment where Bitcoin must navigate between flight-to-safety flows and risk-off sentiment in traditional markets.
Technical Analysis and Key Levels
From a technical perspective, Bitcoin is testing critical support and resistance zones. The cryptocurrency briefly touched $79,000 before retreating to the $77,000-$78,000 range, with $76,000 serving as immediate support. The 4-hour timeframe shows a bullish alignment with MA7 above MA30 above MA120, indicating underlying strength in the medium-term trend. However, daily indicators present a more cautious picture, with CCI in overbought territory and SAR positioned above recent average highs, suggesting potential for consolidation or pullback.
The 15-minute timeframe reveals oversold conditions on both CCI and Williams %R indicators, hinting at potential short-term bounce opportunities. Volume analysis shows increased trading activity during price declines, indicating some distribution pressure that traders should monitor closely.
Market Sentiment and On-Chain Dynamics
The Crypto Fear and Greed Index currently sits at 31, firmly in the Fear territory, suggesting that despite recent price strength, market participants remain cautious. Social sentiment analysis indicates 69% positive content versus 20% negative, with bullish sentiment dominating discussions. The primary topics circulating on social platforms center around Strategy's accumulation milestone and BlackRock's continued ETF inflows.
On-chain data reveals a profound supply-side transformation. Large holders controlling over 1,000 BTC have increased their positions by 270,000 coins over the past 30 days, marking the largest monthly increase since 2013. Long-term holder supply has surged 69% to 3.6 million BTC, while exchange reserves have fallen to seven-year lows. This supply constriction, combined with institutional absorption rates nine times higher than new supply creation, creates a constructive backdrop for price appreciation once macro headwinds subside.
Conclusion
Bitcoin stands at a critical juncture where geopolitical uncertainty meets institutional conviction. While US-Iran tensions and Fed policy ambiguity create near-term volatility, the underlying market structure has never been stronger. The transfer of supply from short-term traders to long-term institutional holders represents a fundamental shift in Bitcoin's ownership profile. Traders should watch the $76,000 support level closely, as a sustained hold above this zone could set the stage for a push toward $80,000 and beyond once geopolitical clouds clear. The combination of supply scarcity, institutional adoption, and improving regulatory prospects suggests that current volatility may ultimately prove to be a consolidation phase within a larger bull market structure.