Last week, a whale that has held more than $BTC for over seven years sold approximately $271 million worth of Bitcoin, setting a record for the highest single-day activity since January 10. In January, similarly sized sell-offs triggered a 13% market pullback within two weeks; this time, on-chain data shows the market’s ability to absorb has strengthened, and long-term holders are accumulating Bitcoin faster. Analysts believe Bitcoin could remain in the $70,000 to $72,000 range.
Details of the OG Whale Sell-Off: Scale, Timing, and Historical Comparison
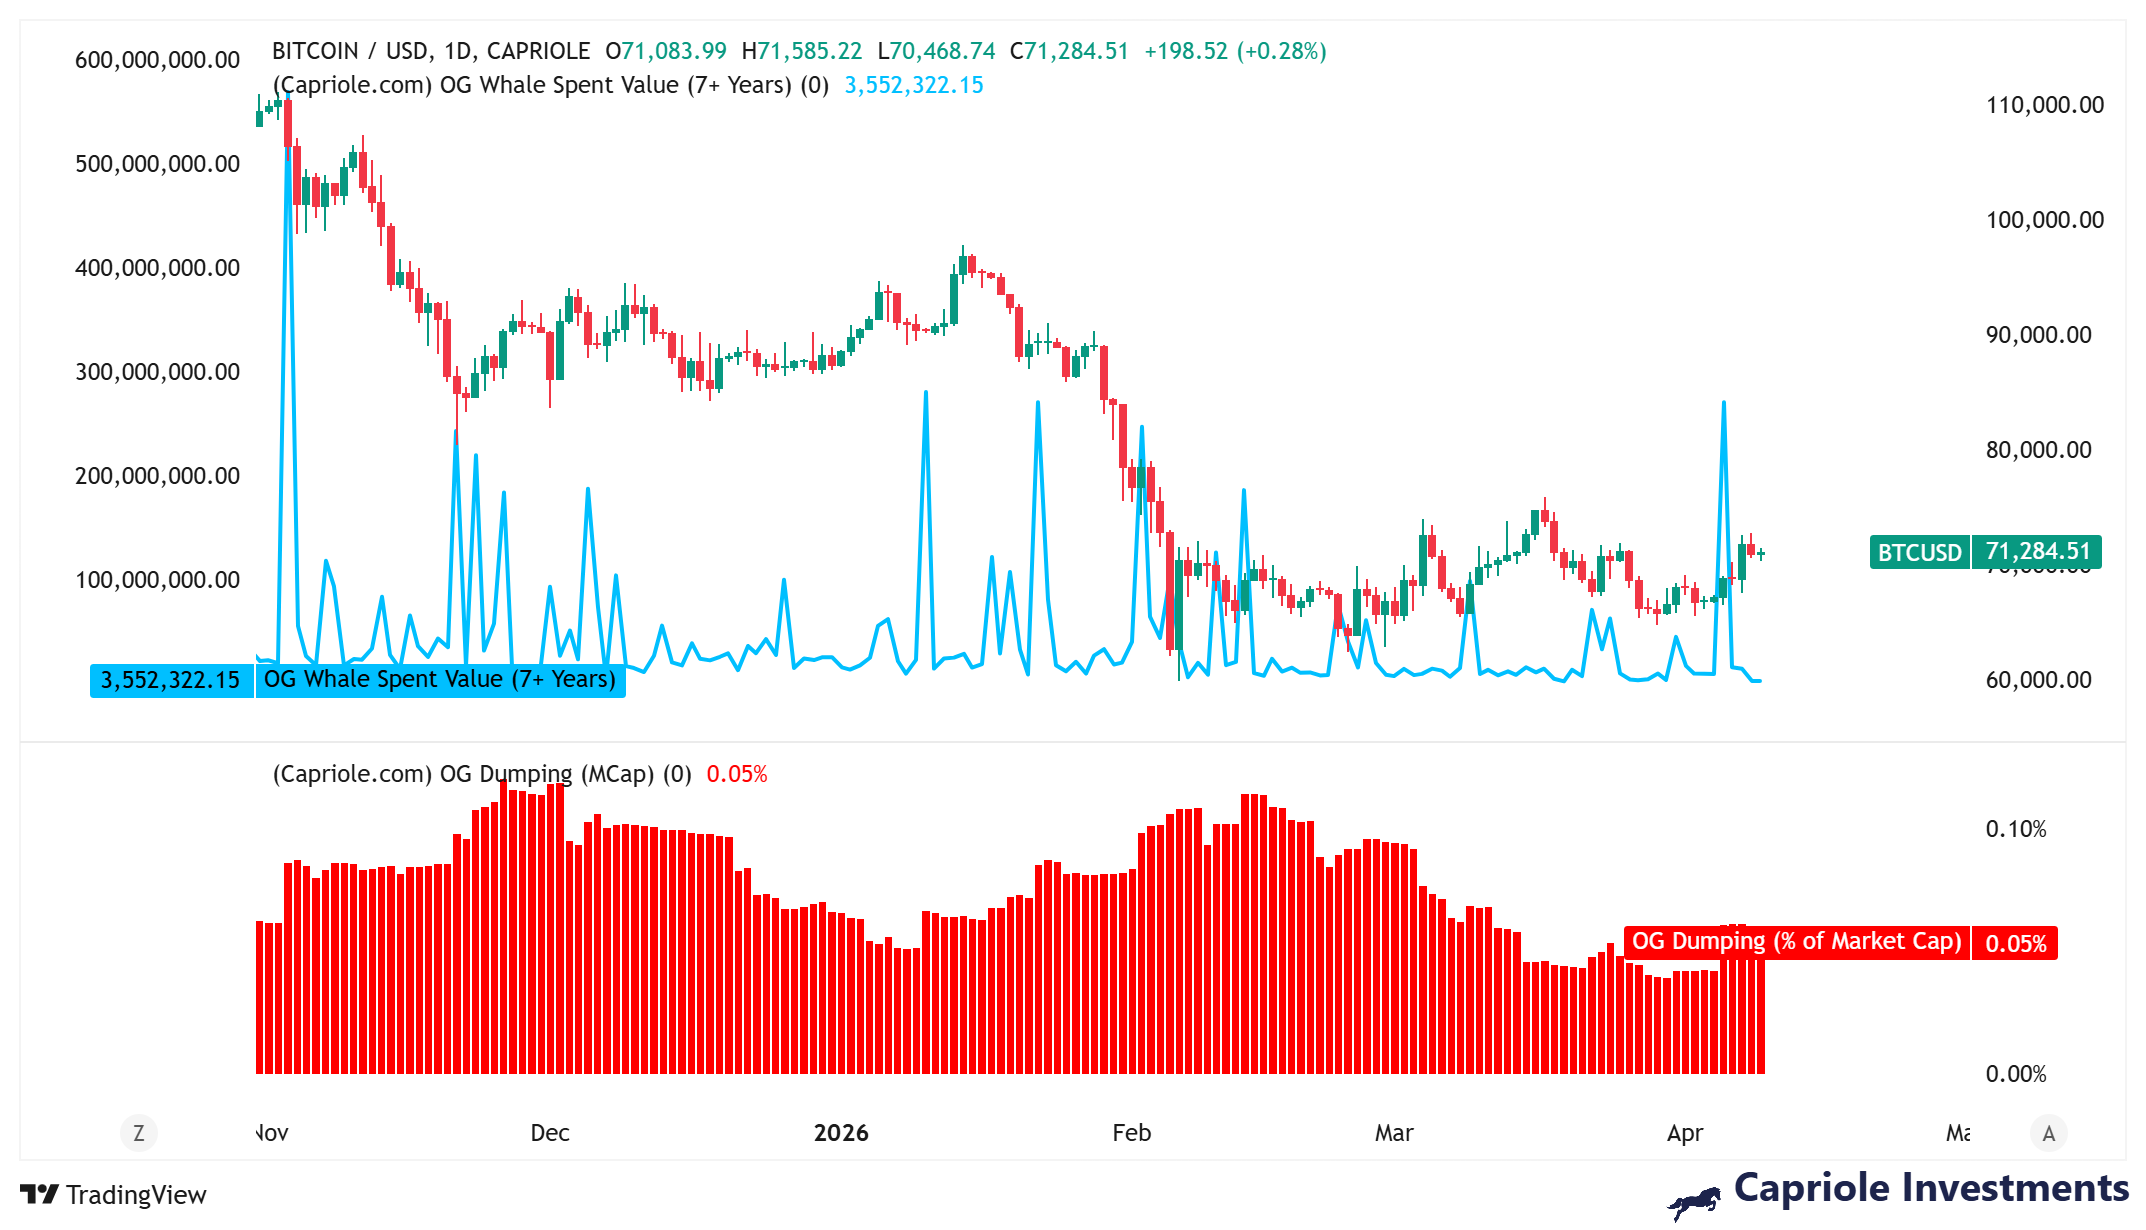 (Source: Capriole Investments)
According to data from Capriole Investments, this OG whale’s sell-off was concentrated on Sunday, totaling about $271 million, the highest daily spending activity for this group since January 10, 2026. Looking at the historical backdrop, the market conditions for the two sell-offs were completely different:
This time vs. the January sell-off: Key comparisons
January event: $280 million in capital outflows; within two weeks, Bitcoin fell from $90,000 to $78,700, a drop of about 13%. At the time, market demand was weak, and buyers couldn’t absorb the sell-off pressure.
This time: Glassnode data shows that as of April 9, the 30-day net position change for long-term holders turned positive, reaching +88,000 BTC; the large net outflow of -152,000 BTC that appeared in February has been fully reversed.
Positions keep increasing: As of Tuesday, this group’s total Bitcoin holdings have surpassed 4.3 million BTC, and by Thursday they climbed further to 4.5 million BTC.
Why this market is more resilient
Analysts generally believe that this OG whale sell-off aligns more with a “controlled profit-taking” model rather than the chaotic sell-off seen in January. The core difference lies in the demand side: on-chain data now indicates that Bitcoin is continuing to move toward more stable investors holding positions. The Bitcoin leaving old wallets is being absorbed more quickly, effectively easing overall supply pressure.
The current market structure is also different from January—back then, the market was fragile and buyer demand was insufficient; now, long-term holders’ accumulation actions are clearly visible, and after combining the two, overall buy-through capacity has improved markedly.
Technical indicators: Accumulation signals are starting to appear
CryptoQuant analyst MorenoDV pointed out two key technical indicators that further support the view that the market is nearing a bottom:
Short-term Sharpe Ratio: It has fallen to -40. Historically, this level corresponds to the major accumulation phases of 2015, 2019, 2020, and 2023, indicating that risk-adjusted returns are at an all-time historical low—often an early signal for putting capital to work on dips.
Delta (buy-sell pressure differential): It has moved from a strong sell-off zone below -0.05 into a neutral area, signaling that capitulation-style selling is nearing its end, liquidation pressure is easing, and demand is gradually recovering. The analyst noted: “For investors with a sense of cycles, the data shows we are closer to the start of opportunity than to the end.”
FAQ
Will the $271 million OG whale sell-off trigger a market breakdown?
Based on on-chain data, there is a fundamental difference between the sell-off backdrop this time and January—long-term holders’ net positions are positive (+88,000 BTC), Bitcoin’s total holdings have risen to 4.5 million BTC, and the market’s absorption capacity has significantly increased. Analysts therefore tend to view this activity as orderly profit-taking rather than a chaotic sell-off.
What trend is currently shown in long-term holders’ net position data?
Glassnode data shows that as of April 9, the 30-day net position change for long-term holders turned positive to +88,000 BTC, reversing the large -152,000 BTC net outflow seen in February. This reflects that institutions and long-term capital are actively absorbing the market’s sell-off.
What signals do Bitcoin’s current technical indicators convey?
The short-term Sharpe Ratio has fallen to -40, corresponding to the historical accumulation windows of 2015, 2019, 2020, and 2023. The buy-sell pressure differential is rebounding into the neutral area, indicating that forced sell pressure has eased. Analysts believe the current readings are between “demand has been exhausted” and “a confirmed recovery.”
Disclaimer: The information on this page may come from third parties and does not represent the views or opinions of Gate. The content displayed on this page is for reference only and does not constitute any financial, investment, or legal advice. Gate does not guarantee the accuracy or completeness of the information and shall not be liable for any losses arising from the use of this information. Virtual asset investments carry high risks and are subject to significant price volatility. You may lose all of your invested principal. Please fully understand the relevant risks and make prudent decisions based on your own financial situation and risk tolerance. For details, please refer to
Disclaimer.
Related Articles
ETH and Altcoins Could See Parabolic Surge Upon Following Bullish Russell 2000 ATH Path
ETH and altcoins coils see parabolic surge upon following a bullish indicators.
The Russell 2000 just set a new ATH at 2,798 for the first time.
This new ATH indicator is a bullish signal for altcoins.
The crypto community is pleased to see that both BTC and ETH are trading at higher
CryptoNewsLand1h ago
Bitcoin Tops $75K as Ceasefire Hopes Drive Rally
Bitcoin rose on ETF demand while miners sold BTC; margins tightened and AI/HPC-focused pivots could turn miners into AI data-center players, potentially boosting valuations as AI demand grows.
Abstract: Bitcoin rose on ETF demand amid miner selling and tight margins. The report highlights a strategic pivot by public miners toward AI/HPC infrastructure, signaling a potential shift from pure bitcoin mining to AI data-center services and higher valuation multiples.
CryptoFrontier1h ago
Shiba Inu Sees 82.5B Token Outflow as Market Structure Shifts
Key Insights
Shiba Inu saw 82.5 billion tokens exit exchanges within 24 hours, signaling reduced supply pressure and increasing accumulation behavior among larger holders.
Exchange net flows remain positive as inflows persist, yet rising outflows suggest a gradual balance forming between
CryptoNewsLand1h ago
Report: Tokenised Assets on Major CEX Enable Real-Time Macro Hedging Amid Geopolitical Events
Gate News message, April 21 — A leading cryptocurrency exchange and Block Scholes released a research report examining the convergence between crypto and traditional financial markets, as traders increasingly move across asset classes in response to global macro events.
The platform's TradFi
GateNews2h ago
ARB Recovery Gains Steam as Staking Yields Jump Above 221%
ARB rebounded 10% with strong volume and improving bullish market structure.
Staking yields rose above 221%, attracting more yield-focused investor interest.
Resistance near $0.14 remains key, with liquidity risks below current price.
Arbitrum — ARB, is showing renewed strength after a s
CryptoNewsLand4h ago
U.S. Crypto Adoption Rebounds to 12% in March as Bitcoin ETF Inflows Hit $1.32B
U.S. crypto adoption rose to 12% in March after hitting 7% in February, driven by positive Bitcoin ETF inflows. Despite recovery, sentiment is fragile, with many expecting lower Bitcoin prices in 2026, and adoption trends remain skewed towards men and higher-income groups.
GateNews4h ago
