#DeepCreationCamp Bitcoin climbs over $72500 and touches one-month high on resilience to Iran conflict
Bitcoin and crypto stocks surge amid relief rally for risky assets
.
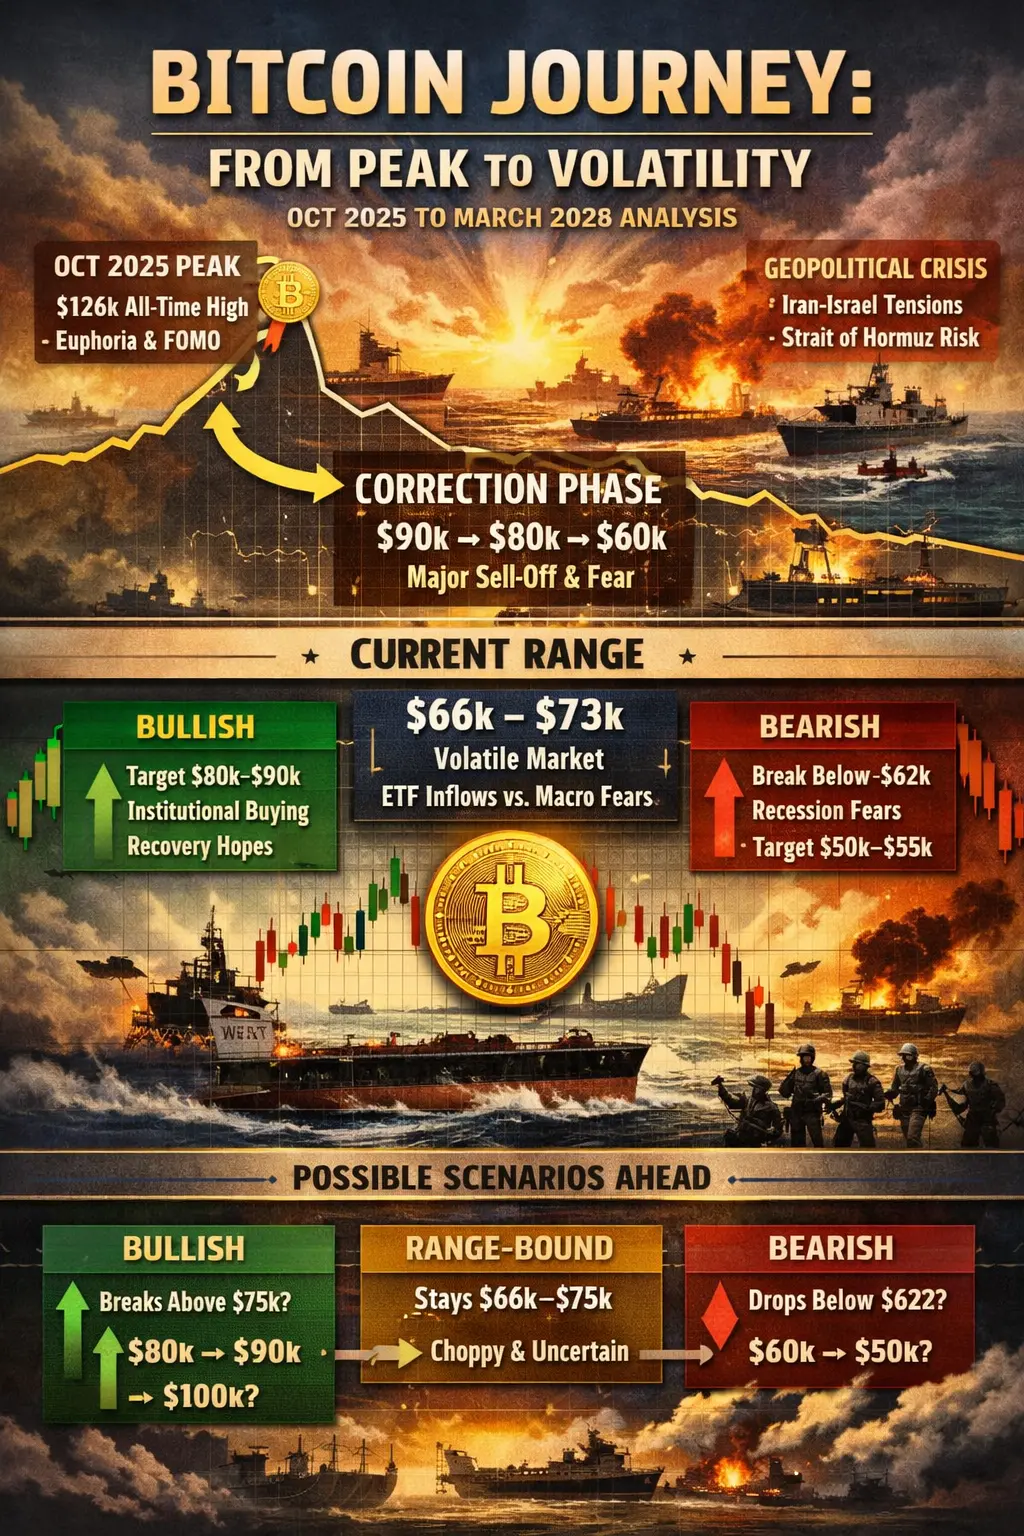
🧠 1) The Broad Story: October 2025 Peak to Today (March 2026)
Back in October 2025, Bitcoin rallied to a peak near ~$125,000–$126,000 — a spectacular cycle top that many traders saw as confirmation of the post‑halving bull phase. That rally was fueled by strong demand from retail traders, massive speculative positioning, and institutional participation through spot ETF inflows and long positions on derivatives.
However, after that peak:
Bitcoin couldn’t sustain above those highs and struggled near $120k and then $100k as profit‑taking intensified.
As the months progressed, traders became hesitant — with BTC breaking important support zones and traders starting to question the bullish narrative.
From October through February, BTC saw continued selling pressure resulting in a multi‑month drawdown of more than -50% from peak levels. Traders have described this as a structural correction, not just a short pullback.
In late February and early March 2026, after trading as low as ~$60k and languishing for months:
✔ Bitcoin has managed to rebound into the $68k–$73k zone — breaking above short‑term resistance.
✔ This rebound is not purely technical; it reflects active buying from institutional sources (spot ETFs) and large holders (whales).
🧠 2) Current Price Action, Patterns & Trader Psychology
Bitcoin’s recent moves look like a classic post‑peak consolidation with rebound attempts rather than a straight recovery — and traders interpret this in several ways
:
🧩 A) Bear Flag / Consolidation Pattern (Dominant Narrative)
Many technical analysts see BTC having formed a bearish continuation structure often called a bear flag — a sideways consolidation after a sharp move down. In simple terms:
🔹 Price moves down strongly
🔹 Price consolidates sideways
🔹 Then — potentially — continuation of the down move if key support breaks
The zone between $62,000 and $70,000 has become the definitive battleground. Traders say:
Above $70k: bullish bounce zone
Below $62k: danger zone for deeper correction
Between them: consolidation territory where sellers and short‑term buyers battle for control
The structure shows selling exhaustion versus accumulation tension — but until a breakout or breakdown is confirmed, the market remains range‑bouound
🧠 B) Trader Sentiment — Fear, Greed & Positioning
The market is currently dominated by fear and uncertainty:
📉 The Fear & Greed Index stands near extreme fear levels, which historically signals potential near‑term lows before rallies — but not guaranteed reversals.
📉 Prediction markets show a high probability (80%+) of BTC staying under $75,000 for much of 2026 unless key catalysts emerge.
Sentiment interpretation:
Retail traders: cautious, waiting for clarity.
Institutional players: accumulating at current levels, seeing value.
Derivatives traders: mixed — some short‑term short positions, some waiting for breakout trades.
Large accumulation by whales and ETFs suggests smart money sees value near current levels.
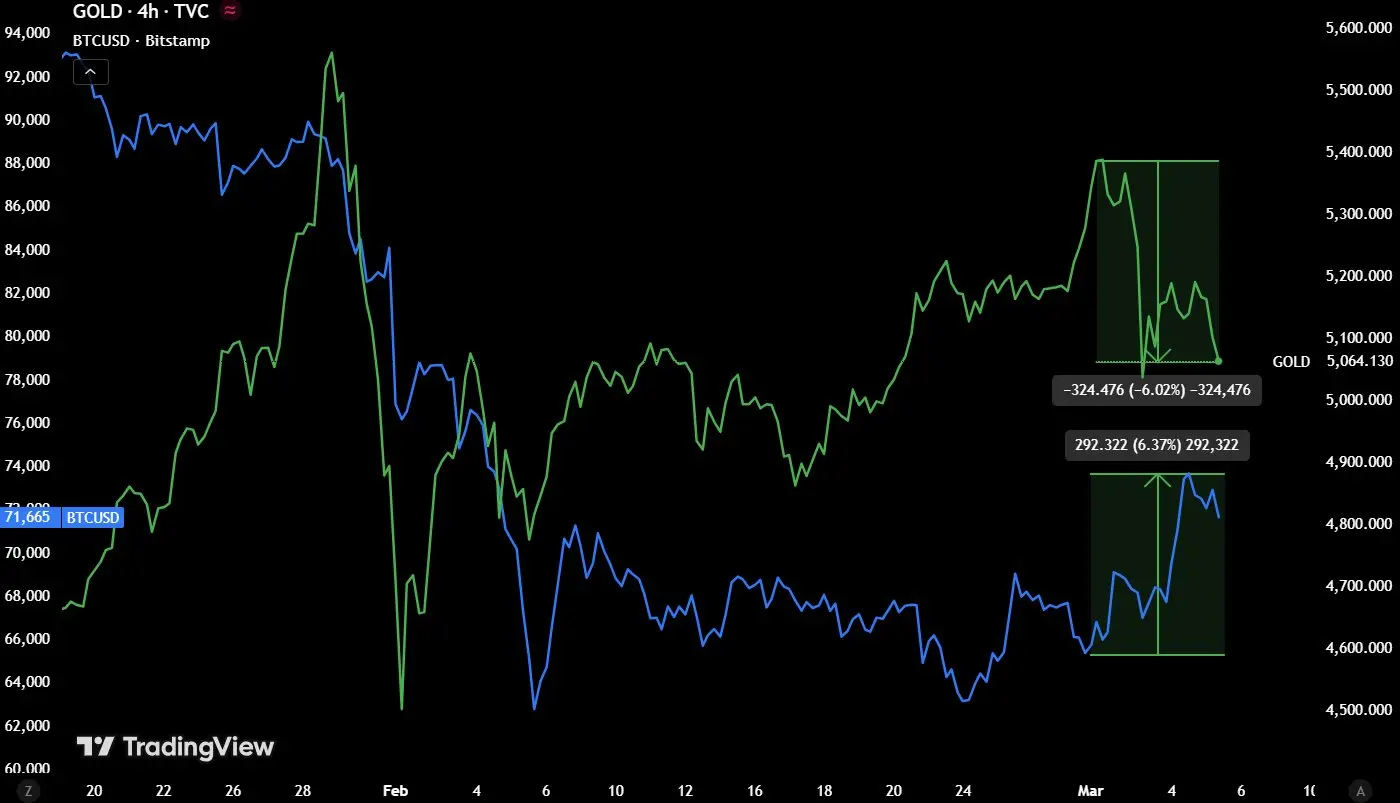
🧠 C) Correlation with Other Markets
One major shift in 2026 is how Bitcoin behaves relative to traditional markets:
BTC’s correlation with the S&P 500 has strengthened, meaning Bitcoin moves more with equities than acting as an independent asset.
This behavior indicates Bitcoin is being priced more as a risk asset than a safe haven.
When equities sell off (risk‑off), BTC tends to fall too. When risk appetite returns, BTC often rallies.
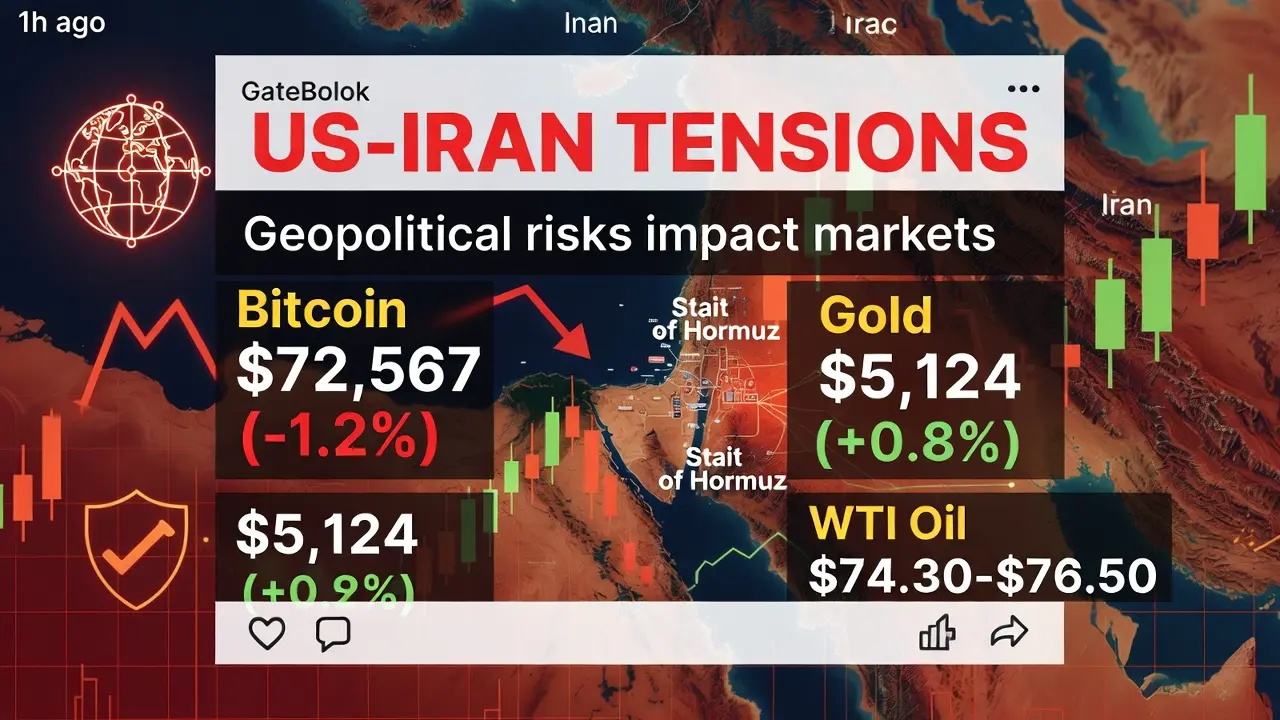
🌍 3) Geopolitical Stress & Macro Forces
The Middle East conflict, particularly the US‑Israel vs Iran tension and Strait of Hormuz disruption, has created a global macro environment of risk aversion:
👉 These geopolitical events have increased oil prices and inflation fears.
👉 Higher oil and inflation expectations make central banks less likely to cut interest rates — which hurts risk assets like Bitcoin.
Such macro stress forces traders to rotate capital into safer instruments (like Treasuries or cash) and away from higher‑beta assets like BTC.
Yet interestingly, BTC has shown resilience as some traders now see it as a refuge in the absence of better safe havens (or as a hedge against traditional banking risk). This has created local rebounds when tension spikes, especially if investors believe conflict won’t escalate further.
📈 4) Institutional Activity & Flows
Institutional players are one of the most important forces shaping Bitcoin in 2026.
✔ Large spot ETF inflows — including significant purchases of BTC — are happening even amid volatility.
✔ Some market reports indicate hundreds of millions in inflows into spot Bitcoin ETFs, suggesting institutions see current prices as attractive.
Institutional accumulation can buoy prices even when retail sentiment is weak, which may explain why Bitcoin didn’t crash below $60k with sustained conviction.
📊 5) Scenario Roadmap — Where BTC Could Go
Traders are essentially watching three main scenarios unfold, each carrying its own narrative:
🌟 BULLISH SCENARIO
Bitcoin stabilizes above current consolidation levels and breaks above $72k–$75k with conviction.
Key supporting conditions: ✔ More ETF inflows
✔ Macro risk appetite improves
✔ Equities rebound — lifting risk assets
Under this scenario: ➡ BTC could test $80k → $90k → psychological resistance zones again
➡ $100k+ becomes a long‑term target
This scenario relies on renewed risk appetite and real demand returns, not just technical bounces.
🌀 RANGE‑BOUND / UNCERTAIN SCENARIO
BTC continues to oscillate inside the $62k–$75k range for months, consolidating while the wider market digests macro uncertainty.
Here, price action is driven by: 🔹 Short‑term trades
🔹 Macro headlines
🔹 ETF flow spikes
In this chapter, the trend remains neutral until a breakout or breakdown confirms direction.
📉 BEARISH / BREAKDOWN SCENARIO
If support near $62k–$64k breaks decisively:
➡ Price could retest $60k or lower
➡ Next downside targets could be $50k–$55k if broader risk aversion worsens, as some technical patterns suggest.
This scenario occurs when macro stress, geopolitical escalations, and declining demand align — a classic risk‑off collapse.
🧠 6) Trader Mindset — Patterns & Psychology
Traders talk about:
🧠 Support & Resistance Psychology
$70k had been a psychological magnet — many longs and listings were placed near this level.
Breaks below $64k triggered protective stops and forced selling.
Collective trader behavior around these zones creates real pressure on price action.
🧠 Liquidity Sweeps
A lot of price movement is driven not by fundamentals alone, but by liquidity hunts — where price dips to trigger stop losses before reversing.
This explains how sudden moves to $60k can happen even without major news.
🧠 Sentiment “Fear/Greed Extremity”
Periods of extreme fear often coincide with dramatic volatility spikes. Traders often buy the fear dips and sell on spikes — creating choppy ranges.
Behavioral science shows collective fear usually leads to increased volatility before consistency emerges.
📌 7) EXECUTIVE SUMMARY (LONG READ VERSION)
✔ Bitcoin’s move from ~$126k in October 2025 to current ~$68k‑$73k was a multi‑month correction and consolidation.
✔ Trader psychology is split between fear, accumulation, and cautious positioning.
✔ Technical patterns show range‑bound behavior with possible continuation structures.
✔ Macro and geopolitical stress adds complexity, pushing BTC to behave more like a risk asset.
✔ Institutional ETF inflows are offsetting pure downside momentum.
✔ The market is watching $62k–$75k levels as critical pivot zones.
✔ Future direction depends on macro sentiment shifts, ETF flows, and geopolitical developments.