Trade
Basic
Futures
Futures
Hundreds of contracts settled in USDT or BTC
TradFi
Gold
Trade global traditional assets with USDT in one place
Options
Hot
Trade European-style vanilla options
Unified Account
Maximize your capital efficiency
Demo Trading
Futures Kickoff
Get prepared for your futures trading
Futures Events
Participate in events to win generous rewards
Demo Trading
Use virtual funds to experience risk-free trading
Earn
Launch
CandyDrop
Collect candies to earn airdrops
Launchpool
Quick staking, earn potential new tokens
HODLer Airdrop
Hold GT and get massive airdrops for free
Launchpad
Be early to the next big token project
Alpha Points
Trade on-chain assets and enjoy airdrop rewards!
Futures Points
Earn futures points and claim airdrop rewards
Investment
Simple Earn
Earn interests with idle tokens
Auto-Invest
Auto-invest on a regular basis
Dual Investment
Buy low and sell high to take profits from price fluctuations
Soft Staking
Earn rewards with flexible staking
Crypto Loan
0 Fees
Pledge one crypto to borrow another
Lending Center
One-stop lending hub
VIP Wealth Hub
Customized wealth management empowers your assets growth
Private Wealth Management
Customized asset management to grow your digital assets
Quant Fund
Top asset management team helps you profit without hassle
Staking
Stake cryptos to earn in PoS products
Smart Leverage
New
No forced liquidation before maturity, worry-free leveraged gains
GUSD Minting
Use USDT/USDC to mint GUSD for treasury-level yields
More
EarnMoneyAndEatMeat
Gate TradFi Asset Points Carnival Week
March 5, 08:00 – March 11, 08:00 (UTC+8)
Double Trading Points for TradFi Assets
Conversion factor increased from 0.2 to 0.4 during the event
Double points bonus for the same trading volume
📄 Event Announcement: https://www.gate.com/announcements/article/50059
🚀 Join Now: https://www.gate.com/futures/points
View OriginalMarch 5, 08:00 – March 11, 08:00 (UTC+8)
Double Trading Points for TradFi Assets
Conversion factor increased from 0.2 to 0.4 during the event
Double points bonus for the same trading volume
📄 Event Announcement: https://www.gate.com/announcements/article/50059
🚀 Join Now: https://www.gate.com/futures/points

- Reward
- like
- Comment
- Repost
- Share
All CT is $gay and retarded
This meme suits most.
This meme suits most.
- Reward
- like
- Comment
- Repost
- Share
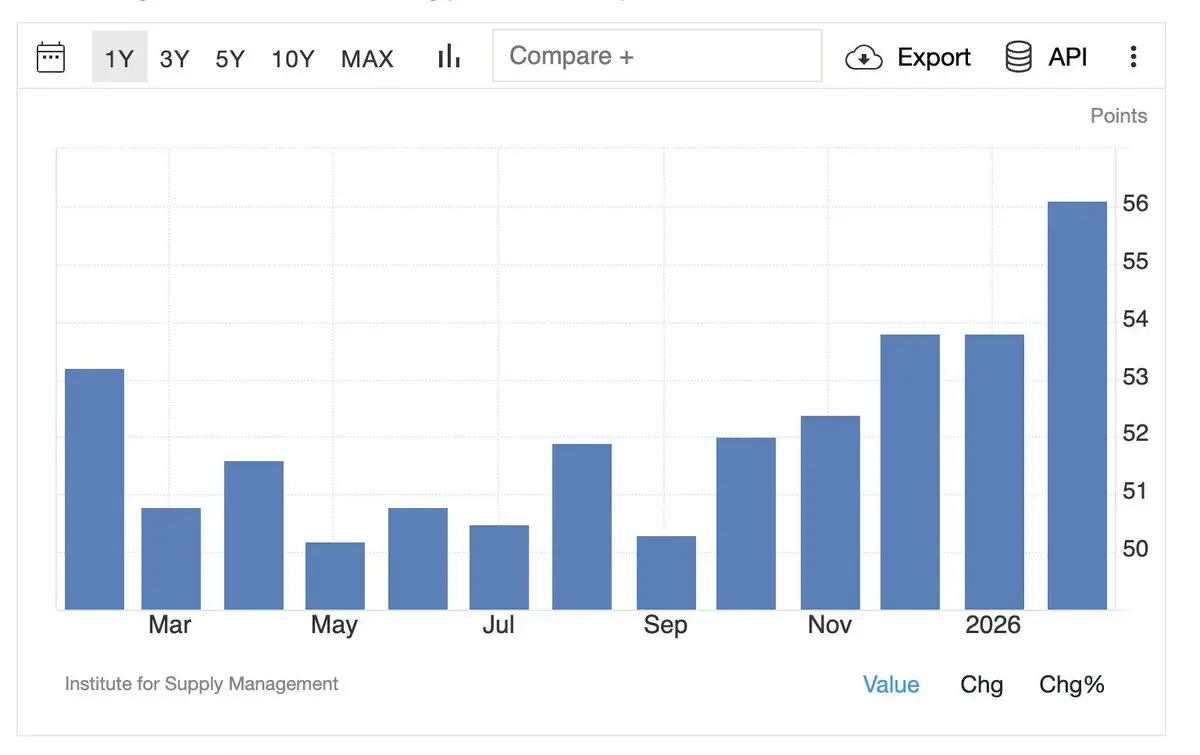
Everyone is underpricing this.
Overall ISM has now been in expansion for 2 months...
And we just had a MASSIVE beat on ISM services for Feb, coming in at 56.1, when only 53.8 was expected.
As I keep telling you all... we are in expansion.
But everyone is so bearish, they literally cannot see all the data showing its hand very clearly.
Every month I get someone tell me "next month it will drop"...
But it doesn't work like that.
Its cyclical.
We are expanding and to bet on a prolonged bear market in economic expansion is just stupid.
- Reward
- 1
- Comment
- Repost
- Share
PAMPABILL
THE PAMPA BULL
Created By@gatefunuser_773c
Listing Progress
0.00%
MC:
$2.43K
More Tokens
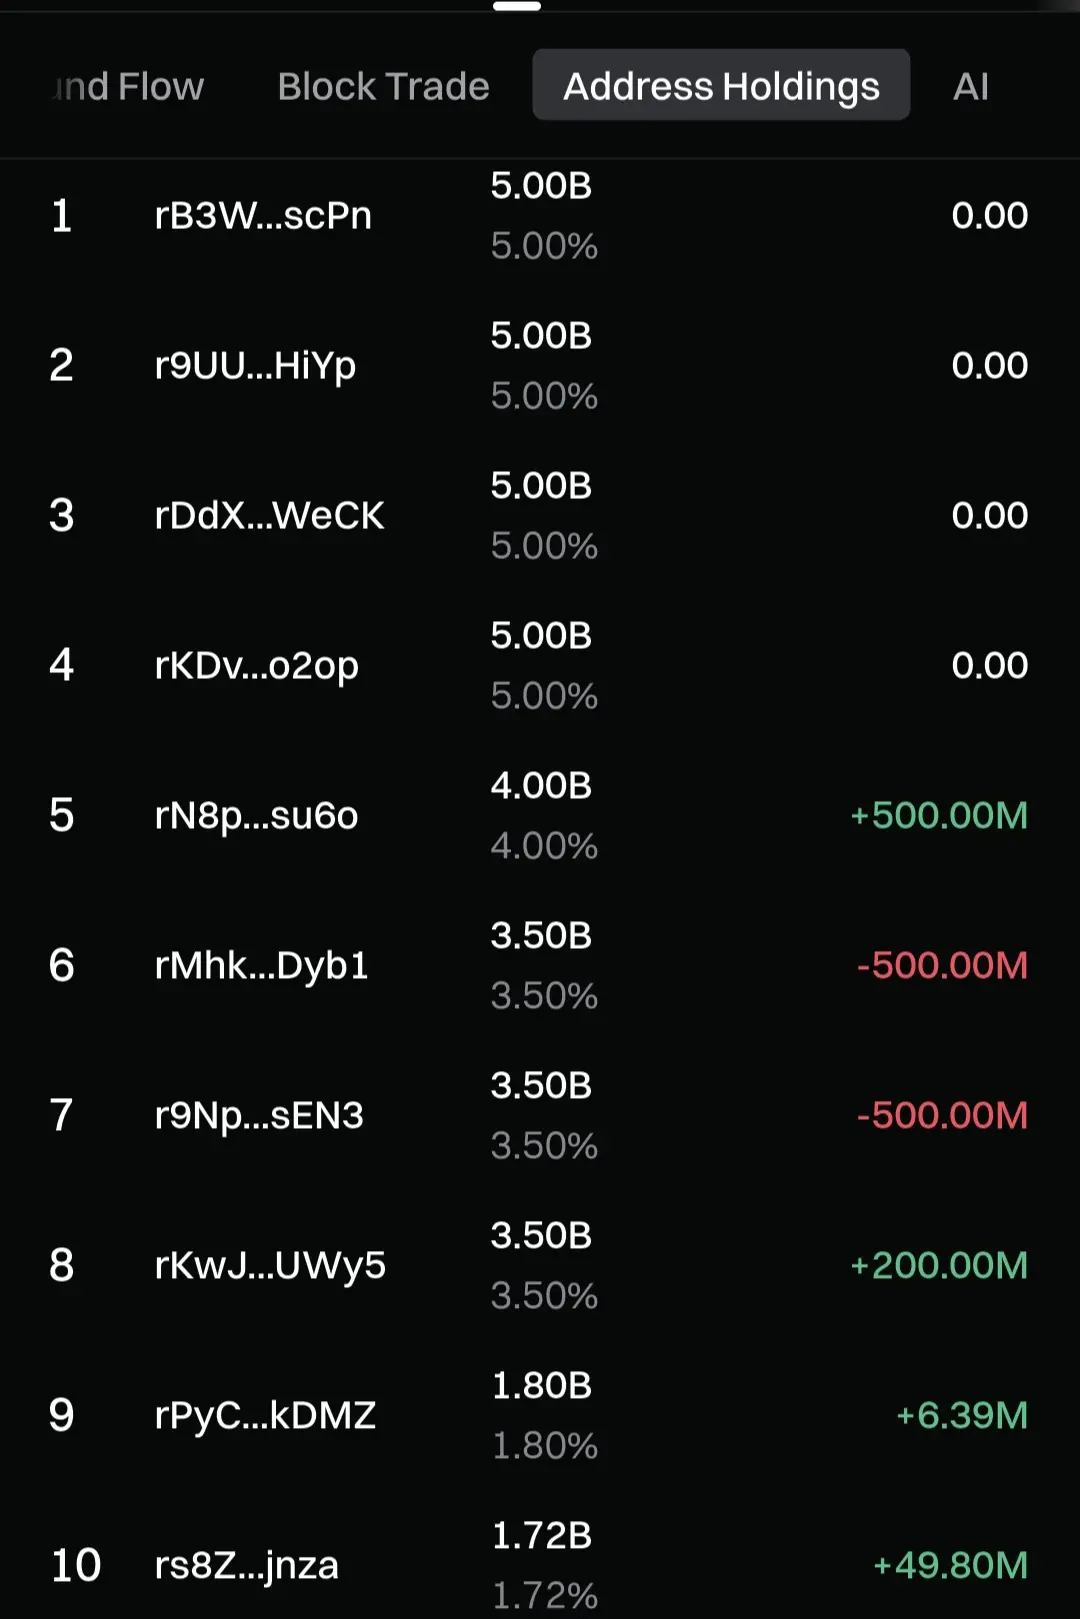
$XRP it turns out that the top 5 to 10 bookies and their insiders have been active.
last time i looked top 1 to 10 were all still 5B.
Perhaps they coordinated with each other to split it into various wallets that were easy to print and easy to hide, like the case of the crook last year who ran off with 3 million and split it into hundreds of wallets. This kind of speculative world has also become a place for people to kill each other in this era. 🤡👍
XRP4,69%
- Reward
- like
- Comment
- Repost
- Share
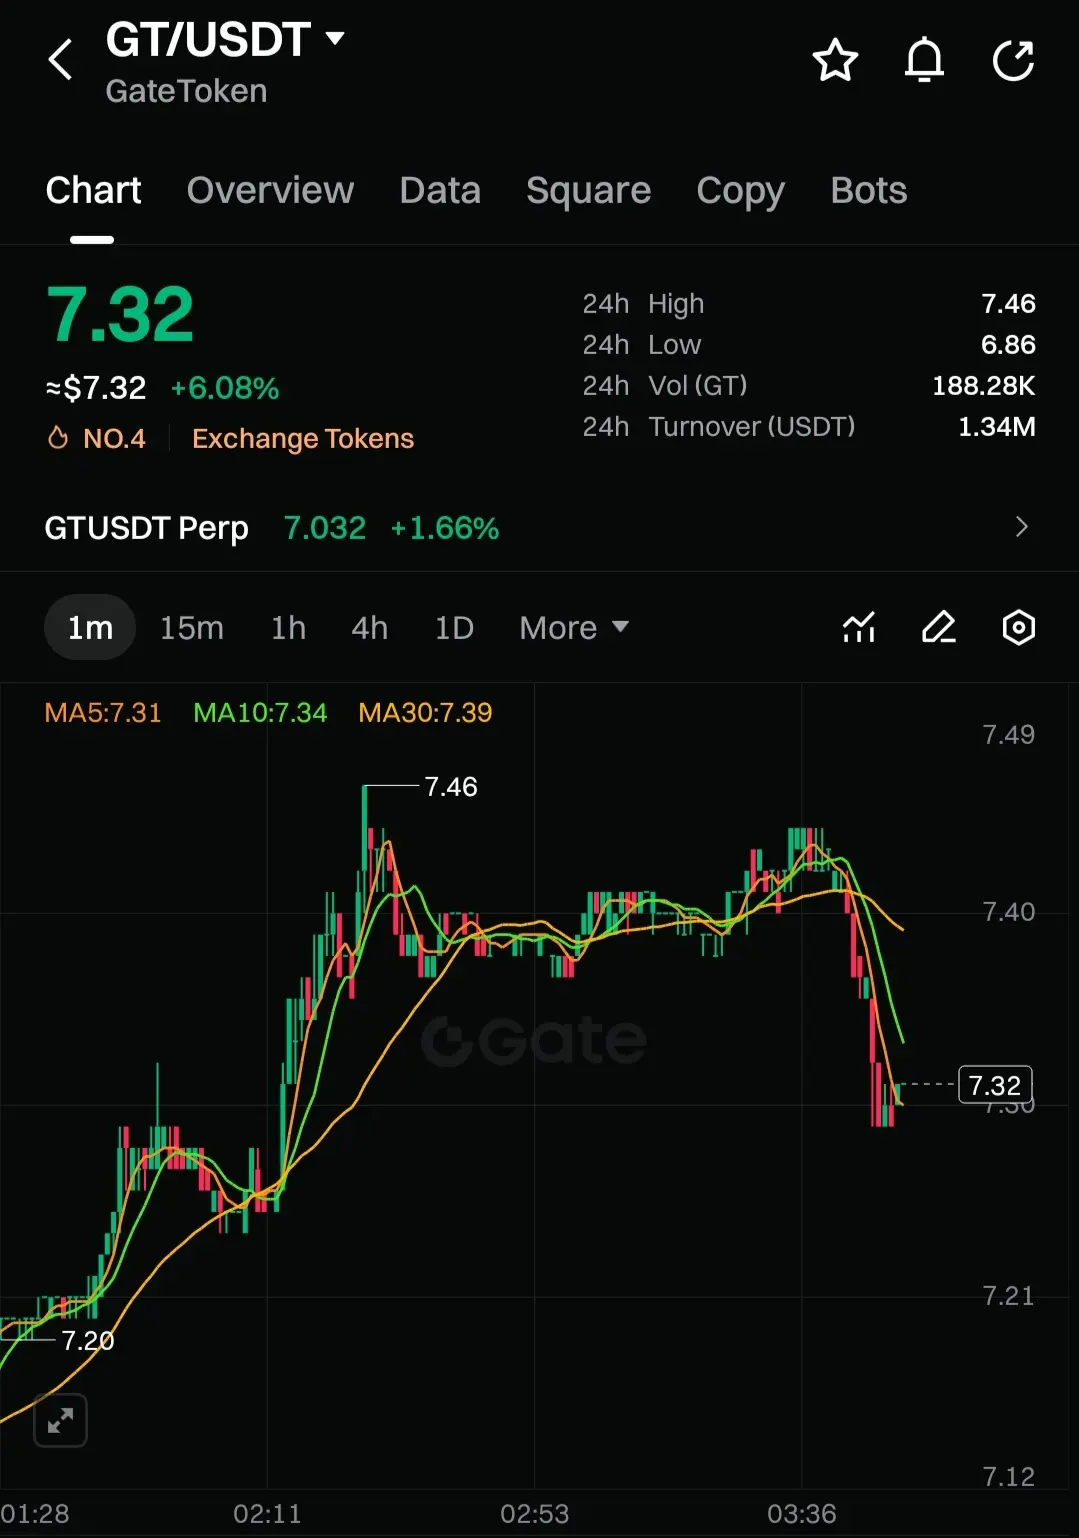
Just checked $GT it’s trading around $7.32 USD. Honestly, that feels like a solid 6.08% gain after the recent dip either the market’s pulling a surprise rebound, or the price has moved past your expected entry.
Right now, I’d lean cautiously: this doesn’t feel like a quick pump play…more like a move you watch if you believe in its long‑term momentum. But unless there’s a fresh catalyst, I wouldn’t go all in. .
#GT #Rmj-Trades
Right now, I’d lean cautiously: this doesn’t feel like a quick pump play…more like a move you watch if you believe in its long‑term momentum. But unless there’s a fresh catalyst, I wouldn’t go all in. .
#GT #Rmj-Trades
GT5,49%
- Reward
- like
- Comment
- Repost
- Share
Remember: your opponent is not the market, but that hopeful, emotionally out of control version of yourself.
View Original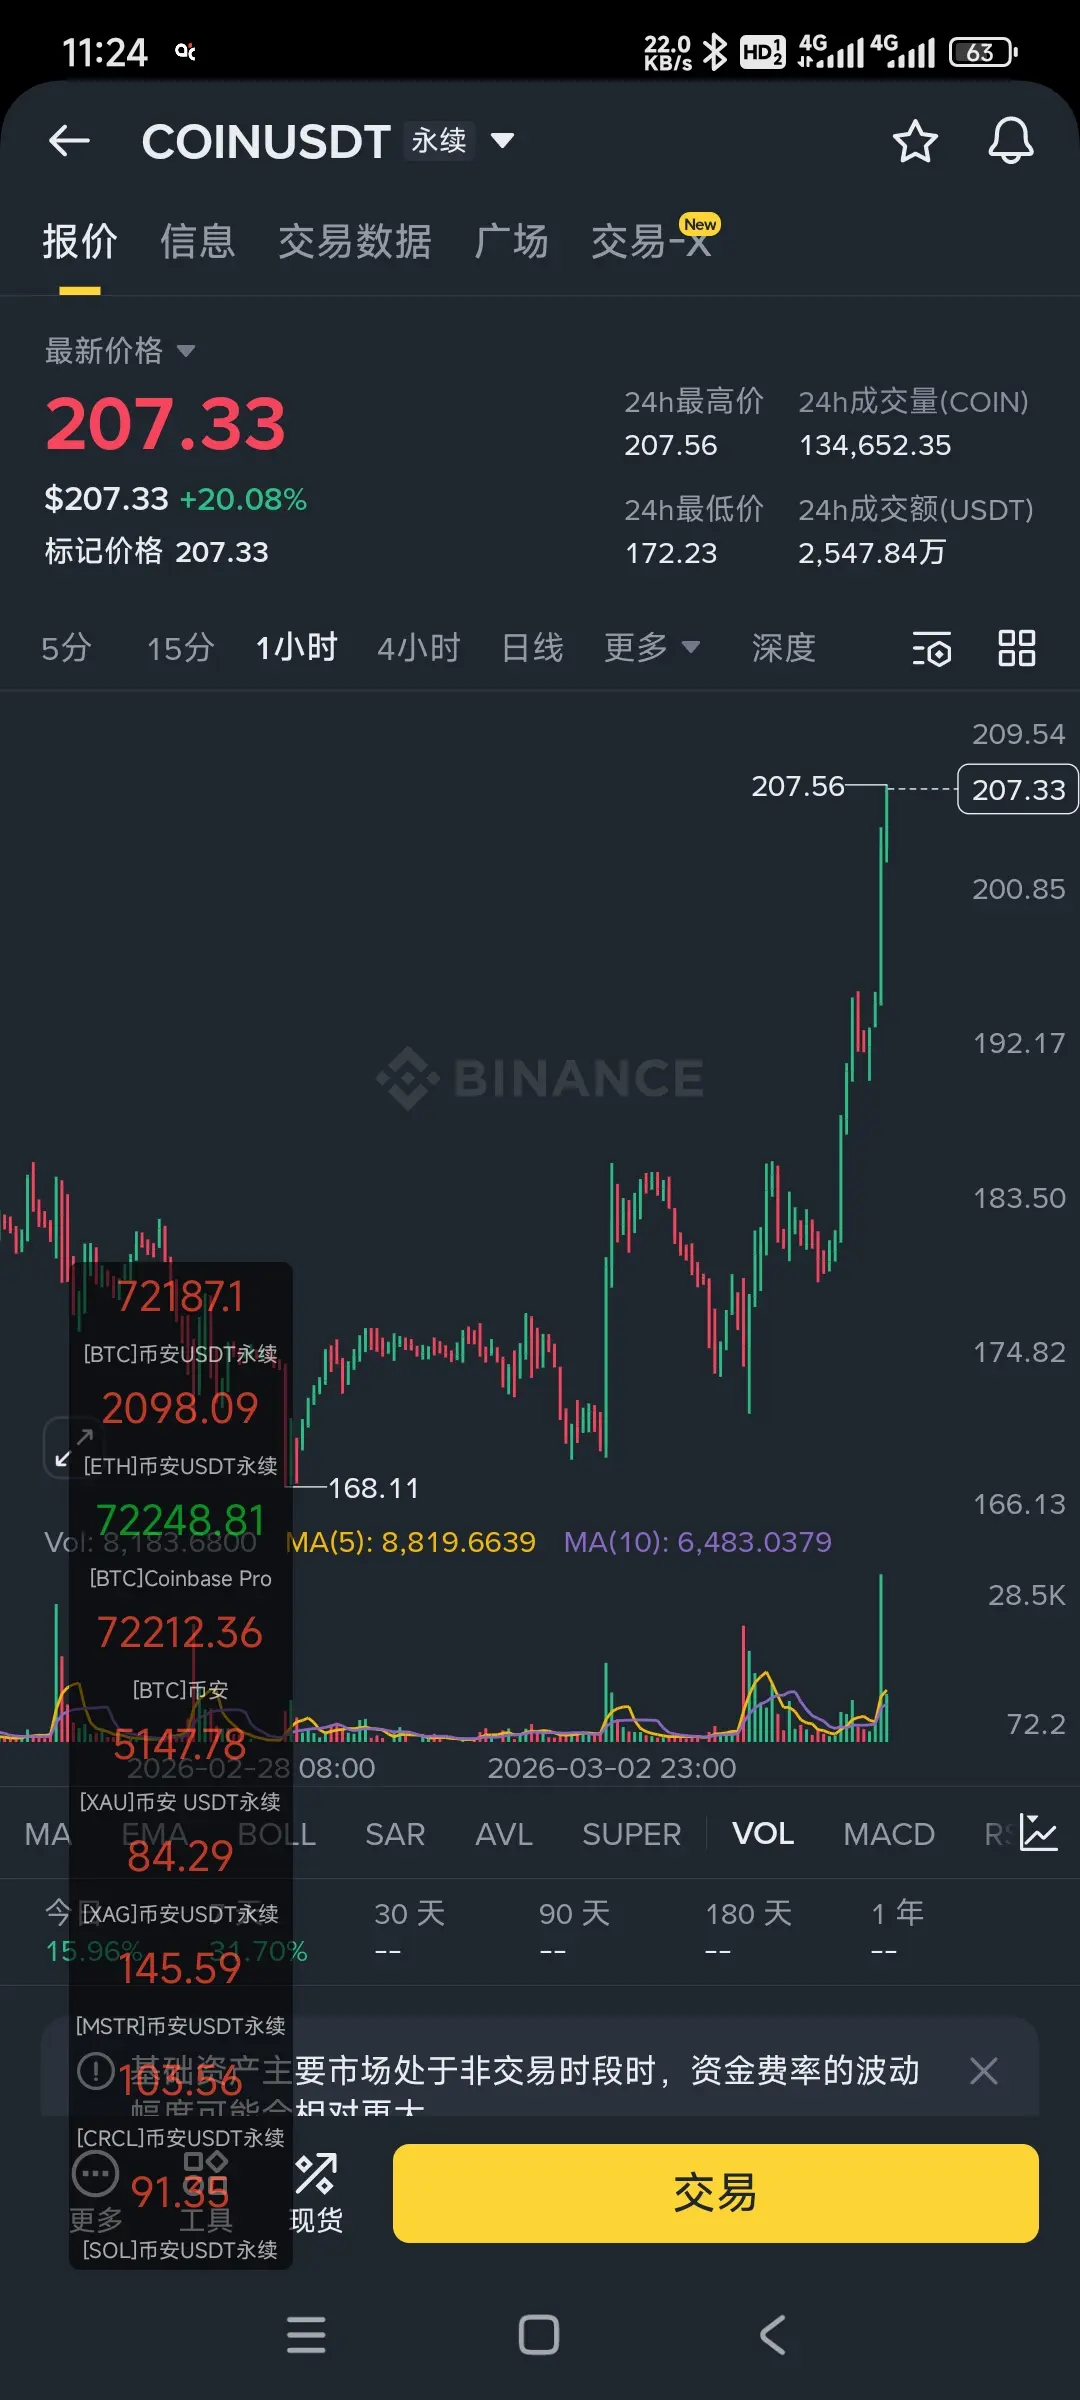
- Reward
- like
- Comment
- Repost
- Share
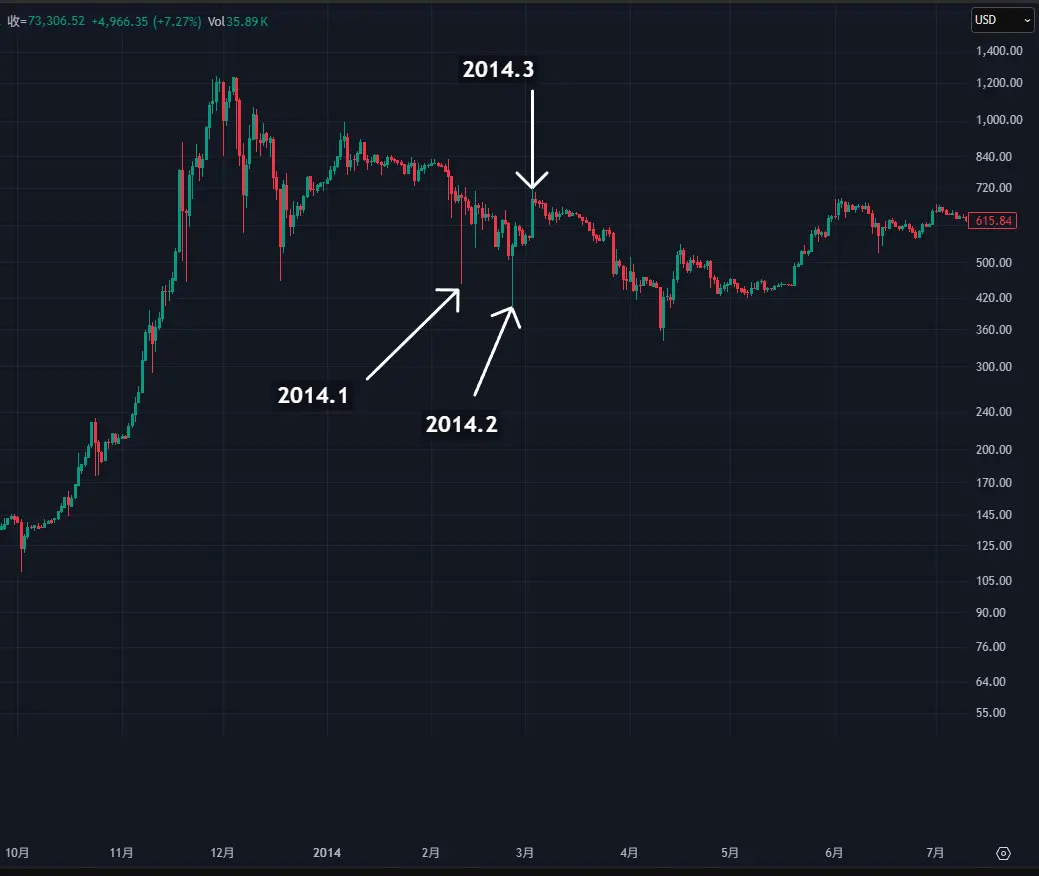
Reviewing and breaking out in a cold sweat😱😱😱
Is this world really virtual?
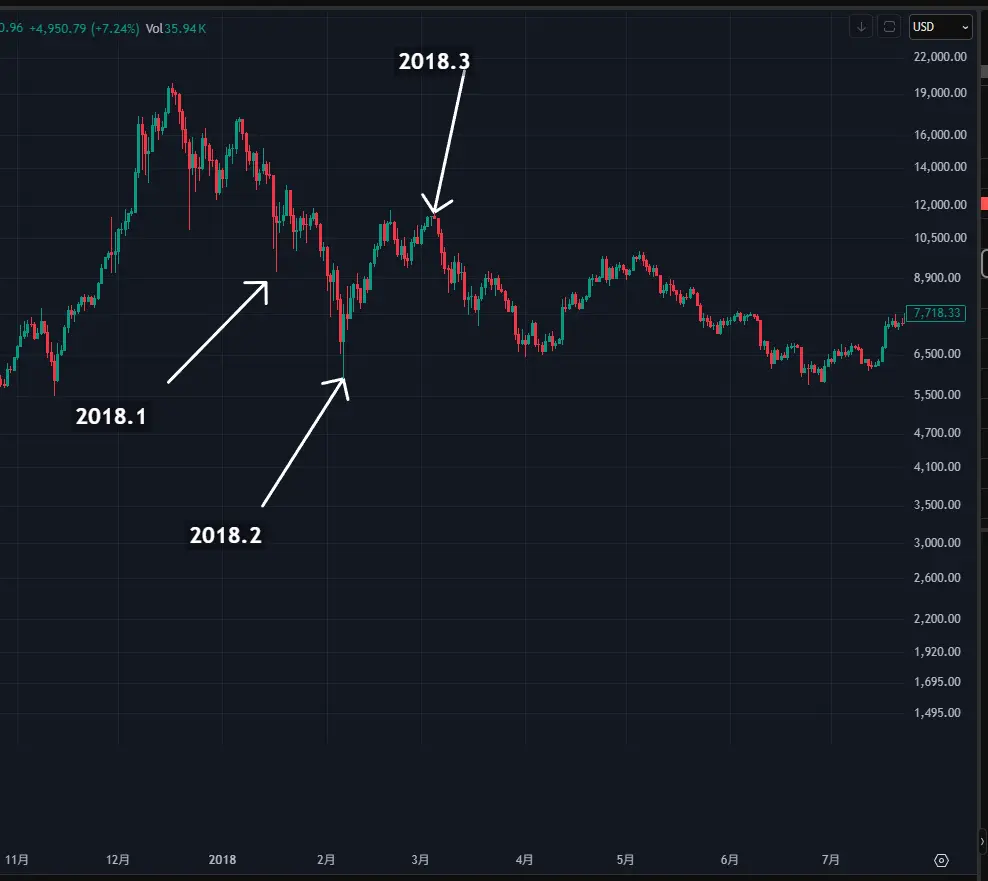
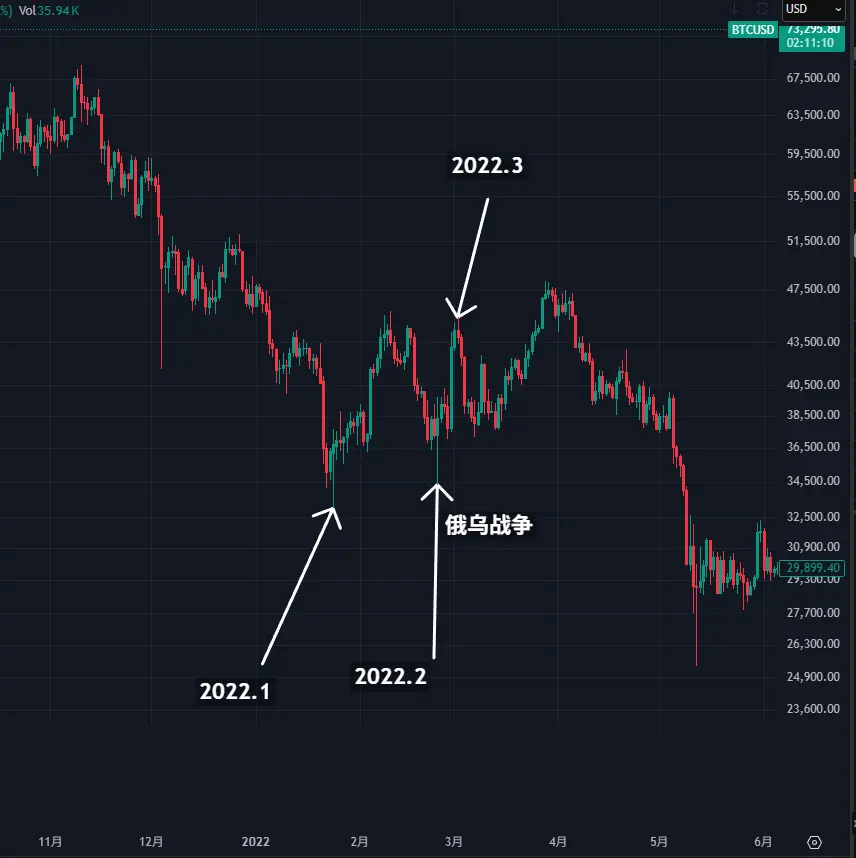
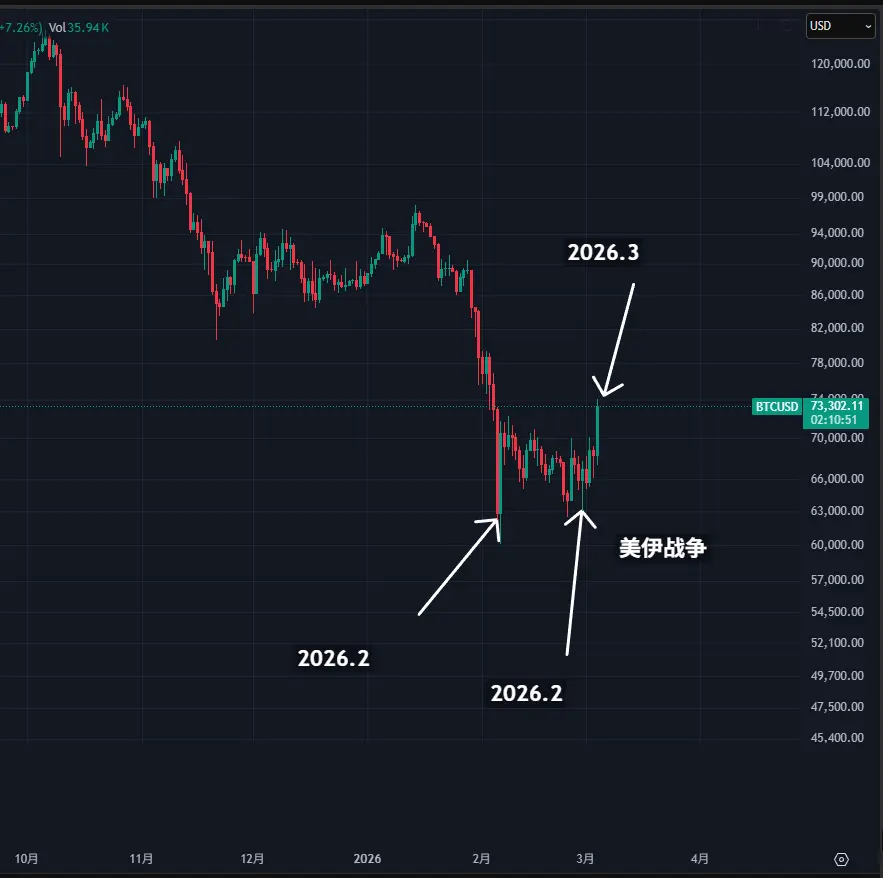
The two lowest points during each correction are in January and February, followed by a high point in early March?
A rebound hits a high point and then a waterfall?
I'm trapped in the matrix!
View OriginalIs this world really virtual?
The two lowest points during each correction are in January and February, followed by a high point in early March?
A rebound hits a high point and then a waterfall?
I'm trapped in the matrix!
- Reward
- like
- Comment
- Repost
- Share
Fear and Greed Index plunges to 10 Extreme Fear persists for nearly a month has the sentiment bottomed out?
0
- Reward
- 1
- 1
- Repost
- Share
AylaShinex:
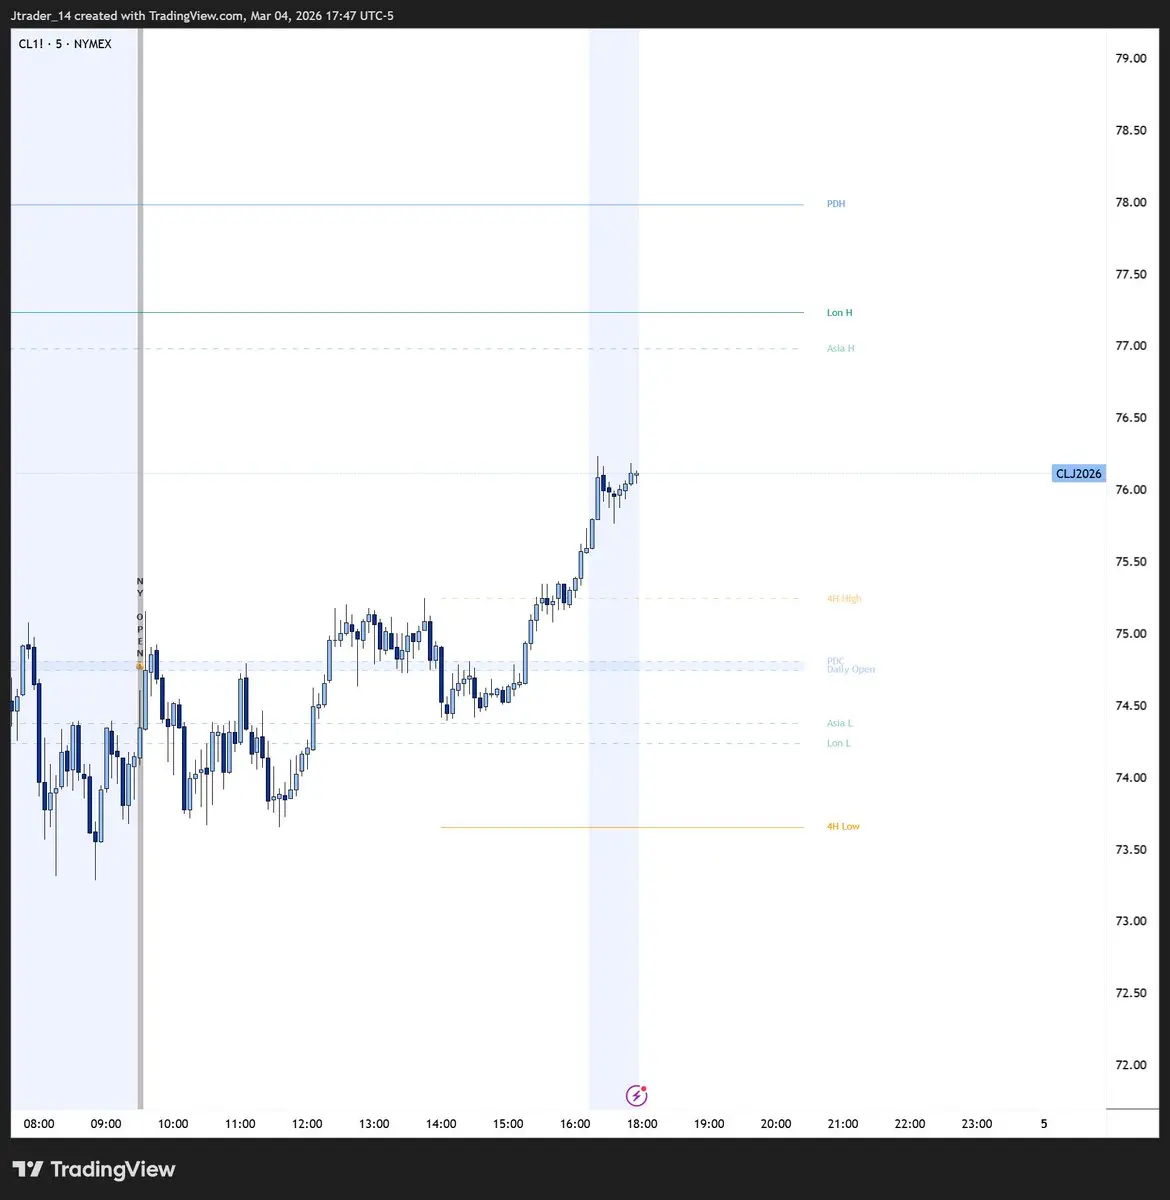
2026 GOGOGO 👊I built an indicator called J Trader Levels.
It automatically maps the key liquidity reference points i use to trade:
• PDH, PDL, PDC, 6PM EST Open
• Previous Week High/Low + Monday High/Low
• Asia & London session highs/lows (custom windows)
• Previous 4H High/Low
• Daily gap (PDC → 6PM Open)
• 9:30 ET NY Open vertical marker
What makes it different is the logic.
Each level updates in real time:
Untouched = solid line
Tapped = dashed + faded instantly
You can immediately see which levels are still active and which have been swept.
Every level has its own first-touch alert (fires once only).
V
- Reward
- like
- Comment
- Repost
- Share
Imagine getting your fighter jet blown out of the sky and still smiling like this afterwards. INSANE.

- Reward
- like
- Comment
- Repost
- Share
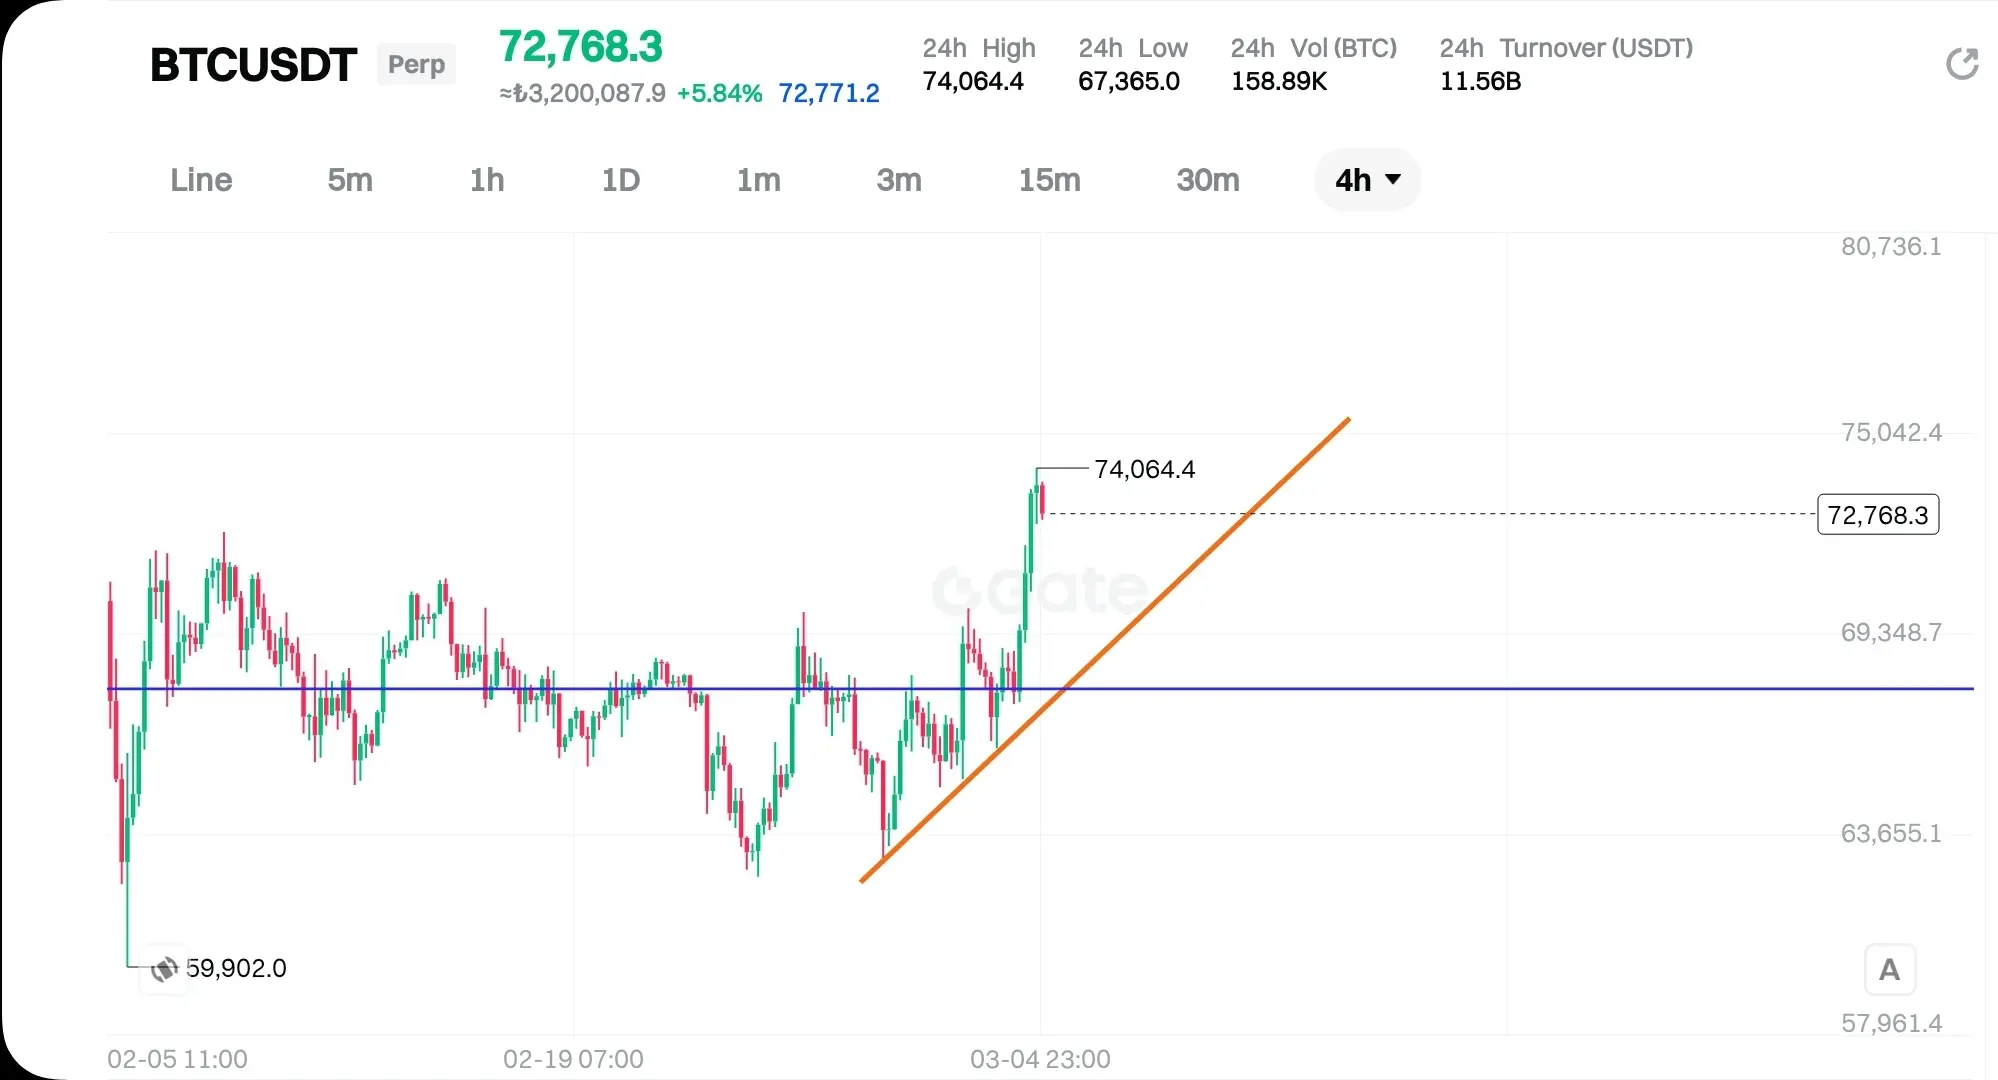
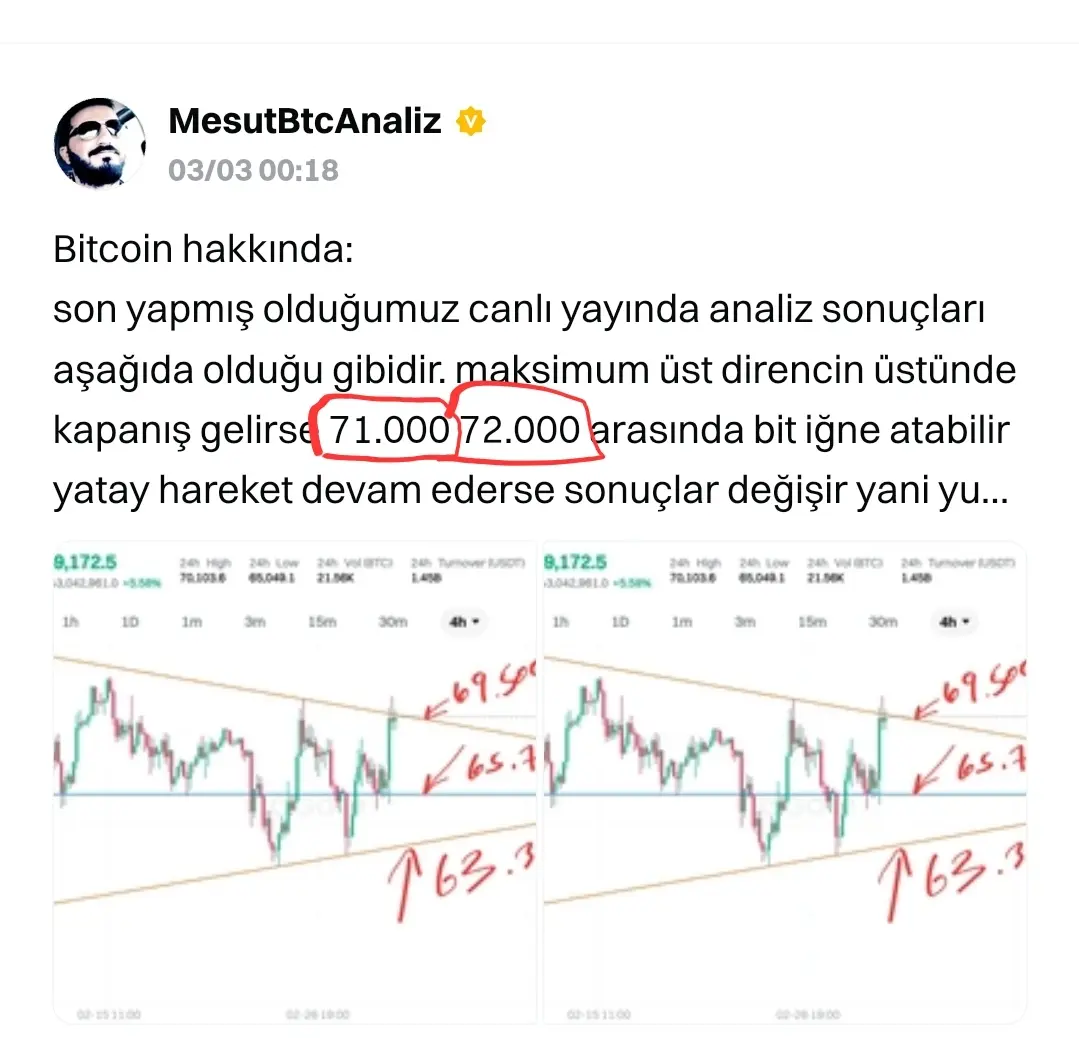
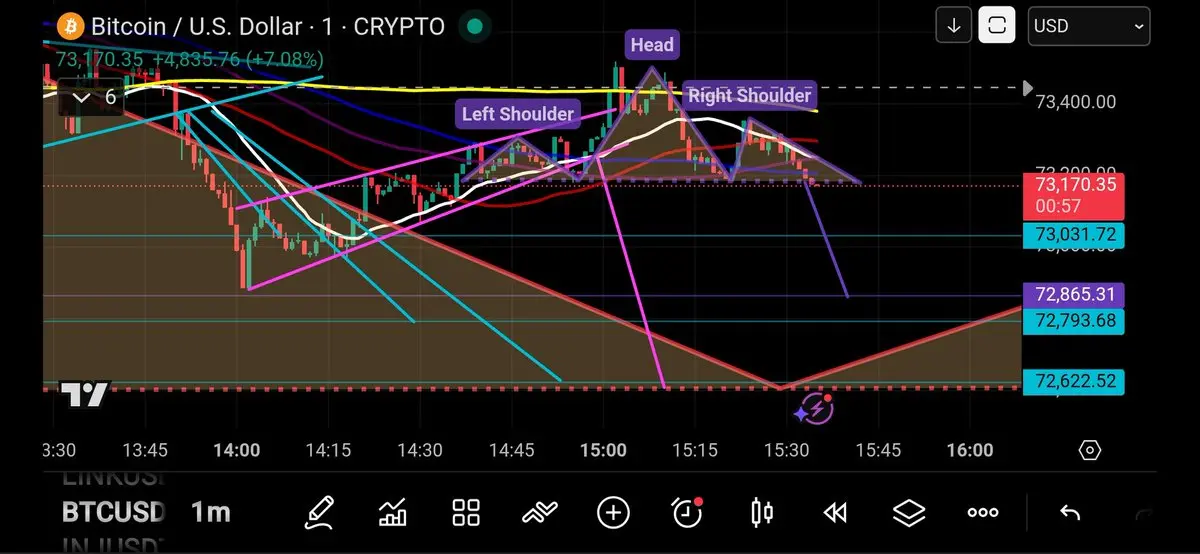
Technical Chart Analysis of Bitcoin
We last said that it could reach 71,000 and 72,000, and a few days ago we explained in a live broadcast that there might be a liquidation of $75,000 accumulated positions. The current positions are shown below. The only change is the extension of the sideways movement process. Looking at the indicators from here, there is potential for the indicators to rise to as high as $80,000 and $78,800. These increases are the final maximum target before a decline. There is no definite rise; only market manipulations suggest that a new upward and downward chart will
View OriginalWe last said that it could reach 71,000 and 72,000, and a few days ago we explained in a live broadcast that there might be a liquidation of $75,000 accumulated positions. The current positions are shown below. The only change is the extension of the sideways movement process. Looking at the indicators from here, there is potential for the indicators to rise to as high as $80,000 and $78,800. These increases are the final maximum target before a decline. There is no definite rise; only market manipulations suggest that a new upward and downward chart will
- Reward
- like
- Comment
- Repost
- Share
Bitcoin has shown its strength again, surpassing $73,000 amidst very high global risks. It has also seen a rise in some altcoins, with Ethereum and Solana experiencing increases of up to 10%. We could see much sharper increases when global risks ease. Strong projects will shape the future.
#Bitcoin #Crypto #Altcoins #Bullish #CryptoMarketBouncesBack $BTC
#Bitcoin #Crypto #Altcoins #Bullish #CryptoMarketBouncesBack $BTC
BTC5,87%

MC:$41.63KHolders:175
100.00%
- Reward
- 1
- Comment
- Repost
- Share
TR
TR
Created By@GateUser-2e70c2ab
Listing Progress
0.00%
MC:
$0.1
More Tokens
#BitcoinBouncesBack
This is the moment when BTC rises.
But I feel this is just a trick..
I'm sure it will drop sharply back down..$BTC
This is the moment when BTC rises.
But I feel this is just a trick..
I'm sure it will drop sharply back down..$BTC
BTC5,87%

- Reward
- like
- Comment
- Repost
- Share
- Reward
- 1
- Comment
- Repost
- Share
- Reward
- like
- Comment
- Repost
- Share
Ethereum Foundation releases a seven-year roadmap: 7 forks by the
473
- Reward
- like
- Comment
- Repost
- Share
📊 Crossover Markets announced that Tradeweb Markets is leading a $31 million Series B funding round, valuing the ECN #platform at about $200 million. Participants include DRW Venture Capital, Illuminate Financial, Ripple, Virtu Financial, Wintermute Ventures, and XTX Markets. Tradeweb plans to route its institutional clients’ spot #crypto #trading orders to the #platform using its algorithmic #trading technology. Free Academy & VIP Access
#crypto
#crypto

- Reward
- like
- Comment
- Repost
- Share
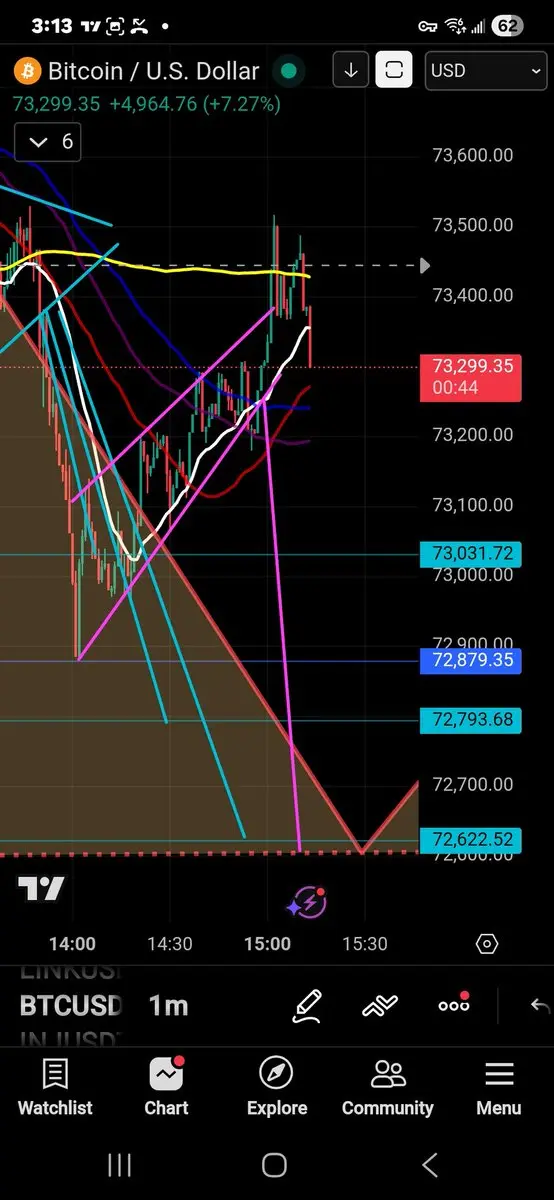
Nice double top for a quick short play on 1 min 200MA rejection. 🔥
- Reward
- 1
- Comment
- Repost
- Share
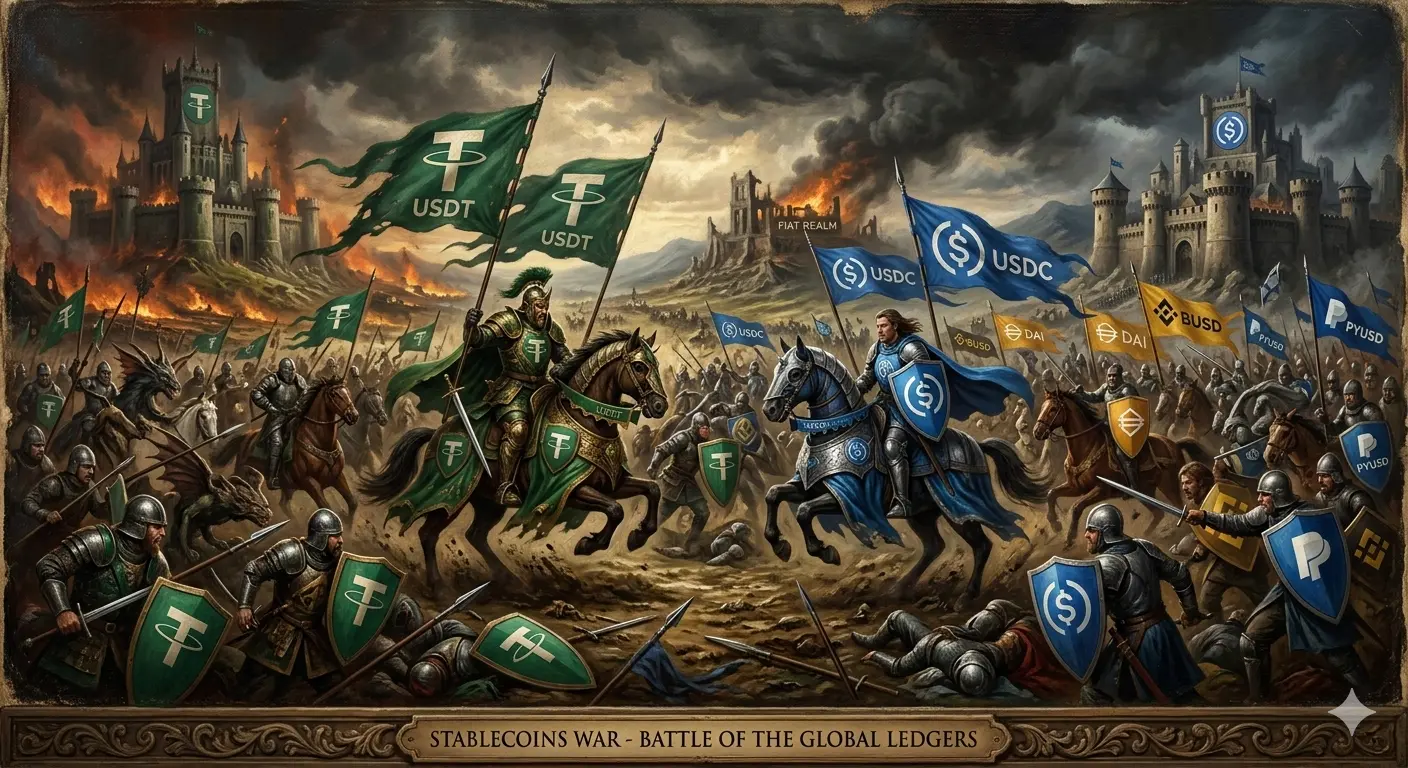
The Two Faces of the Digital Dollar 🎭
Power Struggle and the Quest for Return 💪
The financial world has been undergoing a quiet but profound transformation in recent years. The US dollar, the king of paper money in our pockets, is being squeezed from two different fronts in the digital arena from an unexpected direction. This is not just a power struggle between technology companies and governments, but also a grand chess game that will determine what the future of money will look like.
On the first front of the game, there is a global power struggle. On one side stand stablecoins, led by gi
- Reward
- 15
- 14
- Repost
- Share
boş_adam1 :
:
To The Moon 🌕View More
Load More
Join 40M users in our growing community
⚡️ Join 40M users in the crypto craze discussion
💬 Engage with your favorite top creators
👍 See what interests you
Trending Topics
View More309.83K Popularity
129.87K Popularity
191.38K Popularity
18.87K Popularity
417.04K Popularity
News
View MoreThe world's largest gold ETF holdings decreased significantly by 18 tons in a single day
3 m
Data: 930 BTC transferred from an anonymous address, then routed through a relay and sent to another anonymous address
12 m
TradFi上涨提醒:NAS100上涨超1.5%
43 m
The U.S. Senate did not pass the vote to stop Trump's strike against Iran
46 m
Zerohash applies for a license from the U.S. National Trust Bank
47 m
Pin