Trade
Basic
Futures
Futures
Hundreds of contracts settled in USDT or BTC
TradFi
Gold
Trade global traditional assets with USDT in one place
Options
Hot
Trade European-style vanilla options
Unified Account
Maximize your capital efficiency
Demo Trading
Futures Kickoff
Get prepared for your futures trading
Futures Events
Participate in events to win generous rewards
Demo Trading
Use virtual funds to experience risk-free trading
Earn
Launch
CandyDrop
Collect candies to earn airdrops
Launchpool
Quick staking, earn potential new tokens
HODLer Airdrop
Hold GT and get massive airdrops for free
Launchpad
Be early to the next big token project
Alpha Points
Trade on-chain assets and enjoy airdrop rewards!
Futures Points
Earn futures points and claim airdrop rewards
Investment
Simple Earn
Earn interests with idle tokens
Auto-Invest
Auto-invest on a regular basis
Dual Investment
Buy low and sell high to take profits from price fluctuations
Soft Staking
Earn rewards with flexible staking
Crypto Loan
0 Fees
Pledge one crypto to borrow another
Lending Center
One-stop lending hub
VIP Wealth Hub
Customized wealth management empowers your assets growth
Private Wealth Management
Customized asset management to grow your digital assets
Quant Fund
Top asset management team helps you profit without hassle
Staking
Stake cryptos to earn in PoS products
Smart Leverage
New
No forced liquidation before maturity, worry-free leveraged gains
GUSD Minting
Use USDT/USDC to mint GUSD for treasury-level yields
More
Structure Selection During Consolidation: Bitcoin Range Trading and HYPE Wave Opportunities | Special Analysis
Hello, I am your old friend, Odaily’s exclusive market analyst Cody. Today is the seventh day of the Lunar New Year, and the Spring Festival holiday is basically coming to an end.
From the market performance, this week’s trend is similar to the analysis in our previous article—the pace is relatively slow, mainly oscillating, with no clear directional volatility.
Bitcoin has mainly traded within the 65,500 to 70,000 USD range over the past week. The overall price structure remains in a consolidation phase, neither effectively breaking through the upper resistance nor showing signs of further weakening with increased volume on the downside.
In this context, it’s more appropriate this week not to rush to judge the trend direction but to observe the structural changes within the oscillation range.
It is during this “slowing down of mainstream asset momentum” phase that we can extend our view to some assets with relatively independent structures.
Therefore, in this week’s article, we will introduce a new coin analysis—HYPE—and, based on a completed short-term practical operation, analyze its current position and potential trading opportunities from daily and wave perspectives.
Weekly Trading Report Key Summary:
• Short-term strategy execution (effectiveness verification): Based on strategy discipline, since Bitcoin’s price did not reach the predicted resistance zone, we did not perform short-term trades last week.
• Mid-term strategy execution (effectiveness verification): Bitcoin followed the established mid-term strategy last week, continuing to hold a short position built at around $89,000 (1x leverage). As of last week’s close, profit was approximately 24.01%, with a maximum profit of about 32.58%.
• Core short-term view verification: Last week, Bitcoin oscillated between $65,500 and $70,000. The current trend aligns with our previous forecast of a range-bound market.
• HYPE: Structural analysis and short-term trading opportunities. (See detailed explanation in Chart 1)
Below, we will review the market forecast, strategy execution, and specific trading process in detail.
1. HYPE Structure Analysis and Short-term Trading Review:
HYPE Daily K-line Chart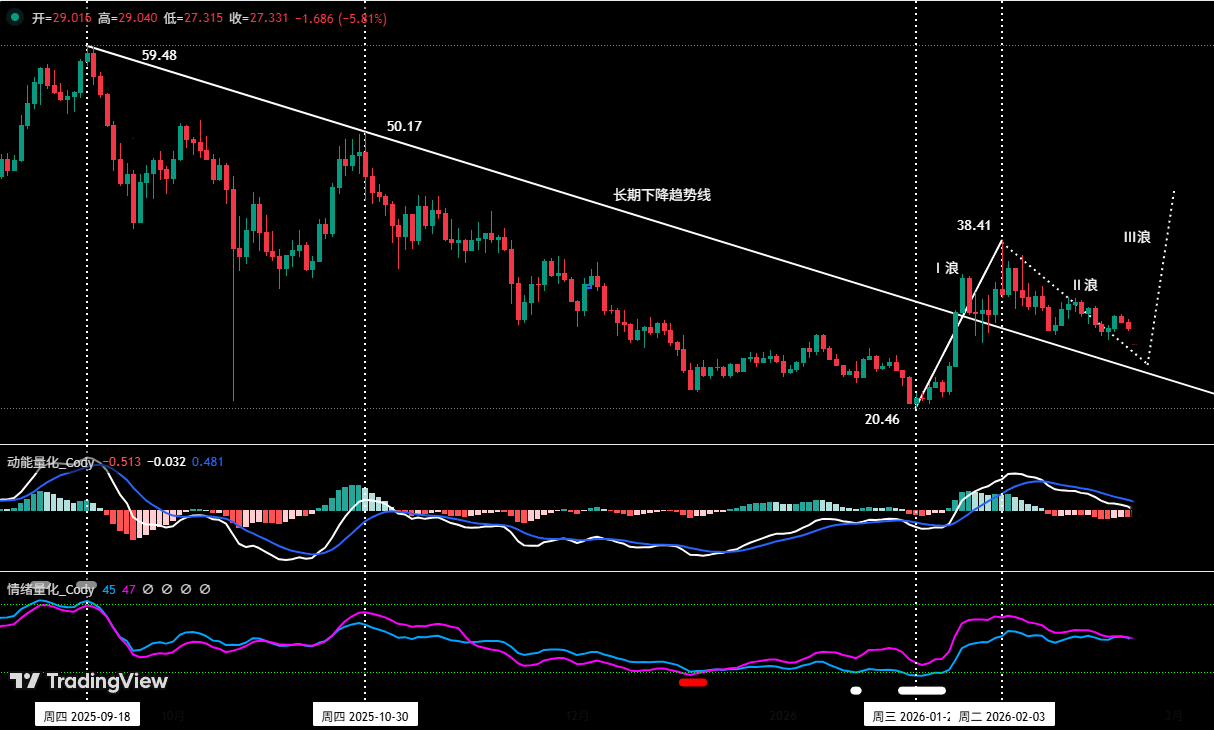
Chart 1
1. Daily Chart Structural Framework (see Chart 1)
Since stabilizing near $20.46 on January 21, 2026, HYPE has entered an independent oscillating upward trend. Currently, the price has confirmed a breakout of the long-term downtrend line connecting the highs of September 2025 (about $59.48) and October 2025 (about $50.17), indicating a possible shift from the previous bearish structure.
The daily trend structure can be preliminarily divided as follows (based on price action after January 21):
• Wave I (Driving Wave): From January 21 ($20.46) to February 3 ($38.41), completing an upward wave.
Wave I bottom signal: Through a self-constructed quantitative model analysis, at the end of Wave I (around January 21), the following signals appeared simultaneously:
• Momentum Quantitative Model: Showing divergence signals.
• Sentiment Quantitative Model: Triggering a bottom warning signal (white horizontal bar in the chart).
The overlay of these signals reinforces the forecast that Wave I formed an important low point at $20.46 on January 21.
• Wave II (Correction Wave): From February 3 ($38.41) to now, representing a correction of Wave I.
Analysis of key confirmation conditions for Wave III:
• Confirmation of Wave III starting point:
• Confirmation of Wave III end point:
2. HYPE Short-term Trading (Long position with 1x leverage)
• Entry decision: Based on the correction after the first upward trend on the 1-hour chart, and after the momentum line in the Momentum Quantitative Model breaks above zero and the first retest occurs, with the price above key support levels.
• Exit decision: Close position when the price approaches the short-term technical resistance near $30.97.
• Trading summary: This operation successfully captured a rebound wave on the hourly level, with a profit of approximately 4.71%.
2. Bitcoin Range-bound Market Continues: (02.16–02.22)
Since Bitcoin did not reach the key resistance zone forecast last week, and our self-developed momentum and spread trading models did not trigger top signals, we strictly followed the established short-term strategy and did not open new positions last week.
Mid-term strategy: Continue holding 60% of the short position built around $89,000 as planned. As of last week’s close, profit was 24.01%.
Resistance zone: $72,000–$74,500
Support zone: around $65,000
3. Technical Indicator Analysis of Bitcoin: Multi-model and Multi-dimensional Comprehensive Assessment
Combining market operation data, I rely on a self-constructed trading system to analyze multiple technical indicators of Bitcoin from multi-model and multi-dimensional perspectives.
Bitcoin Weekly K-line (Momentum + Sentiment Models)
Chart 2
• Momentum Quantitative Model: Technical indicators show the momentum line is trending downward, with negative energy bars expanding for four consecutive weeks, with no divergence signals.
The momentum model indicates: Bitcoin’s downward momentum remains high.
• Sentiment Quantitative Model: Blue sentiment line value is 27, with zero strength; purple sentiment line value is 10, with zero strength; peak value is 0. This suggests the market’s oversold panic sentiment has not yet appeared.
The sentiment model indicates: Bitcoin’s bottom support index is neutral.
• Digital Monitoring Model: No bottom signals detected.
The digital monitoring model shows no bottom signals; last week’s candle closed with a small bearish candle down about 1.73%. The market shows a pattern of “higher lows and lower highs” over three weeks, forming a converging structure.
The above data indicates: Bitcoin’s weekly trend is bearish, but the decline is narrowing, suggesting a high probability of a consolidation or correction phase.
Bitcoin Daily K-line (Momentum + Sentiment Models)
Chart 3
• Momentum Quantitative Model: Last week’s market showed a “narrow sideways consolidation.” After a “golden cross” below zero, the momentum line turned upward, and positive energy bars gradually expanded.
The momentum model indicates: Bullish rebound momentum is being released, requiring observation of energy changes.
• Sentiment Quantitative Model: After triggering a bottom warning signal (white dot) earlier, the sentiment lines turned upward. Currently, blue sentiment value is 20, zero strength; purple sentiment value is 22, zero strength. The two lines are close together, moving out of oversold territory.
The sentiment model indicates: The upward turn of sentiment lines confirms the bottom warning signal; however, the close alignment suggests mid- and short-term buying activity is weak, and rebound strength is limited.
These data suggest: The daily trend remains bearish, but a short-term oversold rebound is ongoing.
4. Market Forecast for This Week: (02.23–03.01)
4-hour Chart of Bitcoin
Chart 4
Using the 4-hour chart as the trading cycle:
• Central zone determination: The current structure suggests a high probability of forming an “upward consolidation” pattern, with the upper resistance around $72,300, and support near $65,100.
• Core analysis and trading plan:
• Scenario 1 (Failure to break through): If subsequent rebound fails to break above the upper boundary of the central zone (~$72,300), the consolidation pattern continues. Trading: consider reducing long positions on rallies.
• Scenario 2 (Successful breakout): If prices break above the central zone successfully, the upward trend is confirmed. Trading: consider holding long positions, waiting for clear exit signals.
• Scenario 3: If prices break below the lower boundary (~$65,100), the support at the February 6 low will be tested again.
Core view this week: Focus on the battle between bulls and bears near the upper and lower boundaries of the central zone. The strategy should adhere to the principle of “reduce positions on rallies (longs), manage risk.”
Key resistance levels:
• First resistance zone: $72,300–$74,500 (near April 2025 low)
• Second resistance zone: $79,500–$80,600 (near B wave initiation point)
• First support: $65,000 (previous candle bottom)
• Second support: $60,000–$62,500 (near February 6 low)
• Third support: $57,400 (around 210-week moving average)
5. Trading Strategy for This Week (excluding unexpected news): (02.23–03.01)
Mid-term strategy: Maintain 60% short positions. If a rebound effectively breaks above $74,500, reduce to 40%.
Short-term strategy: Use 30% of positions with stop-loss orders, based on support and resistance levels, seeking spread trading opportunities (using 30-minute/1-hour cycles).
Since the medium-term market trend is bearish, short-term trading should follow the principle of “trend-following, shorting on rallies.” To adapt dynamically to market evolution and based on signals from our self-built trading models, we propose two short-term plans:
• Plan A: If the price rebounds to near the upper boundary of the central zone (~$72,300):
• Entry: Trigger a short position of about 15% when rebound hits resistance and model signals indicate a top.
• Risk control: Initial stop-loss above $75,500.
• Exit: Gradually close positions near key support levels when signals confirm.
• Plan B: If the price rebounds near $74,500:
• Add to short: Increase short positions by about 15% when resistance and top signals are triggered.
• Risk control: Initial stop-loss above $75,500.
• Exit: Gradually close positions near support levels when signals confirm.
6. Special Reminder:
1. When opening a position: Immediately set an initial stop-loss.
2. When profit reaches 1%: Move stop-loss to the entry price (break-even).
3. When profit reaches 2%: Move stop-loss to 1% profit level.
4. Continuous monitoring: For every additional 1% profit, move the stop-loss up by 1% to protect gains and lock in profits.
Financial markets are highly volatile; all analysis and trading strategies should be dynamically adjusted. All viewpoints, models, and strategies discussed are based on personal technical analysis and are for personal reference only. They do not constitute investment advice or operational guidance. Market risks are inherent; please trade cautiously and do not base decisions solely on this information.**