【
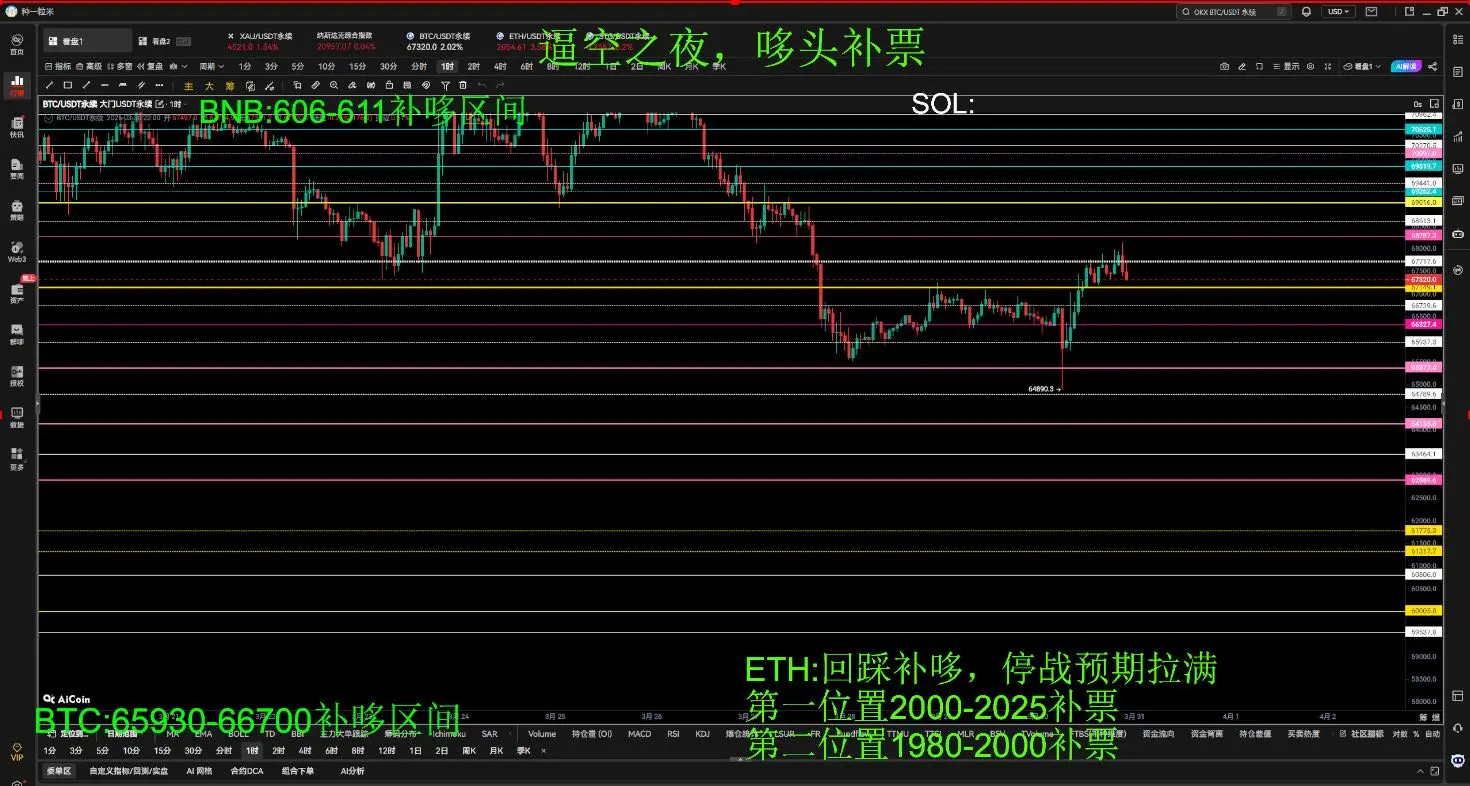
$BTC Technical Level | Daily Reference】
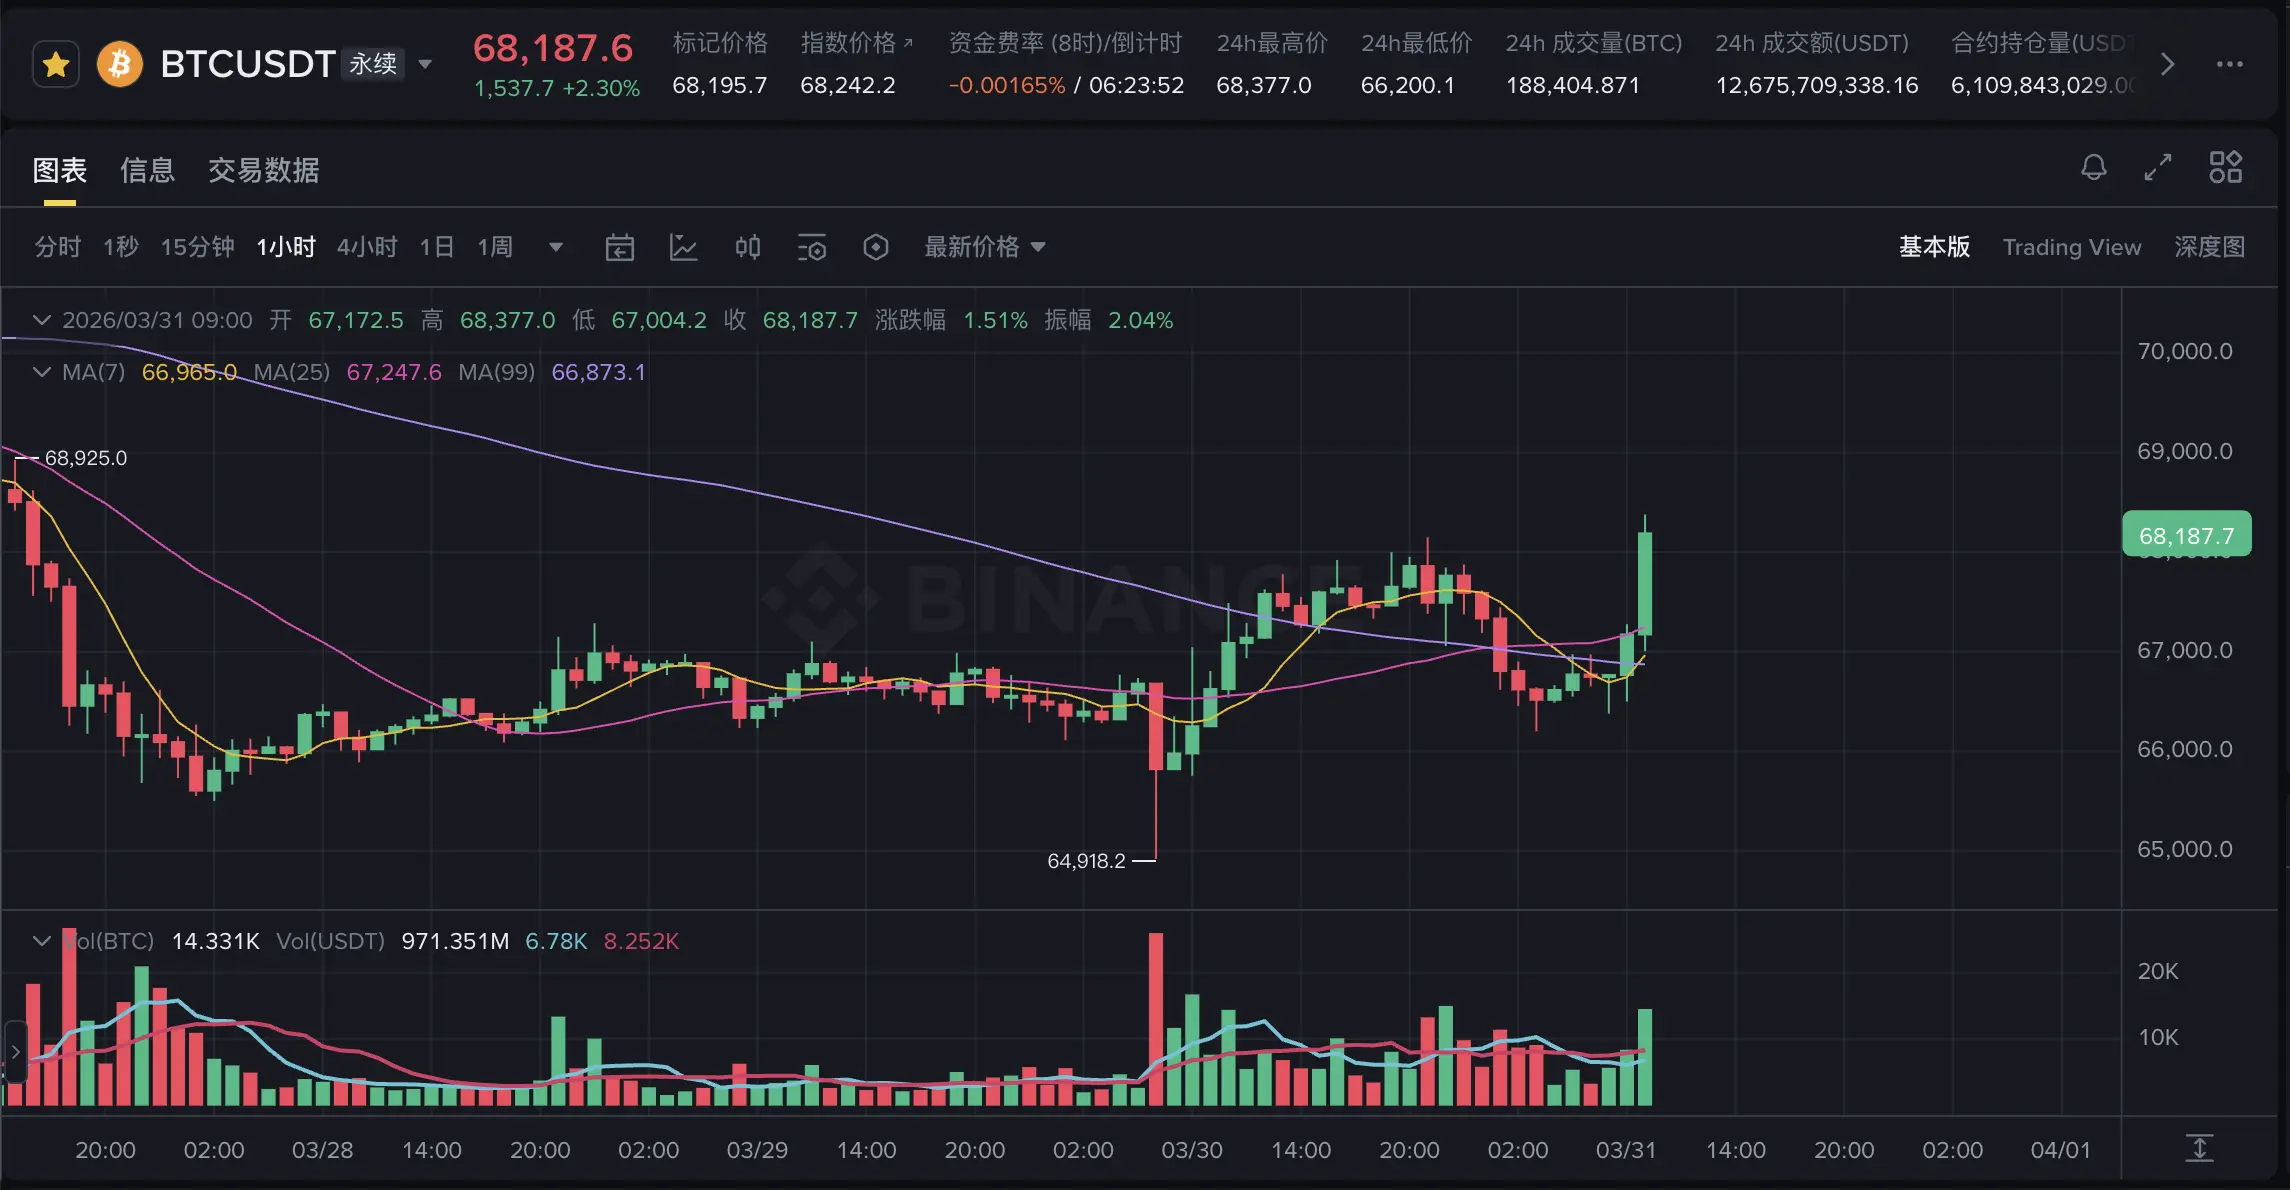
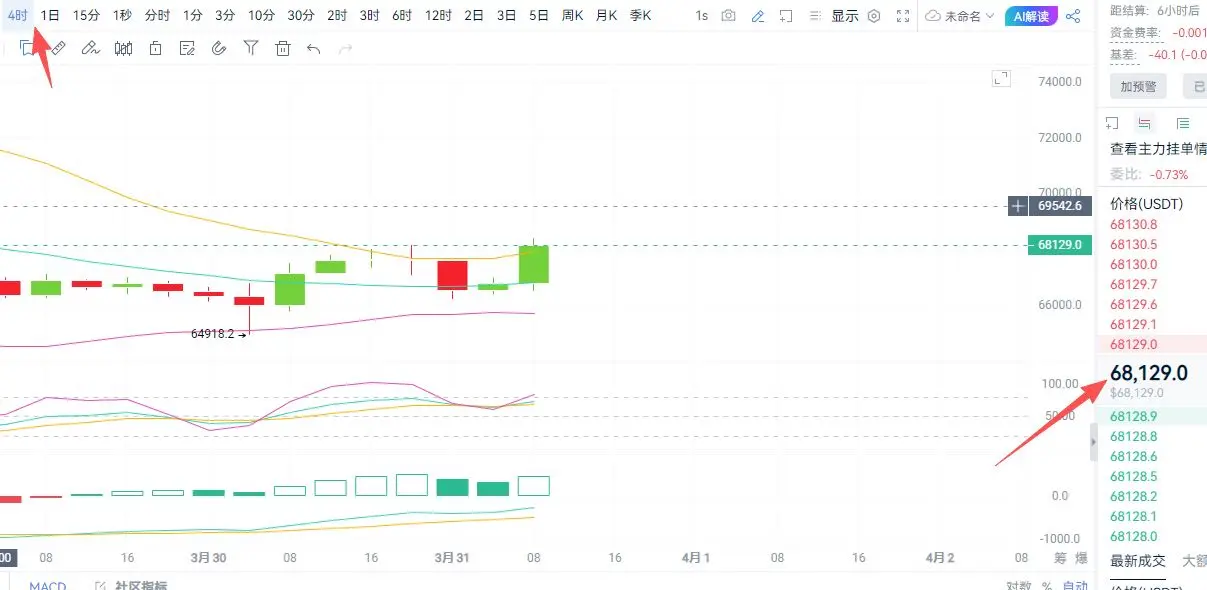
The daily chart is still oscillating, with highs and lows gradually converging, and the direction is unclear.
Key support: 66,200 / 64,918
Key resistance: 67,450-67,500 / 68,148
Current price is slightly above MA7 (67,242), indicating a short-term bullish bias but needs to stabilize. MA99 (69,950) forms a long-term resistance above; a breakout requires increased volume.
Recently, trading volume has continued to decline, and the market is waiting for a catalyst. A volume breakout above 68,148 could target 69,500-70,000; if it falls below 66,200, it will