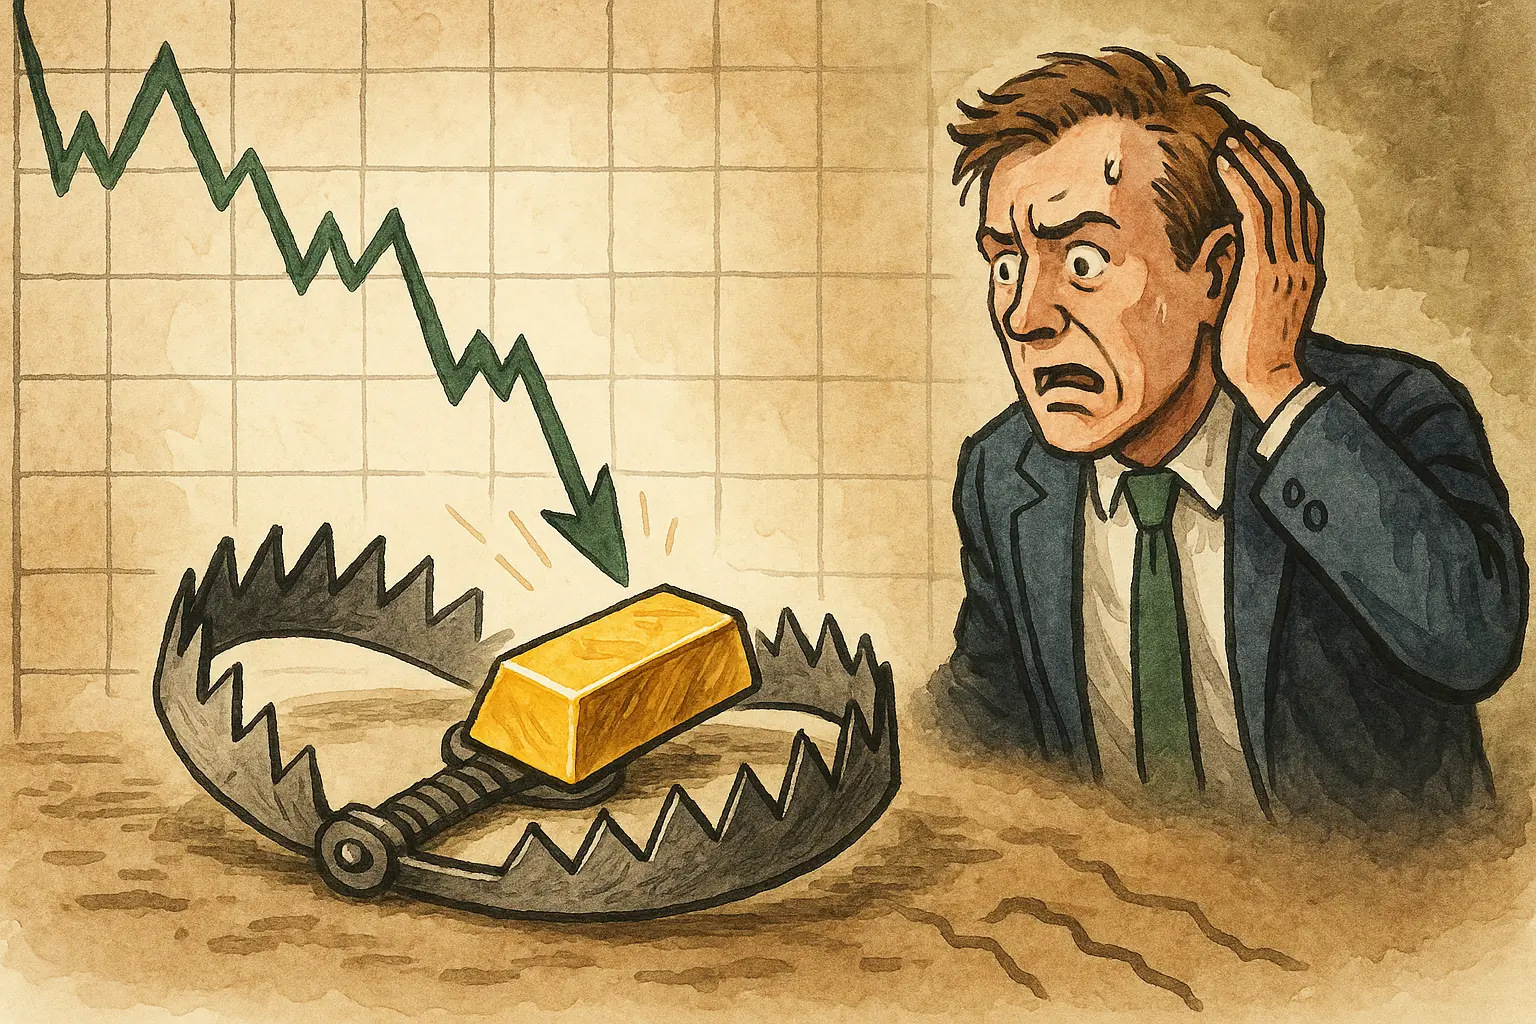
Gold reclaimed the level above $4,700 at the start of the second quarter, rebounding from the biggest single-month drop since the early 1980s that it recorded in March. However, veteran technical analyst and founder of ElliottWaveTrader, Avi Gilburt, warned in a recent interview that this correction has not yet ended. He sees two clearly different technical paths, both of which ultimately point to a level near $3,800 per ounce.
Two Downside Paths: Direct Pullback and a Bull Trap
Using Elliott Wave Theory as his analytical framework, Avi Gilburt currently identifies two distinct technical downside paths:
Path 1 (Direct Pullback Type): Gold encounters resistance as it nears current levels. After forming a top structure around the $4,800 area, it continues to fall directly. This path’s technical signals are relatively clear, and the difficulty of identifying the price high is lower once the top is in.
Path 2 (Bull Trap Type): Gold breaks above the $4,800 resistance level and rallies further to around $5,200, creating the illusion that the correction has ended—before triggering the deeper downside Avi Gilburt expects, ultimately targeting $3,800.
Avi Gilburt specifically highlights the danger of Path 2, saying, “This one is more deceptive, because the higher price will make everyone believe the correction is over, but in reality the correction is just beginning.” He therefore emphasizes that investors should not hastily conclude the trend has reversed when facing a short-term rebound.
A Preview Through the Lens of 2011 and Prospects for Silver and Mining Stocks
Avi Gilburt notes that the current gold market’s technical structure has notable similarities to the period of gold’s highs in 2011. The trajectory after the current correction will determine whether history repeats itself. In 2011, after gold hit its historical high, it entered a multi-year bear market trend.
For related markets, Avi Gilburt also offered the following technical read:
Silver: As long as it stays below the March recent high, the downside risk points to $53.50. In the long-term view, below $60 is a “great buying opportunity for the next 10 years,” though a pullback back to $40 is not ruled out.
Mining stocks: Some individual stocks have already formed a bottom and rebounded, while others are still in a pullback. Avi Gilburt believes the overall sector could outperform gold and silver in the next upswings, creating selective investment opportunities.
Oil: There may still be upside room in the near term, but Avi Gilburt expects that oil prices will drop sharply later this year—possibly even falling below $50 per barrel.
An Analytical Framework That Puts Technical Structure First
Avi Gilburt emphasizes that his overall outlook is driven entirely by technical structure, not macroeconomic narratives. He also points out the difference in execution strategies between traders and long-term investors: if gold holds steady at its target support level, it could present a buying opportunity for long-term investors; but it’s the strength and structure of the subsequent rebound that will determine the key judgment of whether gold’s overall trend remains bullish or shifts into a long-term bear market. He expects gold, silver, stocks, and commodities to enter a critical turning-window in the coming months.
Frequently Asked Questions
What is Avi Gilburt’s downside target for gold?
Avi Gilburt sees two technical paths, both pointing to gold ultimately falling below $4,000 per ounce and nearing the $3,800 level. Compared with the current spot quote of about $4,775, that implies roughly 20% additional downside room. The above is the analyst’s personal technical assessment and does not constitute investment advice.
Why does Avi Gilburt think gold rallying to $5,200 could be a “trap”?
Based on Avi Gilburt’s analysis of Path 2, if gold breaks above $4,800 and rallies to $5,200, short-term strength could cause the market to mistakenly believe the correction has already ended—leading traders to chase longs at higher levels. But within his technical framework, it is after this rebound that the deeper downside trend would be triggered, making it a classic bull trap structure.
How does Avi Gilburt differentiate response strategies for traders versus long-term investors?
Avi Gilburt says that if gold or silver holds steady at the target support levels he sets, it could create a buying opportunity for long-term investors. But whether the subsequent rebound can form a valid trend reversal is the key factor determining the long-term direction. He specifically explains that silver below $60 is an opportunity zone from a long-term allocation perspective, but short-term technical volatility risk still remains.
Disclaimer: The information on this page may come from third parties and does not represent the views or opinions of Gate. The content displayed on this page is for reference only and does not constitute any financial, investment, or legal advice. Gate does not guarantee the accuracy or completeness of the information and shall not be liable for any losses arising from the use of this information. Virtual asset investments carry high risks and are subject to significant price volatility. You may lose all of your invested principal. Please fully understand the relevant risks and make prudent decisions based on your own financial situation and risk tolerance. For details, please refer to
Disclaimer.
