Litecoin trades near $54 in a tight range as traders watch a $53–$40 accumulation zone for a potential breakout move ahead.
Litecoin traded near $54 on the daily chart as traders tracked a possible base after months of losses.
Market focus returned after online commentary pointed to an accumulation zone between $53 and $40.
The chart still showed a broader downtrend, yet recent price action suggested selling pressure had slowed. That mix placed Litecoin back on watchlists as traders waited for a clear breakout or breakdown.
Litecoin Holds a Narrow Daily Range
Litecoin Price moved mostly between $52 and $58 after a sharp drop in early February.
That range followed a fast selloff from higher levels seen late last year. As a result, Litecoin stopped falling quickly, but it did not enter a clear uptrend.
Instead, the market formed a sideways pattern that looked more like consolidation than recovery.
Support sat near $53 and $52, while $50 remained an important lower level. Meanwhile, resistance stayed around $55 and $56, with stronger pressure near $58 to $60.
Those levels kept price boxed inside a narrow band and delayed a firm trend signal.
Because of that, short-term traders focused on daily closes rather than intraday moves.
The daily structure still leaned bearish because Litecoin remained below earlier swing highs.
However, the long lower wick from February showed buyers responded after panic selling. That reaction hinted at demand, and it helped steady prices near current support.
For now, the chart suggested stabilization, but not a confirmed reversal.
Accumulation Claims Bring Litecoin Back Into Focus
A widely shared post said Litecoin had entered a new accumulation zone between $53 and $40.
The post compared current trading with the 2018 to 2020 period near cycle lows.
It also said a broken support line could be a “liquidity grab” instead of a lasting failure. That comparison drew interest because Litecoin has traded quietly for several months.
$LTC Is Setting Up For A MASSIVE Move That Could Shock The Entire Market.#LTC At $53 Right Now. Down Bad. Left For Dead. Nobody Cares.
Perfect.
That’s Exactly How Every Major Litecoin Rally Started.
Look At The 3W Chart:
2018-2020: Price Accumulated At The Bottom For 2 Years… pic.twitter.com/q45TkWY78e
— Crypto Patel (@CryptoPatel) March 28, 2026
The same post listed price targets at $135, $219, $388, and $862. Those targets depended on a repeated fractal pattern, which remains unconfirmed on the current chart.
Even so, the idea gained attention as Litecoin stayed near lows and broader interest stayed soft.
For now, the targets remain part of a market narrative, not a confirmed trend. The next move may depend on whether Litecoin breaks above $58 or loses $52.
A daily close above resistance could improve sentiment and support a move into higher ranges.
If support fails, traders may revisit $50 and the February low near $46. Until price leaves the range, Litecoin remains in a wait-and-see phase.
**Read Also: **
Litecoin Targets $1,000 as Multi-Year Ascending Trendline Holds Strong
Momentum Signals Stay Soft but Stable
The 14-day RSI was near 45.8, which kept momentum slightly below neutral. Its average stood near 50.6, and that gap showed buyers lacked full control.
Still, RSI stayed above oversold territory, so fresh downside was not confirmed. At the same time, it remained below the midpoint that often marks stronger momentum.
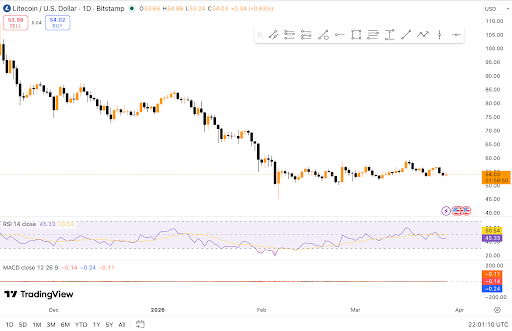
Litecoin consolidates near $54 as accumulation grows. Source: TradingView.
MACD also stayed negative, although the reading was only slightly below zero.
That suggested bearish pressure remained, but the selling pace had slowed. In turn, traders saw a market that was resting rather than breaking higher.
The histogram also stayed weak, which matched the slow and choppy price action.
Volume did not point to strong conviction during the recent sideways move.
Because of that, many chart watchers looked for a close above resistance before changing stance.
A close above $58 could shift focus toward $60, $65, and $68. Until then, the data supported a base, yet it stopped short of confirming recovery.
Disclaimer: The information on this page may come from third parties and does not represent the views or opinions of Gate. The content displayed on this page is for reference only and does not constitute any financial, investment, or legal advice. Gate does not guarantee the accuracy or completeness of the information and shall not be liable for any losses arising from the use of this information. Virtual asset investments carry high risks and are subject to significant price volatility. You may lose all of your invested principal. Please fully understand the relevant risks and make prudent decisions based on your own financial situation and risk tolerance. For details, please refer to
Disclaimer.
