Bitcoin Cash (BCH) continues to stay above the long-term demand zone around the $440 mark—a significant support level that has repeatedly acted as a floor. Previously, Coinphoton observed on-chain indicators signaling mixed signals, but the current context shows many similarities to the local bottom area in October 2025—setting the stage for a strong rally that could push BCH to $660 in January 2026.
The momentum from Bitcoin (BTC) remains a major influencing factor. BTC maintaining the $70,000 level recently has strengthened market sentiment, creating favorable conditions for buyers to push prices higher. BCH’s positive reaction at the $440 zone partly reflects support from this trend.
In the short term, the price structure indicates BCH offers trading opportunities for swing traders. However, to optimize strategies, both the long-term outlook and short-term momentum should be evaluated simultaneously.
Decoding Bitcoin Cash’s Long-Term Range
BCH is moving within a broad range from $272 to $684, with a median zone at $478. Despite a recent rebound, the daily chart still leans bearish.
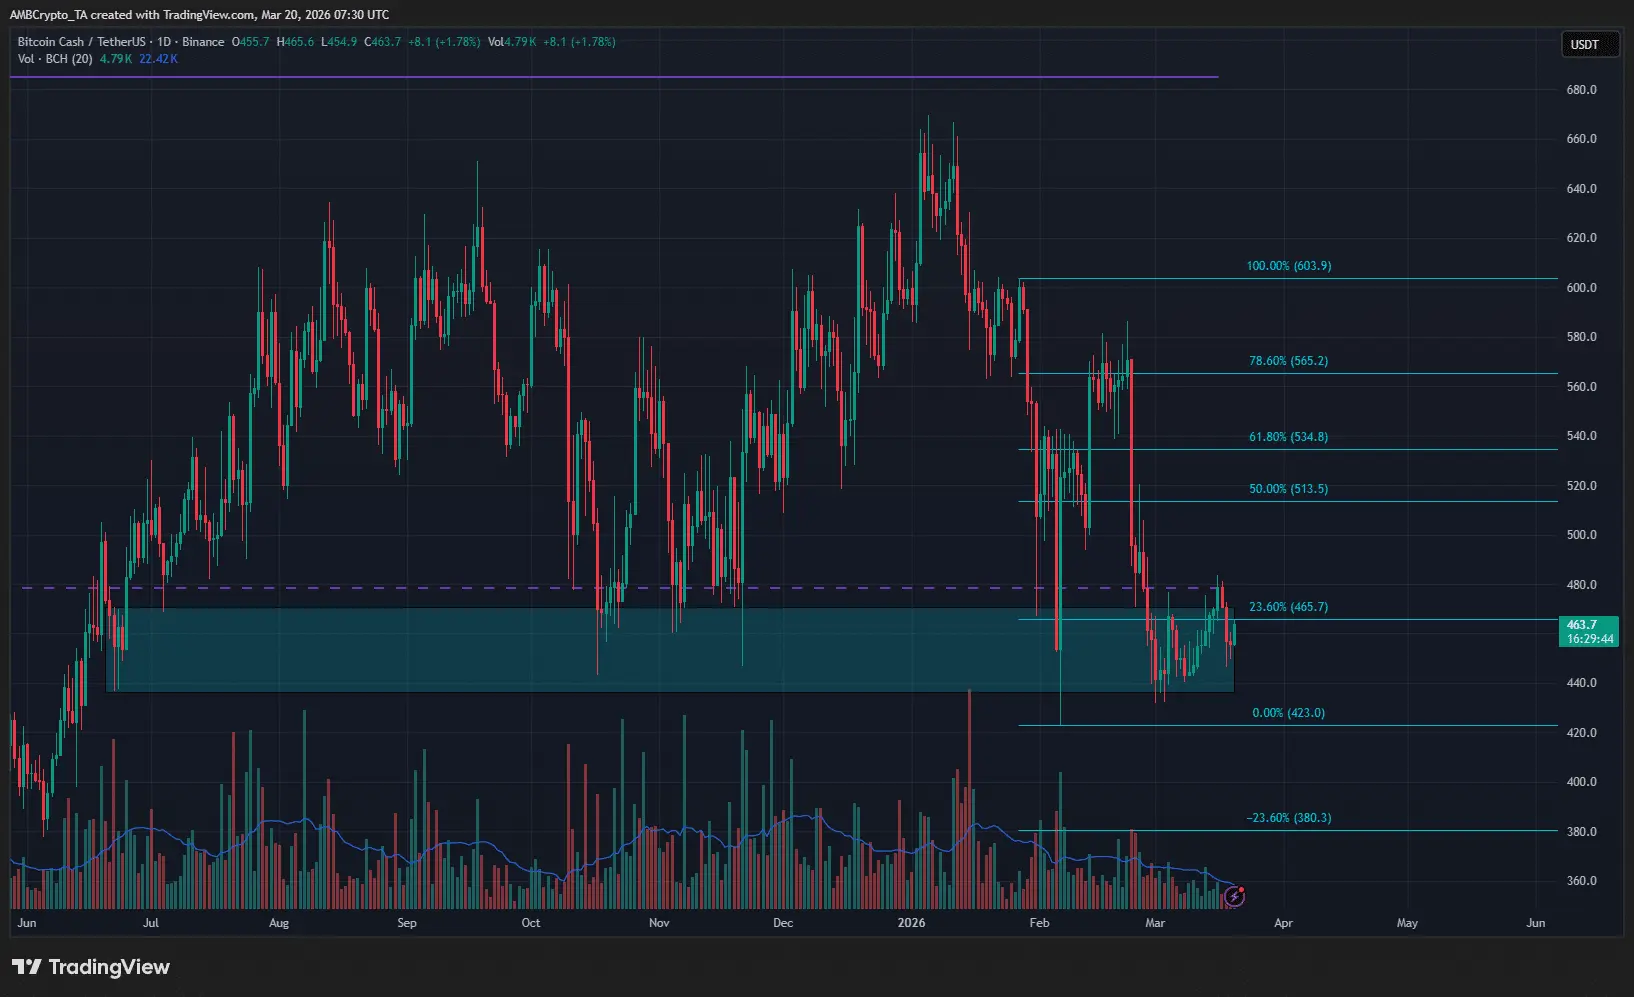 Source: TradingView An important note is that trading volume has steadily declined over the past six weeks, reflecting weakening demand in the downtrend. Even when prices bounce, volume has yet to surpass the 20-day average—a warning sign that the recovery lacks conviction.
To confirm a return to the top of the range, the market needs to see a significant increase in buying pressure and active demand. Additionally, BTC’s current rally is likely just a rebound within a larger downtrend, which could put pressure on BCH’s long-term growth expectations.
Is BCH a Buying Opportunity?
In the short term, BCH is sending more positive signals. On the 4-hour chart, the market structure shifted to an uptrend on March 16, indicating improved price momentum.
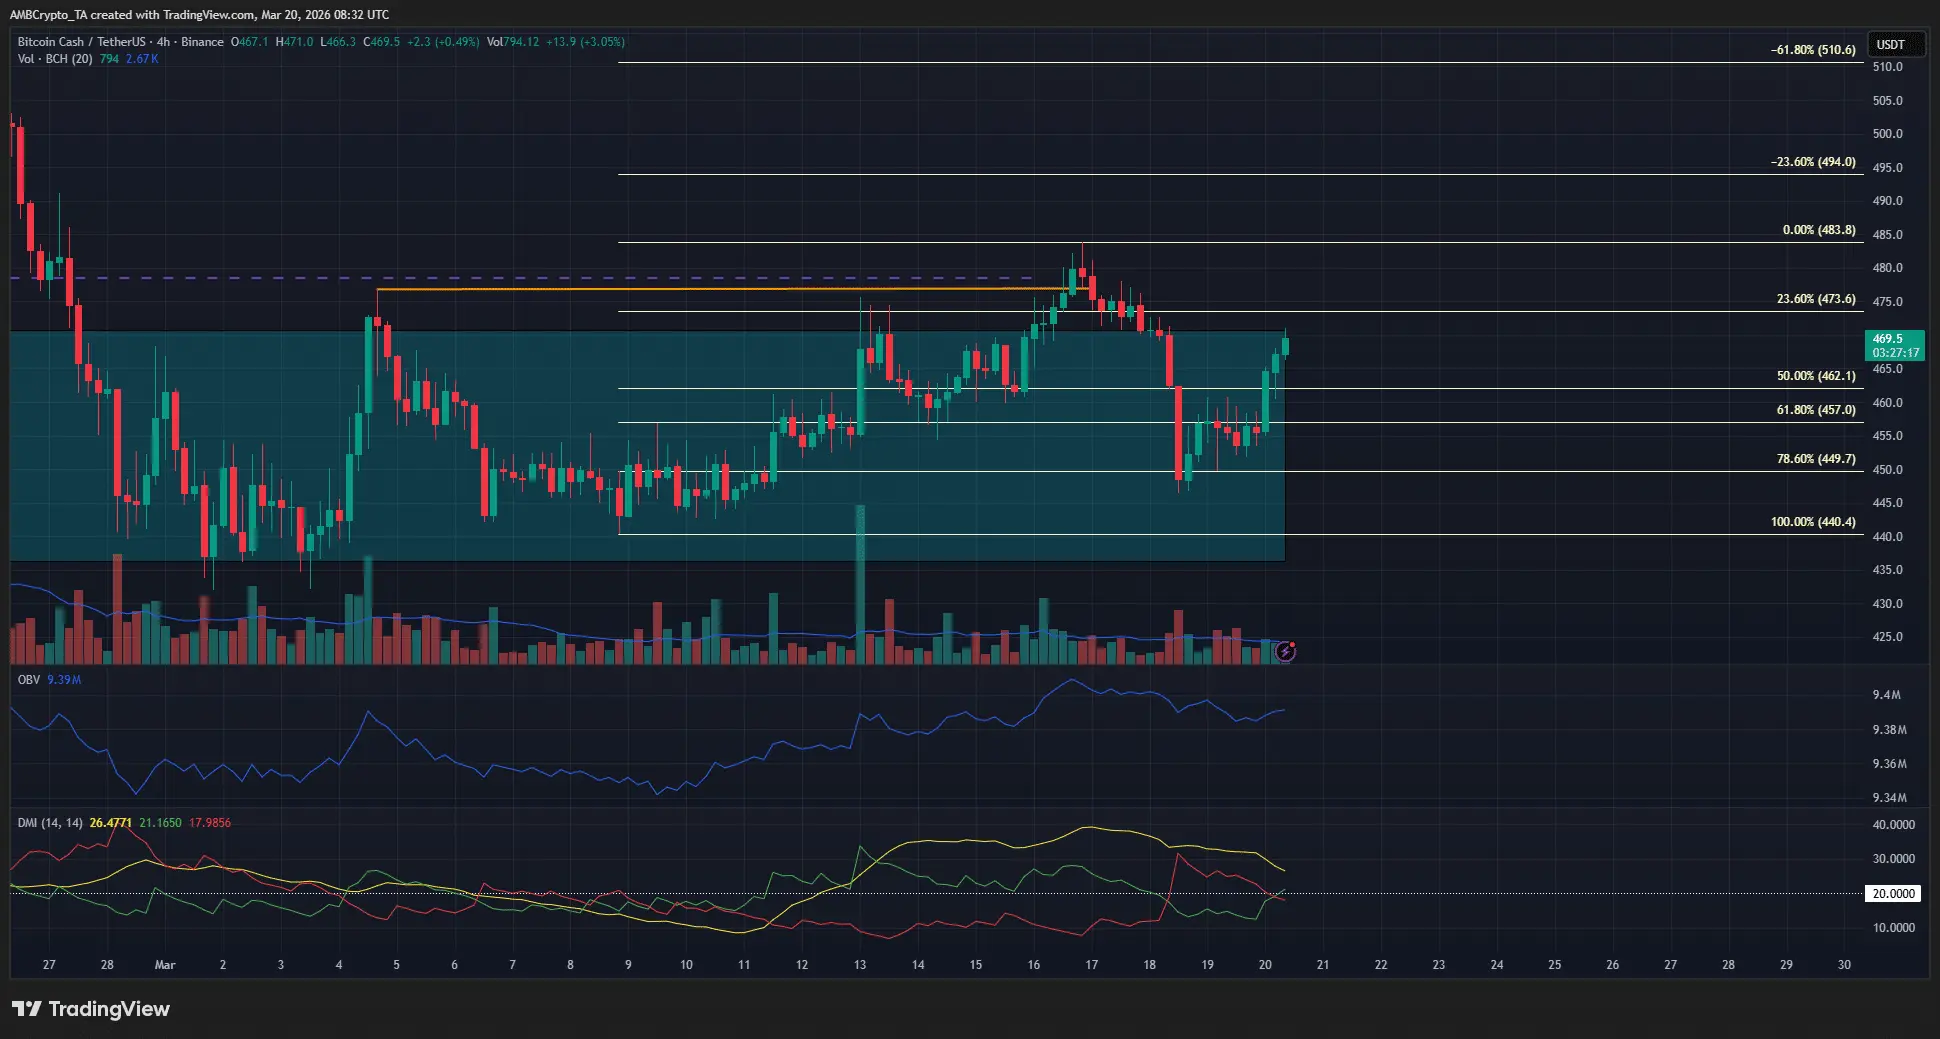 Source: TradingView The correction down to $449 served as a test of a key Fibonacci support zone, followed by a quick rebound. Meanwhile, the OBV indicator has formed higher lows over the past two weeks, reflecting accumulated capital, while the DMI confirms the uptrend is strengthening on this timeframe.
The bullish scenario will be invalidated if BCH breaks below $440. Conversely, if the rally continues, near-term targets are around $494 and $510. If BTC continues its upward trend, BCH could potentially reach the $570 zone in the short term.
Disclaimer: The information on this page may come from third parties and does not represent the views or opinions of Gate. The content displayed on this page is for reference only and does not constitute any financial, investment, or legal advice. Gate does not guarantee the accuracy or completeness of the information and shall not be liable for any losses arising from the use of this information. Virtual asset investments carry high risks and are subject to significant price volatility. You may lose all of your invested principal. Please fully understand the relevant risks and make prudent decisions based on your own financial situation and risk tolerance. For details, please refer to
Disclaimer.
