Gate Research: Starknet Rises on BTCFi Narrative, Polymarket Leads a New Chapter in On-Chain Prediction Markets|Web3 On-Chain Data Insights for October 2025
Abstract
- Trading activity on Layer2 networks and high-performance blockchains has broadly rebounded, with capital and user engagement continuing to strengthen, and the market structure becoming increasingly stratified. Solana and Arbitrum lead the multi-chain ecosystem, Ethereum remains the core value hub, while Polygon and Base are steadily expanding to reinforce ecosystem resilience.
- Arbitrum recorded notable net inflows driven by the DRIP incentive program and asset tokenization deployments, further solidifying its position as the leading Layer2 network. Starknet, fueled by the BTCFi narrative, has emerged as a new focal point, attracting significant capital inflows.
- Bitcoin faces dense supply overhead, and its breakout will require time to absorb high-level positions. Meanwhile, short-term positioning sentiment has stabilized and overall market confidence is gradually recovering; long-term holders have begun accumulating again, signaling a phase of capital rebalancing.
- Polymarket is pioneering the fusion of prediction markets with mainstream finance. Its “Up/Down Equity Markets” product has ushered in a new cycle of on-chain narratives, with over 440,000 active users and monthly trading volume exceeding USD 2.7 billion, establishing it as the representative platform of event financialization.
- Humanity Protocol focuses on zero-knowledge identity verification and the “AI + DID” narrative. Its token $H has surged more than 300% in recent months, with core module testing and community momentum driving it to become one of the most-watched emerging projects in the decentralized identity sector.
On-Chain Insights Overview
Overview of On-Chain Activity and Capital Flow
In addition to analyzing overall on-chain capital flows, we further selected several key on-chain activity metrics to assess the actual usage and engagement levels across blockchain ecosystems. These indicators include daily transaction volume, daily gas fees, daily active addresses, and net cross-chain bridge flows—capturing user behavior, network utilization intensity, and asset mobility. Compared to observing capital inflows and outflows alone, these native on-chain data points provide a more comprehensive reflection of fundamental shifts in blockchain ecosystems. They help determine whether capital flows are accompanied by genuine user demand and growth, enabling identification of networks with sustainable development potential.
Transaction Analysis: Arbitrum Leads the Multi-Chain Rebound, Activity Rises Across Major Chains
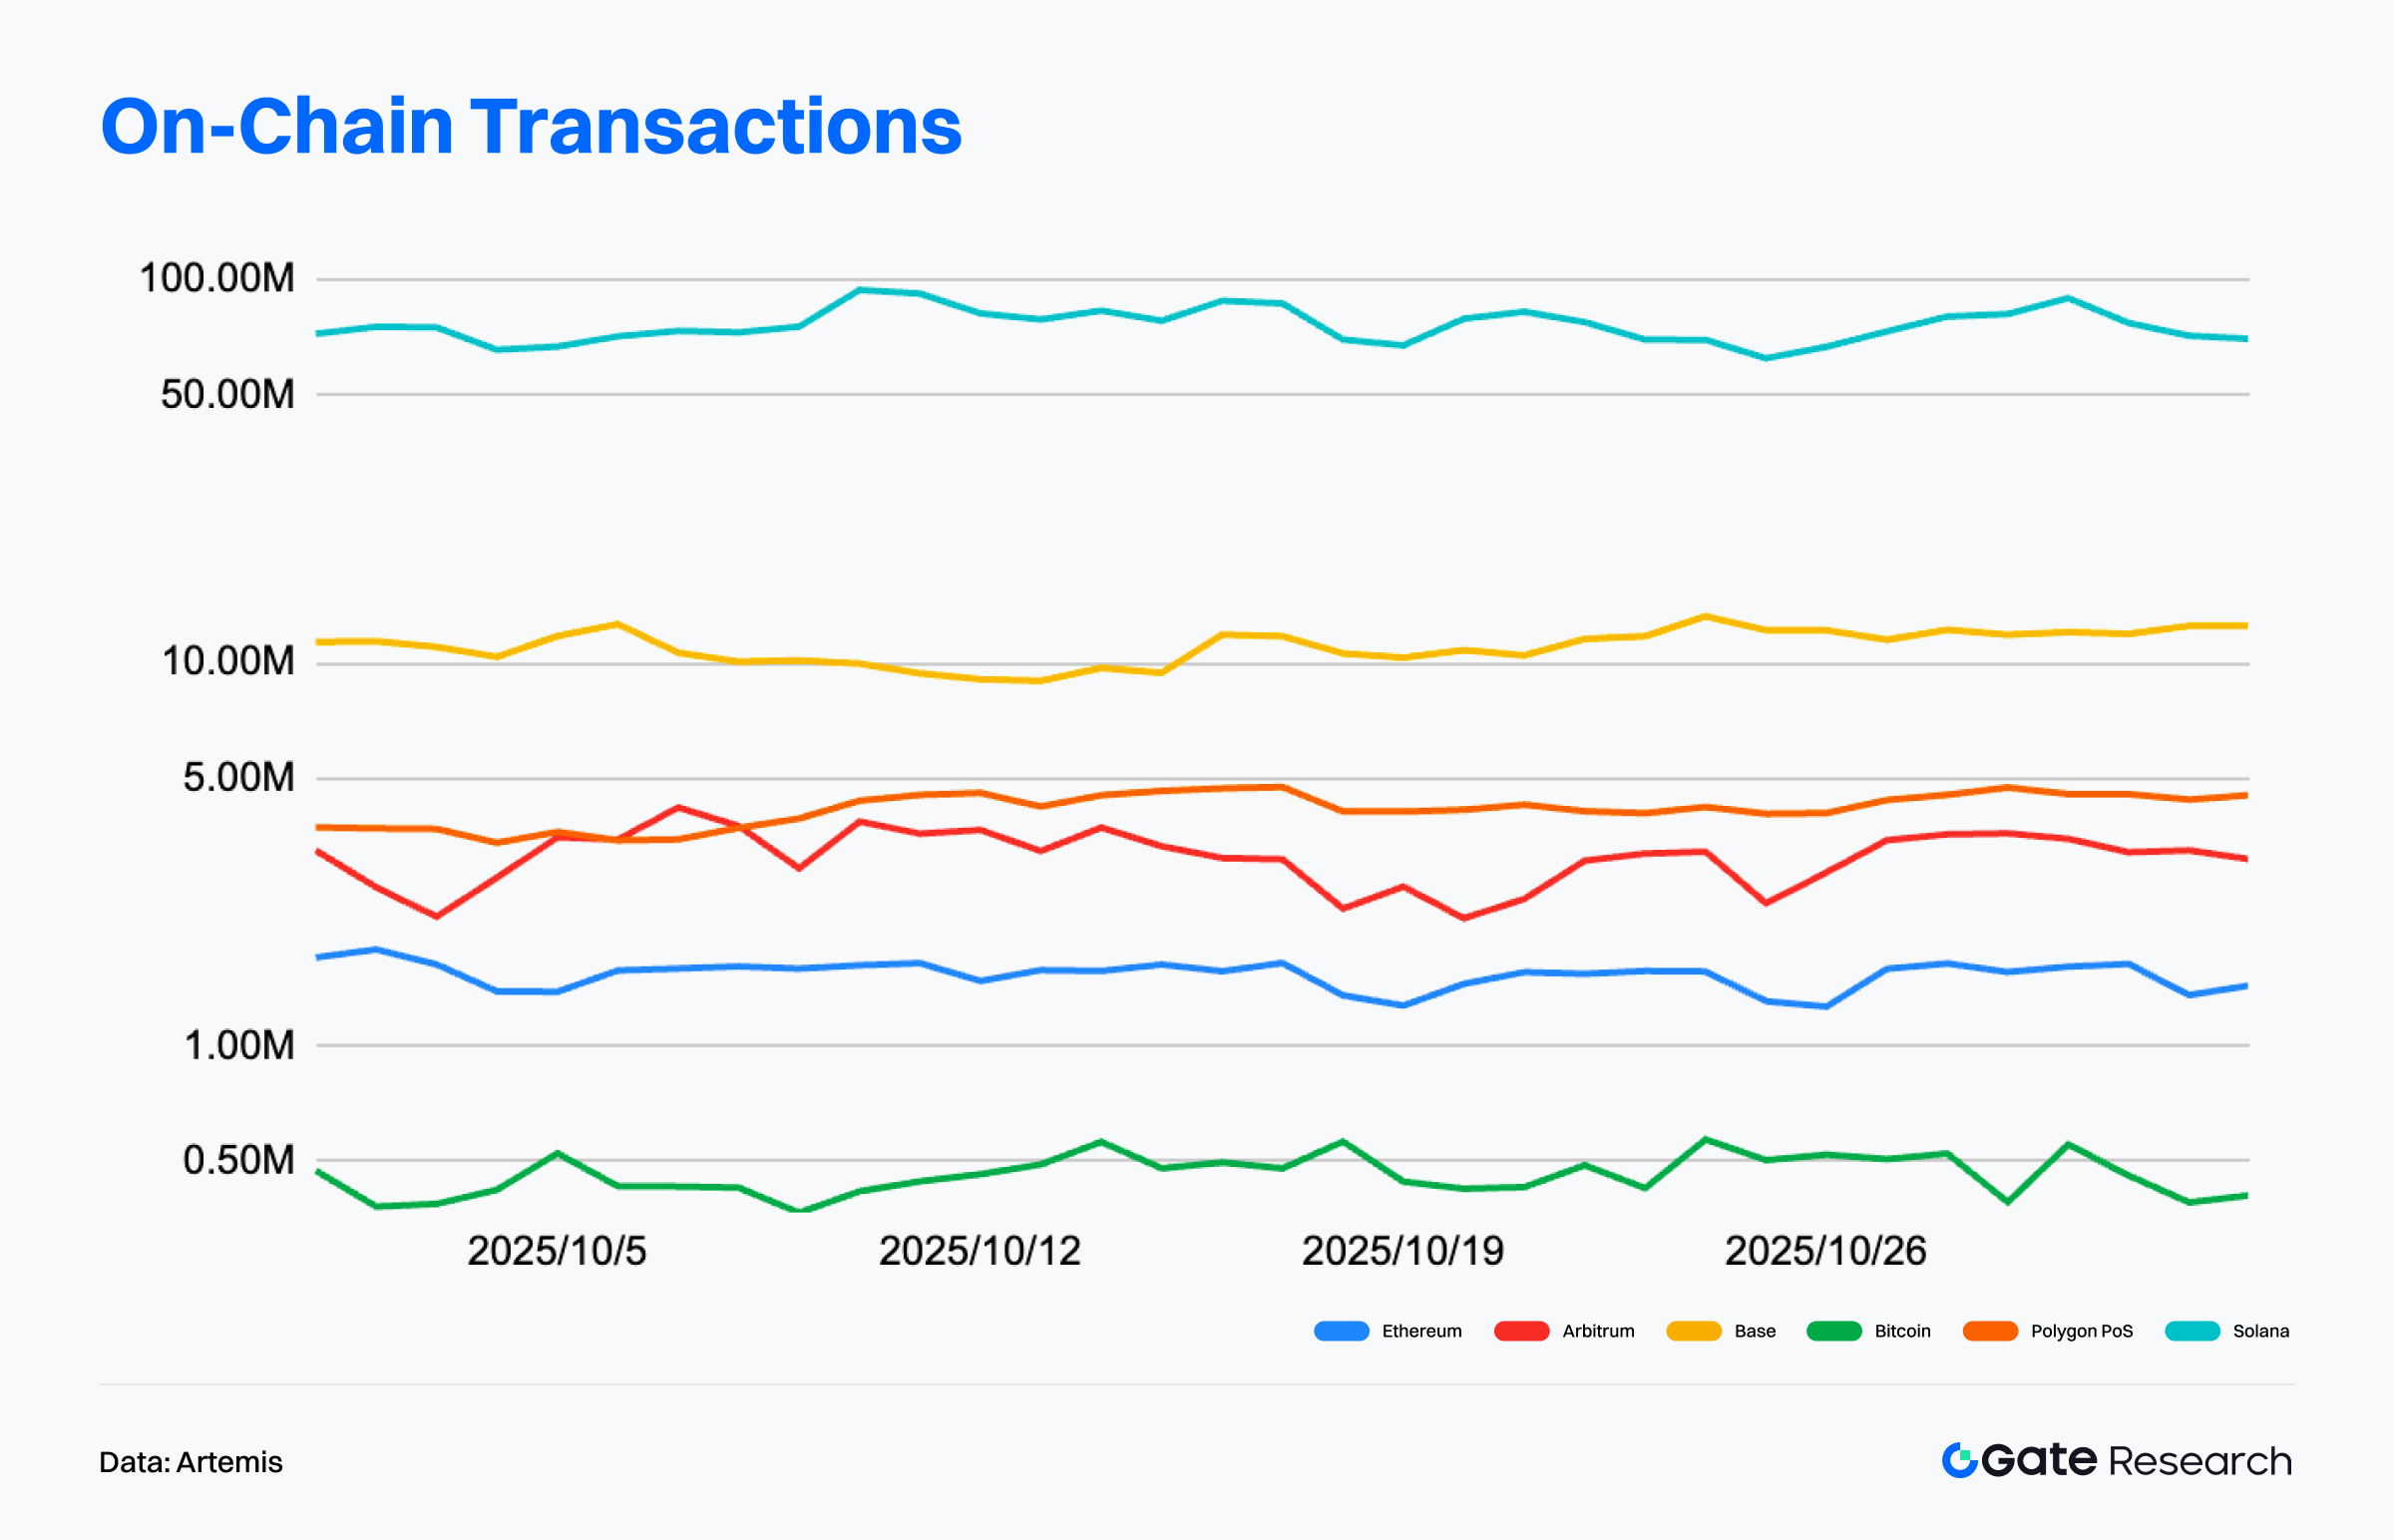
According to Artemis data, overall on-chain transaction counts in October showed a moderate upward trend, indicating that liquidity and activity remain solid. Solana maintained its leading position with a monthly transaction count of 2.5 billion (+6.65%), continuing its high-frequency interaction profile and dominance among high-performance blockchains.【1】
Among all networks, Arbitrum stood out with a monthly increase exceeding 34%, sustaining multiple weeks of growth in both liquidity and activity. Capital is increasingly concentrating in top-tier ecosystems, particularly from legacy mainnets and some emerging Layer2s. Dune data show Arbitrum’s on-chain transaction volume surpassed $2 billion for the first time in October, driven by the expansion of DeFi protocols, asset tokenization, and Layer3 applications. Robinhood’s tokenization deployment on Arbitrum continues to advance, with nearly 500 assets tokenized, worth over $8.5 million. Meanwhile, the stablecoin liquidity protocol DRIP has grown to a $1 billion pool, reflecting a positive feedback loop between capital and applications.
Polygon PoS also posted strong growth (+22.45%), with ecosystem trading activity returning to elevated levels. Ethereum and Base grew modestly (+3.92% and +1.78%, respectively), maintaining network stability, while Bitcoin rose only +0.66%, suggesting its activity remains dominated by holdings and derivatives transactions rather than on-chain transfers.
Overall, transaction structure shows a pattern of “Layer2 and high-performance chains active, mainnets stable,” with capital interactions becoming more stratified and efficient — signaling steady ecosystem momentum despite limited market overheating.
Active Address Analysis: Solana Dominates, Arbitrum Sees a Pullback
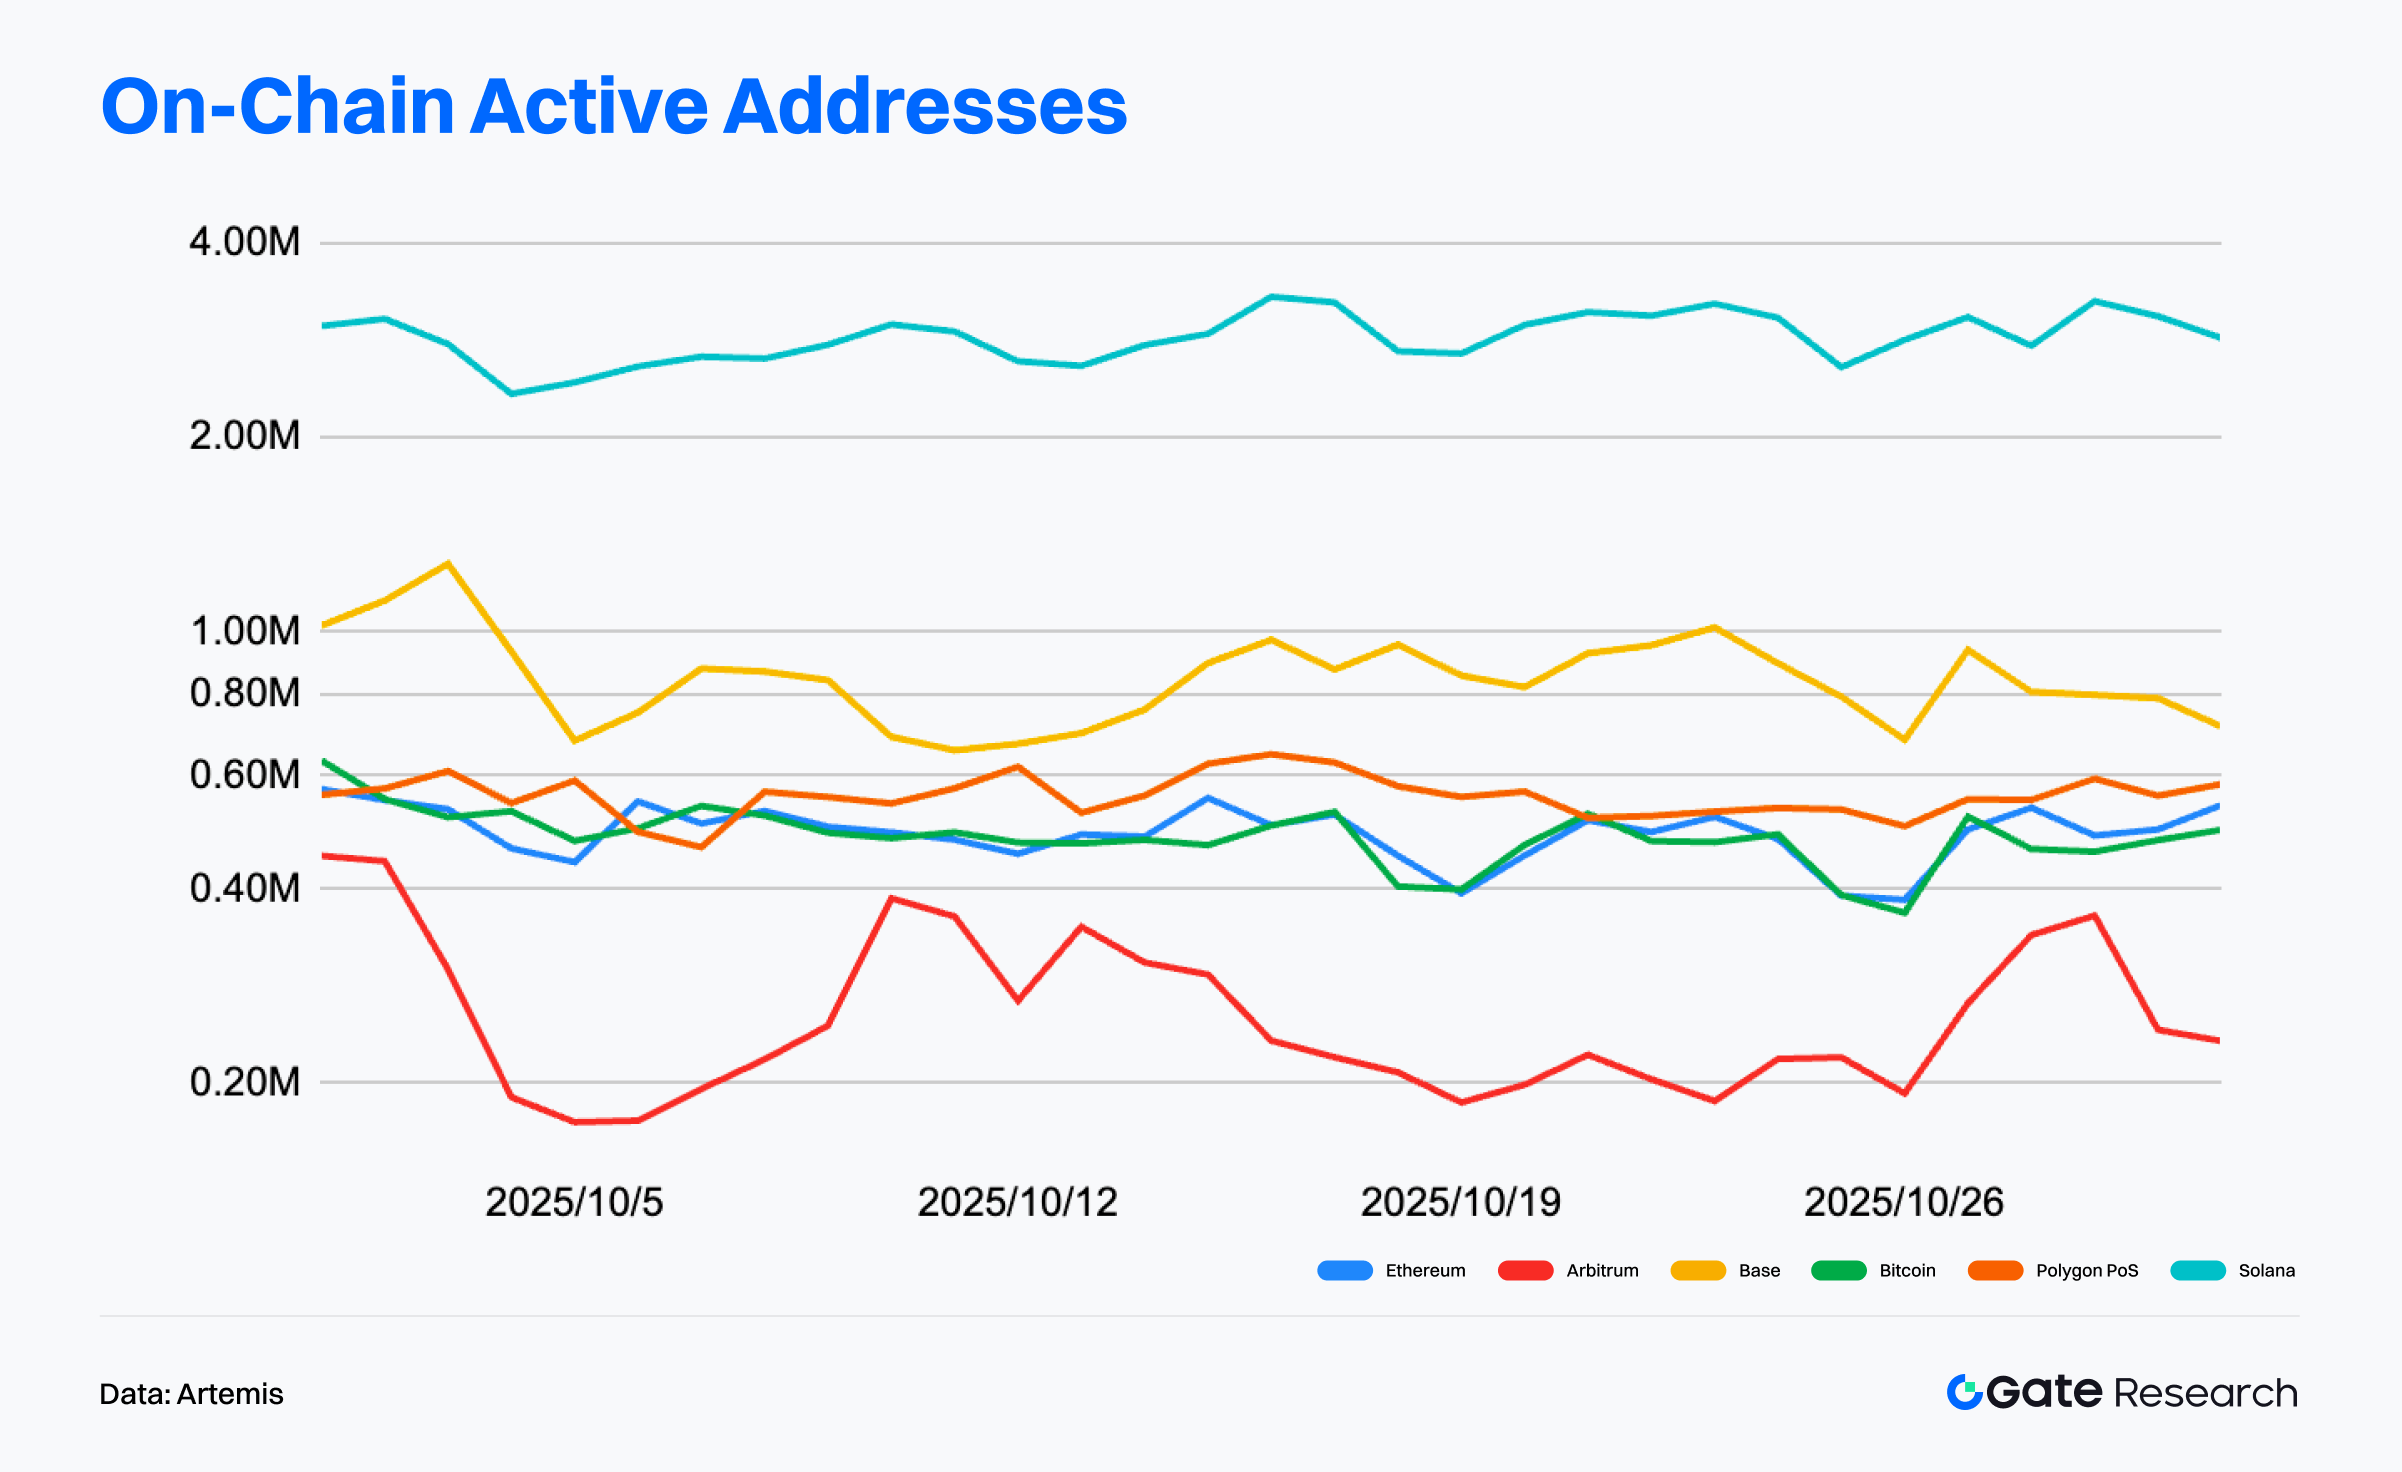
According to Artemis, during October 2025, Solana maintained daily active addresses between 2.5–4 million, sustaining its high-frequency interaction advantage and reflecting strong ecosystem resilience and user stickiness. Base followed in second place with 700k–1M daily active addresses, showing steady, gradual growth. Ethereum mainnet activity stayed between 500k–600k, indicating stability, while Polygon PoS and Bitcoin both ranged between 400k–600k.【2】
Notably, Arbitrum saw a decline from an early-month peak of 450k addresses to around 200k, suggesting temporary cooling of activity and partial user migration toward Base and Polygon.
Overall, Solana continues to dominate high-frequency interaction scenarios, Base and Arbitrum are steadily expanding their ecosystems, and Ethereum retains its role as the core value settlement layer — illustrating a clearer stratification among major chains.
On-Chain Fee Revenue Analysis: Ethereum Retains the Lead, Polygon PoS and Arbitrum Show Volatility
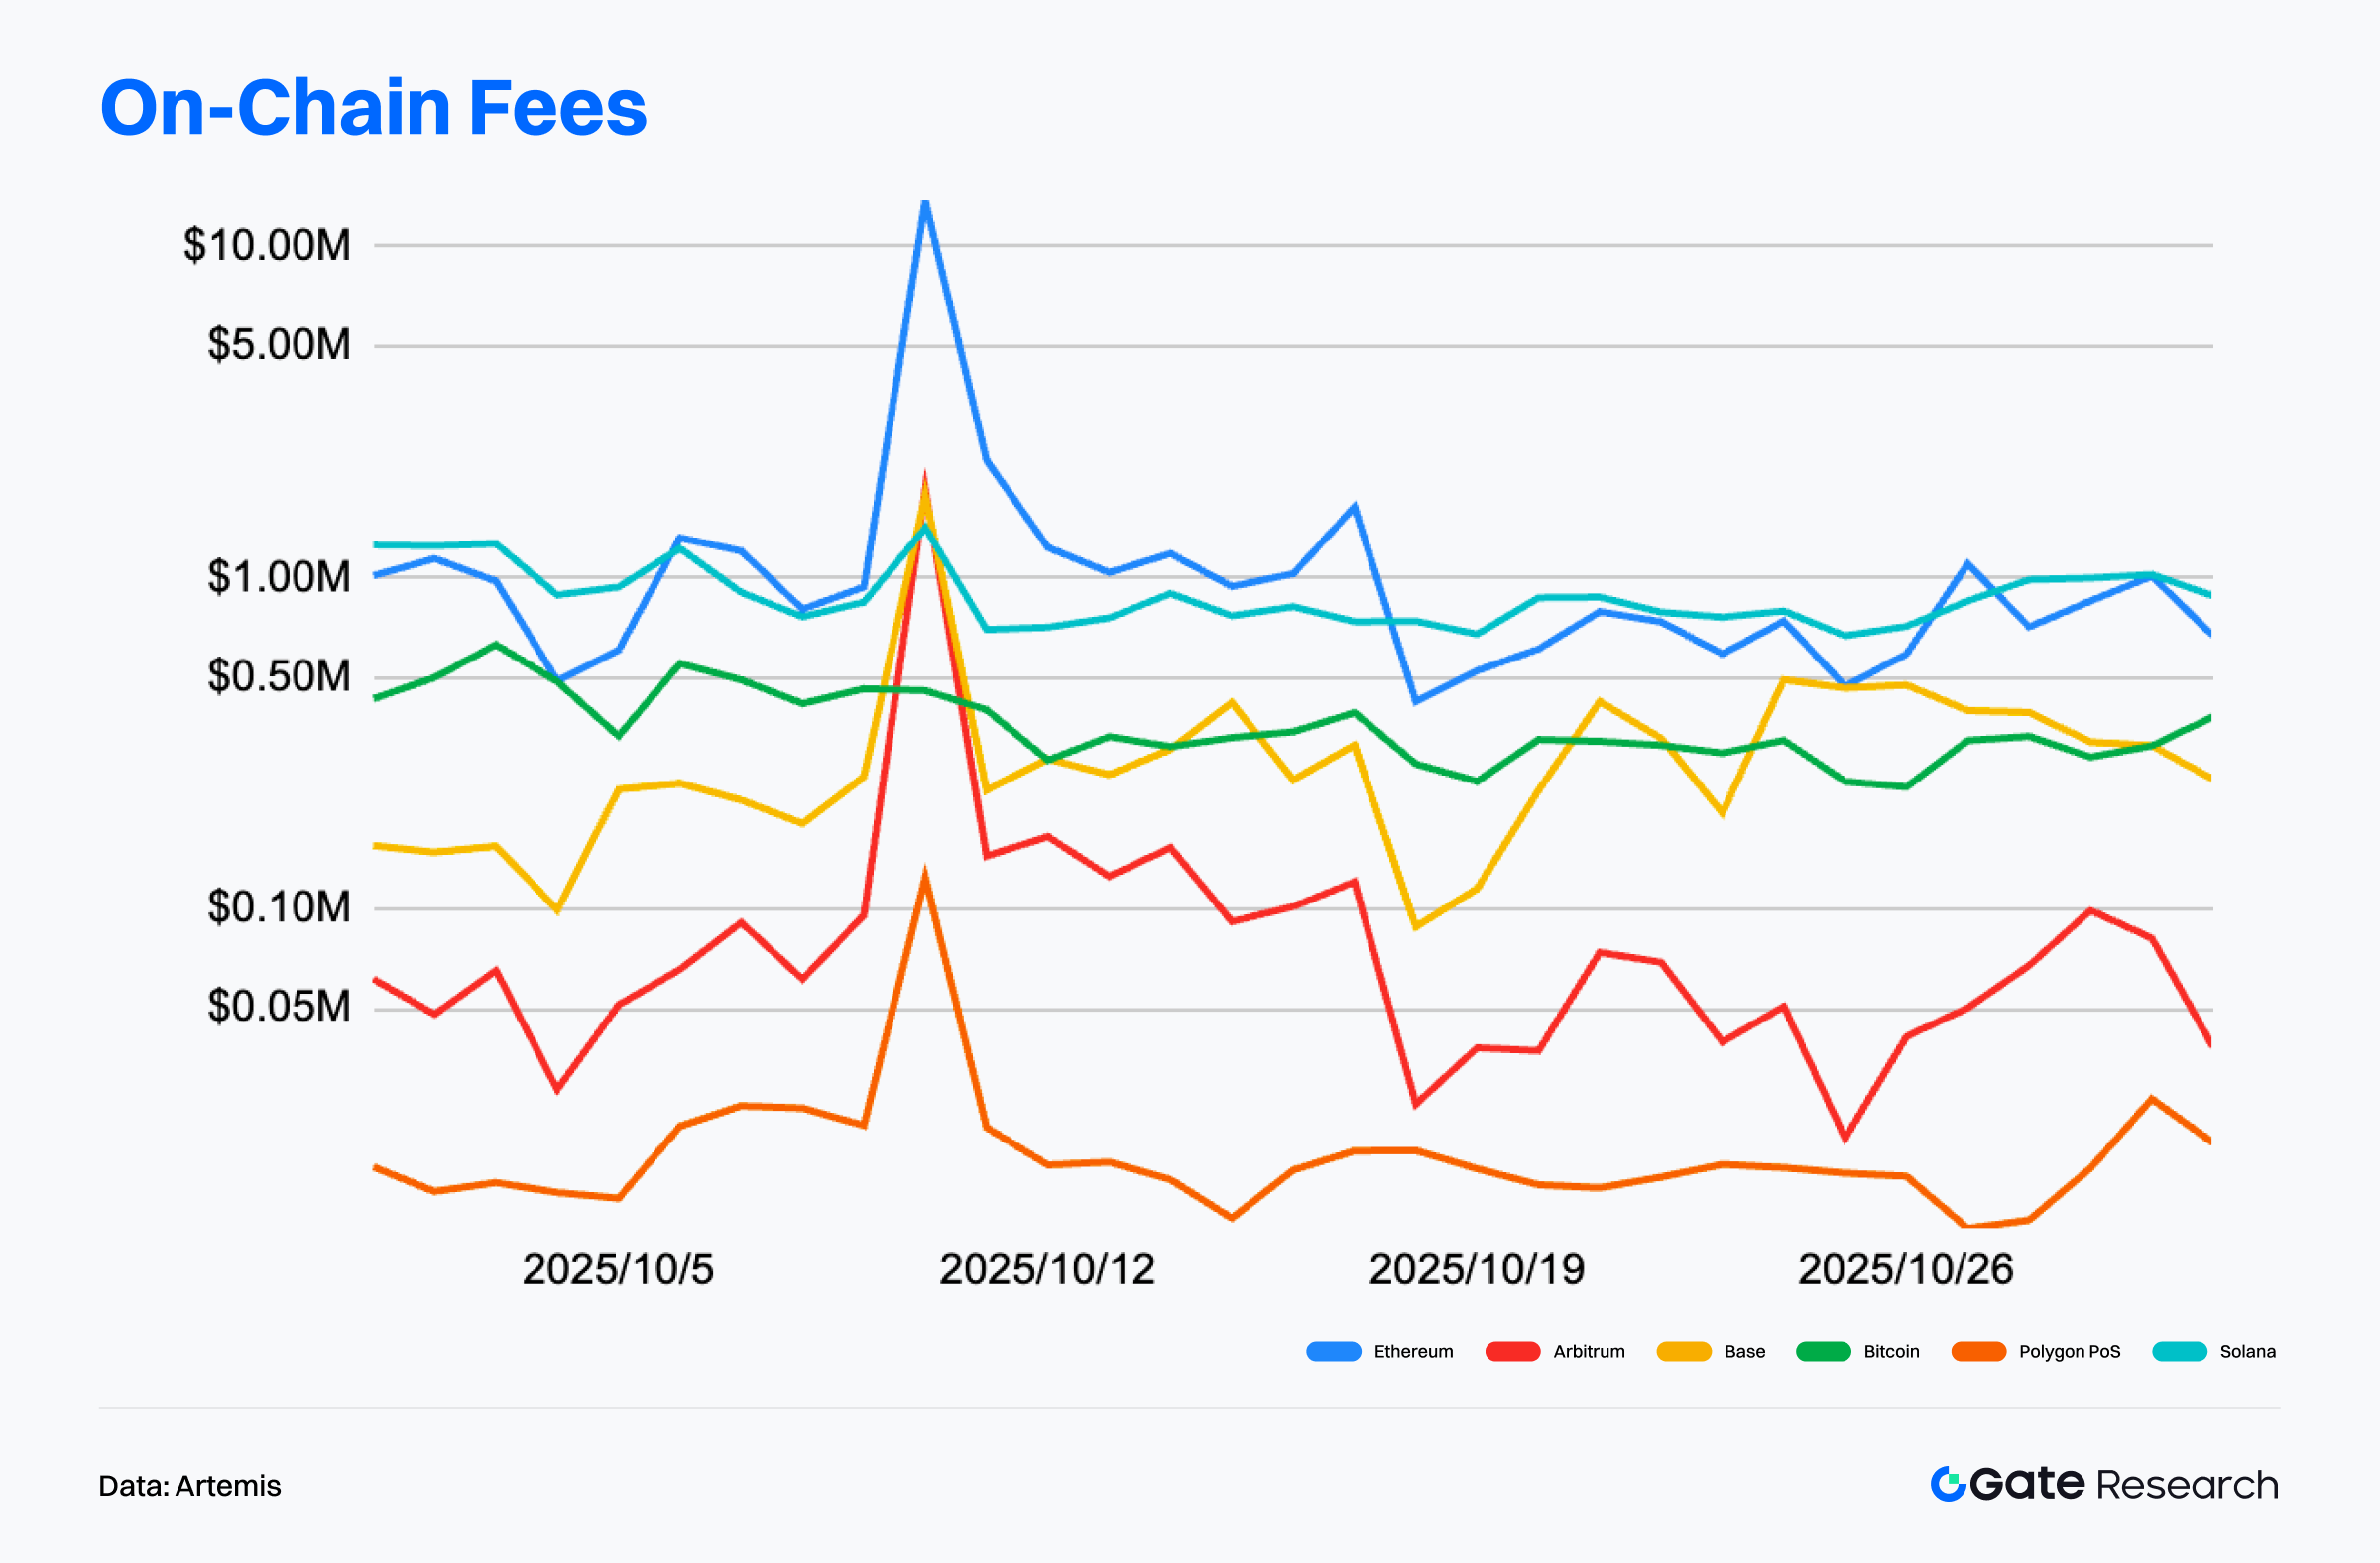
Data from Artemis show that transaction fee revenues in October continued to diverge across chains, forming a pattern of “value chains leading, high-frequency chains stabilizing.” Ethereum firmly held the top spot, with several mid-month spikes — daily revenue once exceeding $10 million, mainly driven by DeFi and high-value transactions, reinforcing its dominance in the on-chain economy. Solana maintained fee revenue between $0.5–1 million per day, underscoring steady support from high-frequency trading.【3】
By contrast, Arbitrum’s revenue was more volatile, spiking mid-month before rapidly falling back, likely due to temporary incentives and speculative activity. Polygon PoS remained at lower levels but saw a mild rebound toward month-end, possibly tied to ecosystem upgrades and application updates. Base and Bitcoin both remained stable — the former constrained by its growth pace, the latter reflecting steady transfer and settlement demand.
Importantly, the collective surge in fees around October 11 correlated with sharp market volatility. A rapid downturn triggered mass DeFi liquidations, DEX trading, and cross-chain swaps, leading to short-term spikes in on-chain activity and gas fees. Ethereum and Arbitrum both recorded significant fee peaks, reflecting intense transactional clustering during volatility. Overall, these spikes were event-driven rather than structural, showing that on-chain economics remain highly sensitive to market swings.
Capital Flow Divergence: Arbitrum Leads, Starknet and BTCFi Narratives Rise
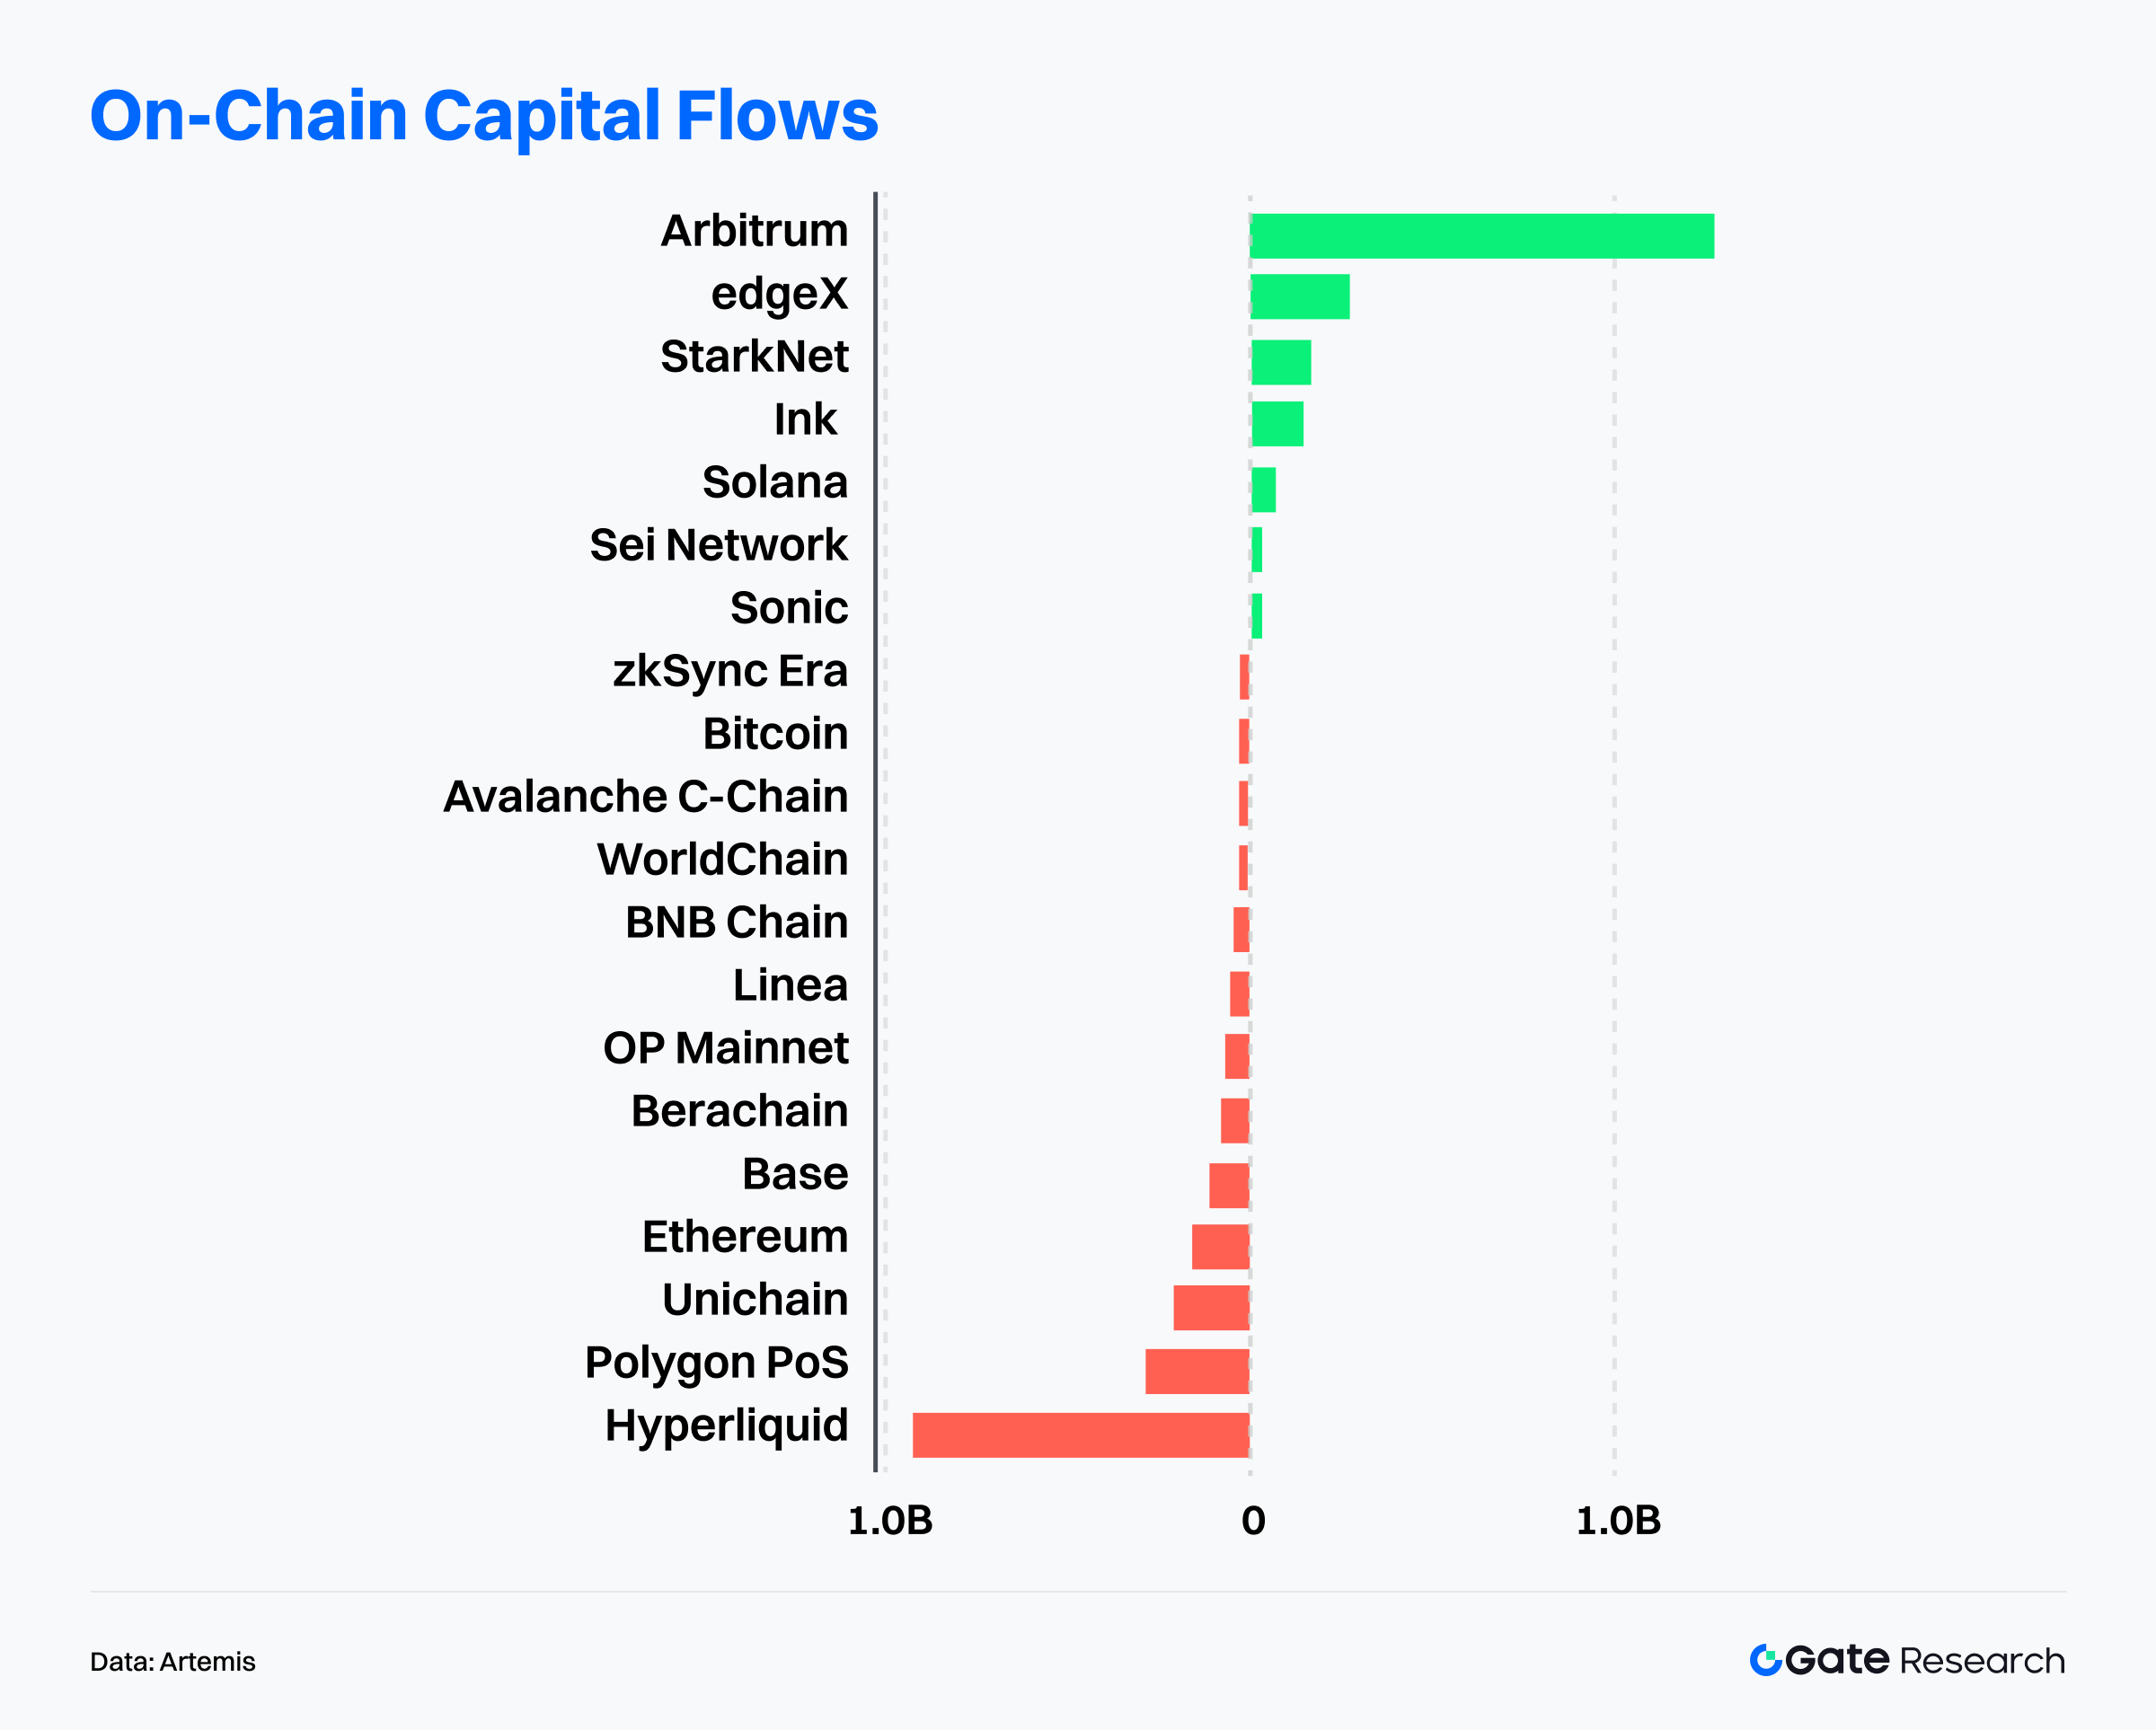
According to Artemis, on-chain capital flows over the past month became increasingly polarized. Arbitrum recorded over $1 billion in net inflows, reversing earlier outflows and solidifying its Layer2 leadership. The primary driver was the ongoing DeFi Renaissance incentive program, distributing 24 million ARB tokens to lending and leverage protocols to boost capital circulation and ecosystem growth — significantly lifting TVL and DEX liquidity.【4】
Meanwhile, Starknet emerged as another focal point of capital return, driven by the BTCFi (Bitcoin Financialization) narrative. The network saw substantial monthly inflows, supported by its collaboration with Alpen to build a native, “unwrapped and verifiable” BTC–DeFi bridge. STRK staking exceeded 600 million tokens (≈14% of circulating supply), signaling rising long-term confidence. The Extended DeFi protocol surpassed $60 million TVL within two months of launch, while total stablecoin TVL exceeded $100 million. The Starknet Foundation also announced a 100 million STRK incentive plan focused on BTC staking, cross-chain interoperability, and institutional expansion — reinforcing its positioning as a “Bitcoin yield and lending hub.”
In contrast, Hyperliquid, Polygon PoS, Unichain, Base, and Ethereum mainnet all saw major net outflows, with Hyperliquid experiencing the largest — nearly $1 billion, the highest across all networks. This reflects a rotation of capital from overvalued mainnets and trading-centric ecosystems toward high-growth Layer2s and innovative blockchains.
Overall, the capital landscape has entered a structural rotation phase. Arbitrum and Starknet are dual leaders within Layer2 — the former reshaping liquidity through incentives, the latter launching a new BTCFi narrative cycle. In contrast, Ethereum and legacy mainnets are facing liquidity pressure. Future capital trends will hinge on ecosystem innovation speed and sustainability of incentive programs; projects demonstrating both genuine user growth and narrative scalability will continue to dominate capital inflows.
Bitcoin Key Metrics Analysis
After reaching a new high of 126,000 USDT in October, Bitcoin (BTC) entered a period of volatile correction, retreating steadily to around $105,000. The price has repeatedly encountered resistance at the MA30, indicating heavy selling pressure above. From a technical perspective, short-term moving averages have turned downward again, forming a bearish crossover, while the MACD has fallen below the zero line and turned negative — signaling bearish dominance. Trading volume failed to expand during rebounds, suggesting cautious market sentiment. Overall, BTC is in a technical correction phase, with key short-term support near $105,000. A breakdown below this level could trigger a move toward the $102,000 range, while stabilization accompanied by a rise in trading volume could lead to a new round of rebound recovery.
Against the backdrop of slowing capital inflows and weaker demand momentum, Bitcoin’s on-chain supply-demand structure and investor behavior have become critical indicators of market health. Current data show dense supply above current levels, suggesting that further price appreciation will require time to absorb selling pressure from higher price zones. Meanwhile, short-term holder sentiment is stabilizing but confidence remains in recovery mode, while long-term holders have begun accumulating coins again, signaling the onset of a capital rebalancing phase. This section focuses on three major on-chain metrics — Realized Price Distribution, Short-Term Holder Realized Value Ratio (STH RVT), and Long-Term Holder Net Position Change — to analyze the distribution of cost bases, capital absorption strength, and potential risks at the current high range from a multi-dimensional on-chain perspective.
Dense Supply Overhead — BTC Breakout Requires Absorbing High-Level Positions
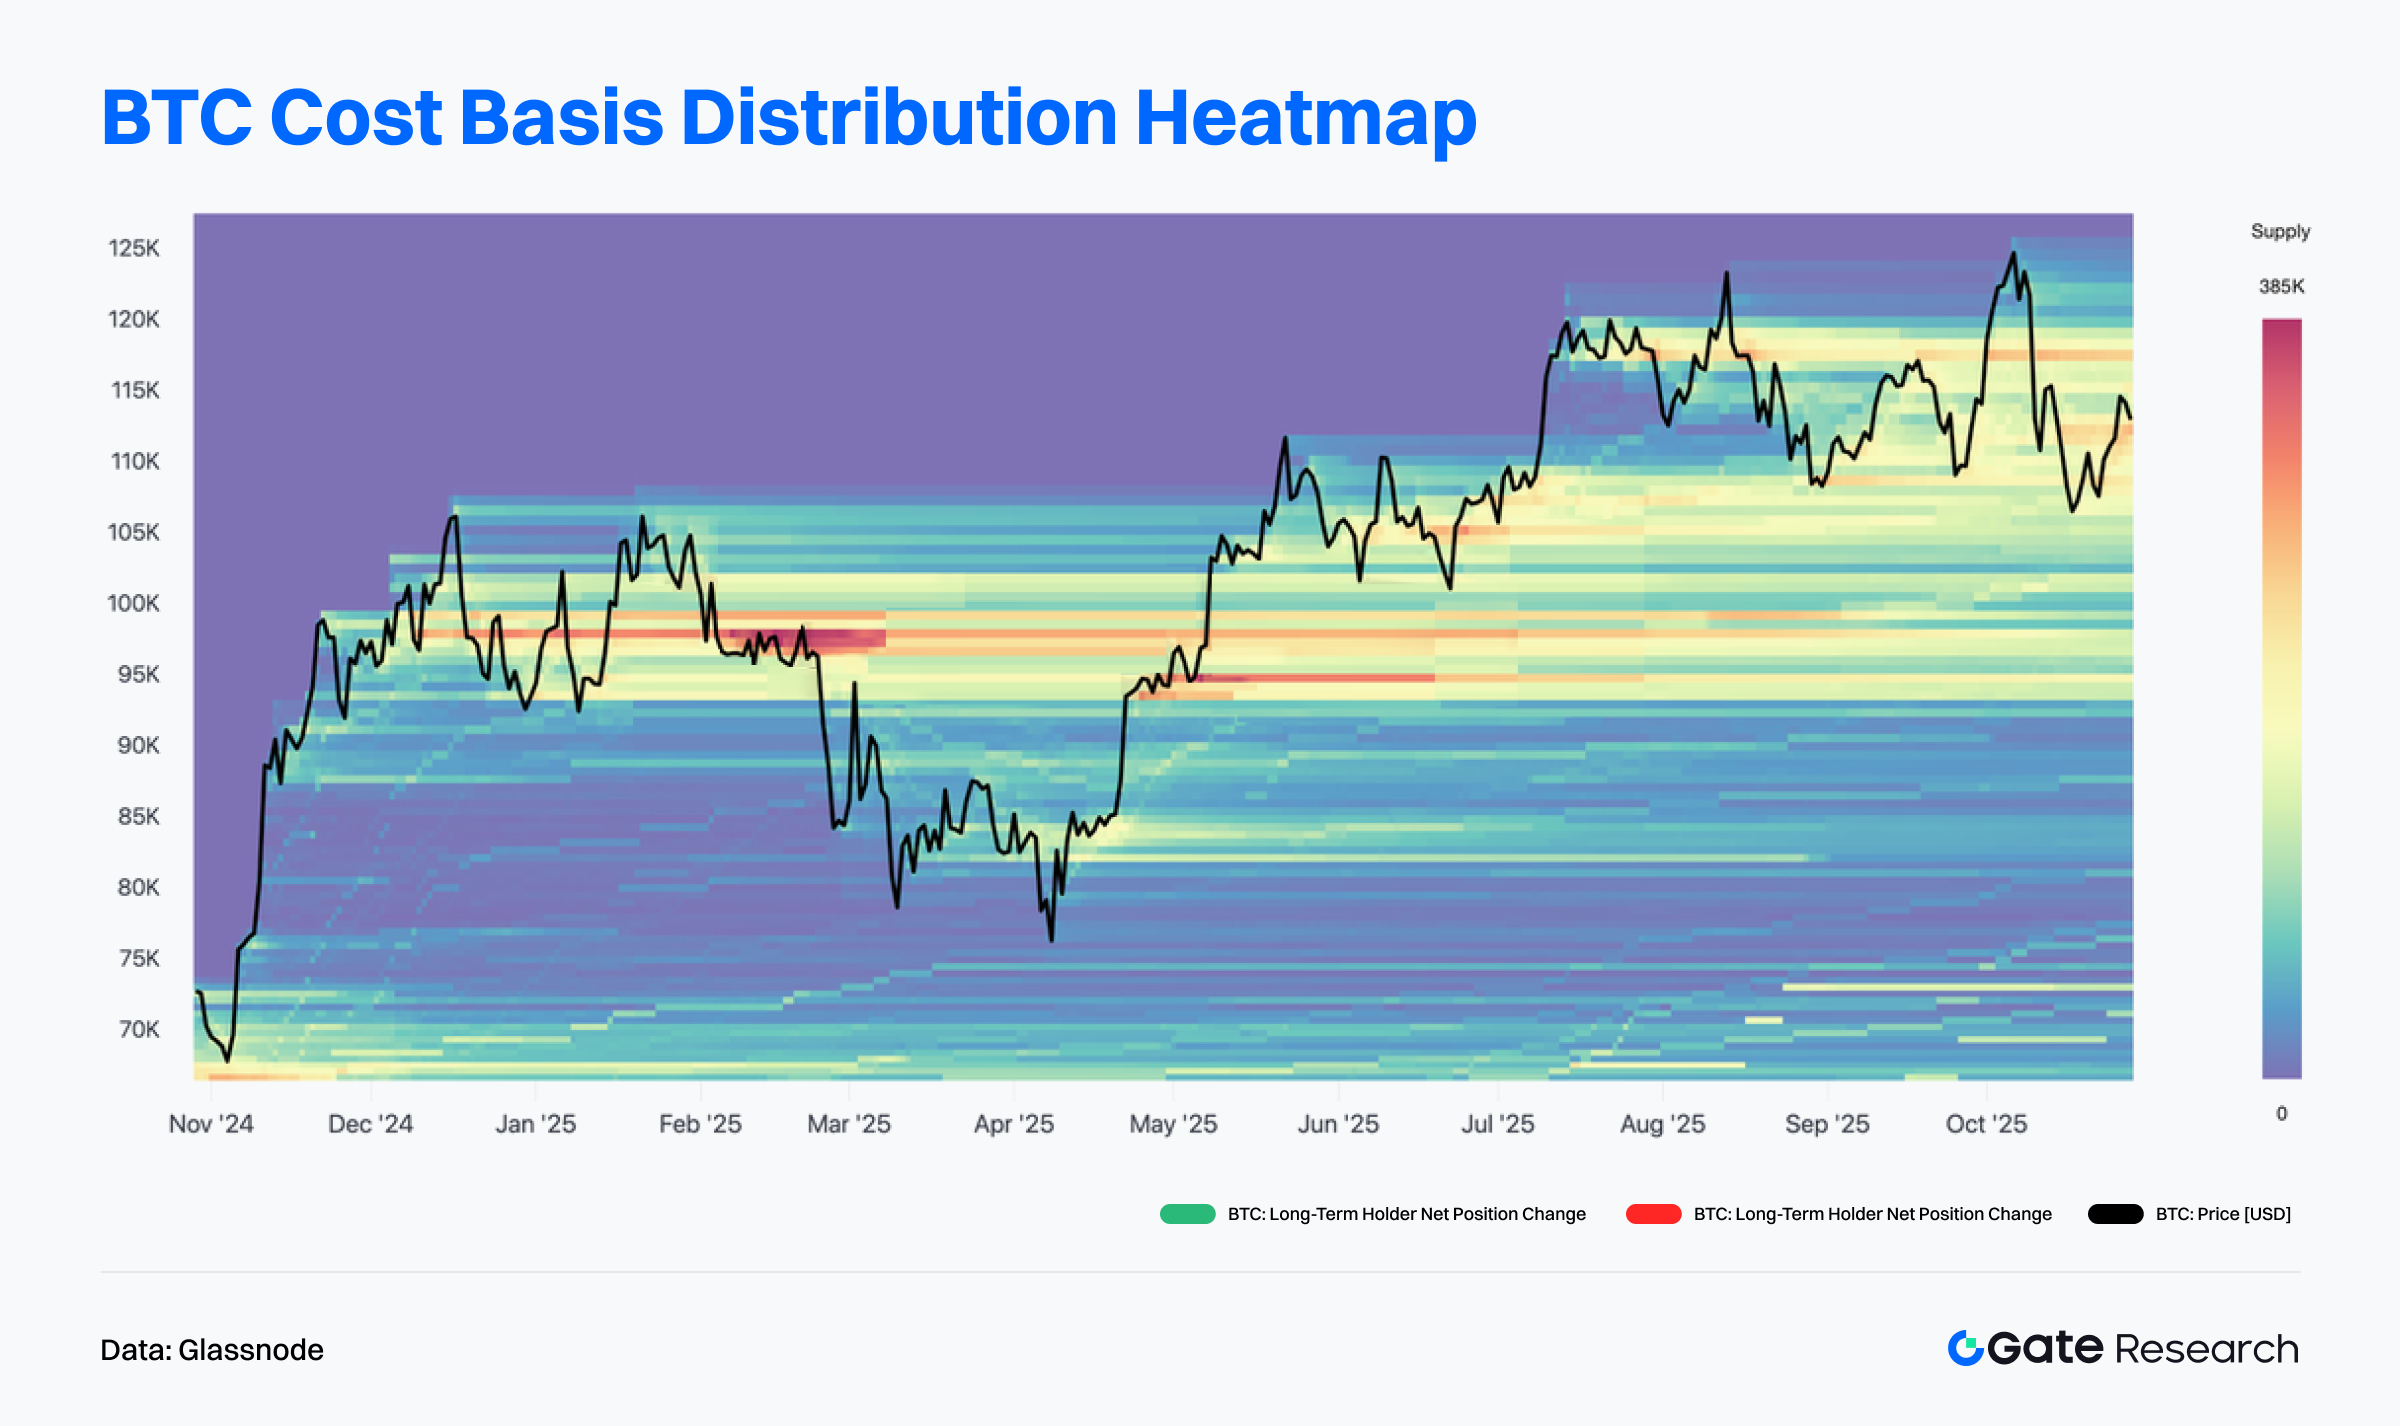
According to Glassnode data, the Realized Price Distribution heatmap indicates that Bitcoin’s cost basis is heavily concentrated in the $105,000–$115,000 range. This zone shows a dense cluster of yellow-blue bands, signifying substantial holding costs — a critical area of turnover and support in the current market. Although prices have recently retreated, they remain above this main cost concentration area, suggesting that most holders are still in profit and short-term support remains relatively firm.【6】
In contrast, positions above $120,000 are sparse — a “vacuum zone.” If capital returns and trading volume expands, prices could quickly break out and establish a new range. Conversely, a drop below $105,000 could trigger profit-taking pressure among short-term holders. Overall, BTC is oscillating near the upper bound of its cost concentration range, with sentiment turning neutral to cautious.
Short-Term Holder Sentiment Stabilizes — Market Confidence Yet to Recover
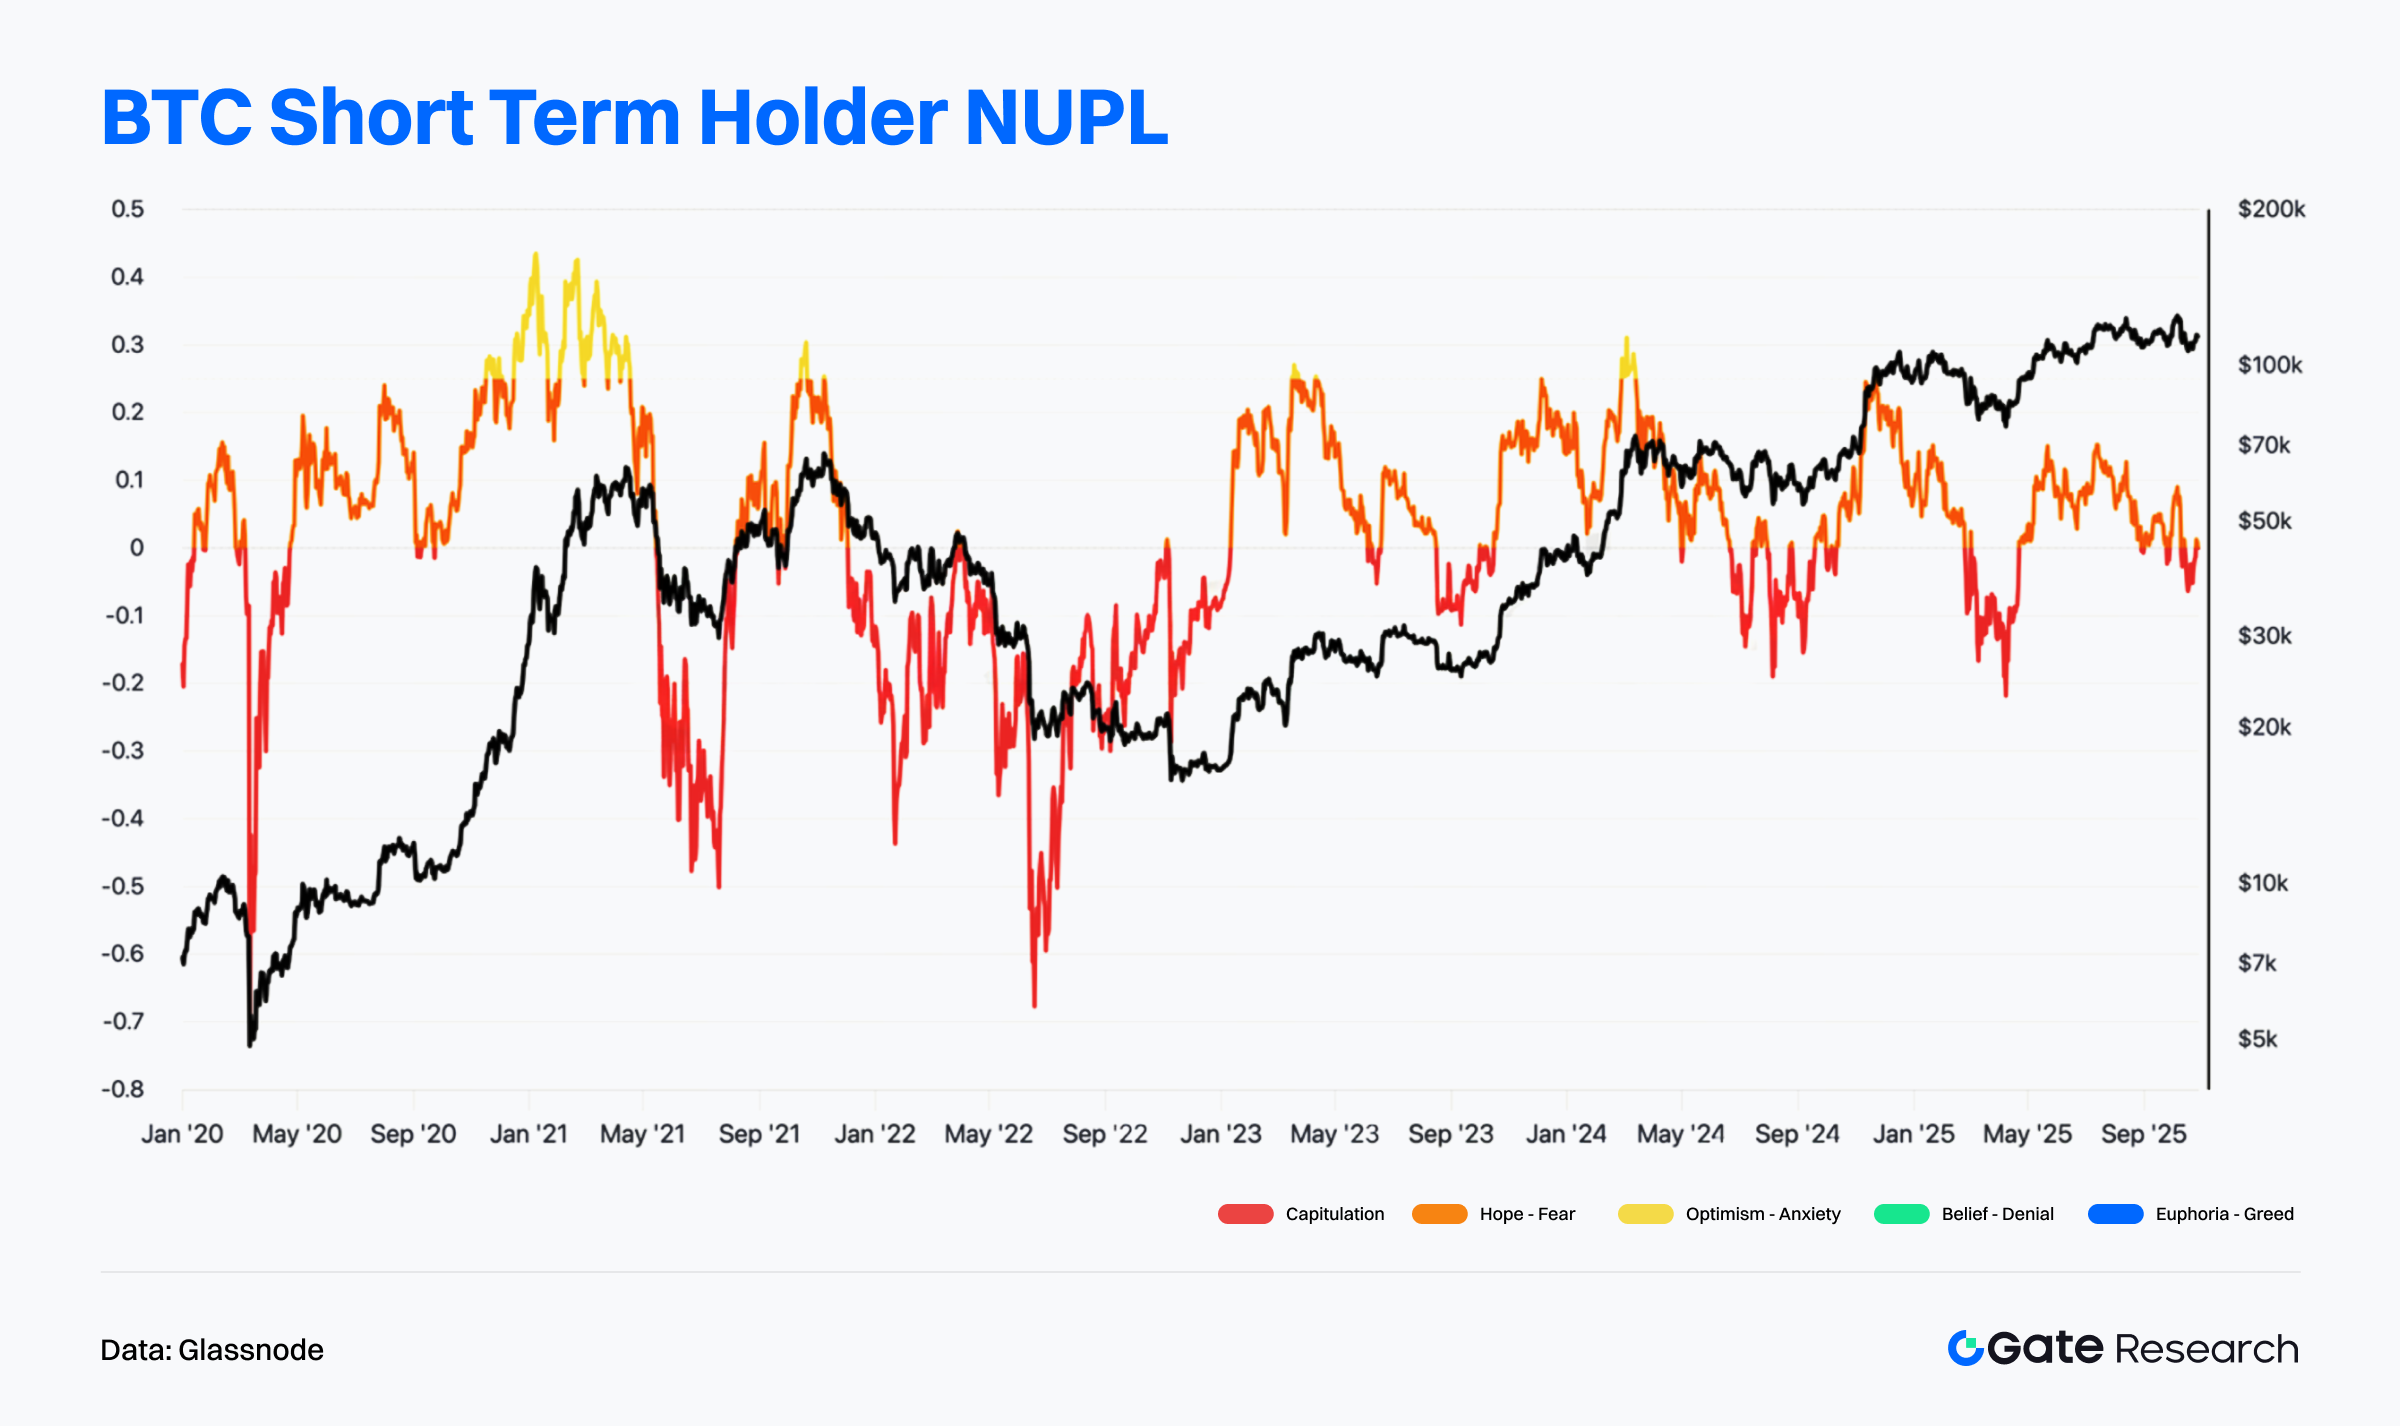
Glassnode data show that the Short-Term Holder Net Unrealized Profit/Loss (STH-NUPL) has been declining and hovering near zero or slightly negative, indicating that short-term investors are in mild loss or breakeven territory. The current STH-NUPL is around –0.05, which, compared with typical mid-cycle corrections (–0.1 to –0.2) or bear market levels (below –0.2), still reflects only moderate losses — meaning the market has not entered a phase of panic selling.【7】
From a price perspective, BTC continues to consolidate between $107,000 and $117,000, where buying demand remains concentrated. Although some selling pressure has been released, market confidence has not yet returned to the “Optimism–Belief” stage. Short-term sentiment remains cautious, and appetite for chasing highs is limited. If prices hold above the dense cost zone and STH-NUPL turns positive, it could signal the start of a new confidence recovery cycle. Conversely, if the indicator falls below –0.1, it would suggest accelerating withdrawal of speculative capital, potentially leading to a mid-term correction phase.
Long-Term Holders Resume Accumulation — Market Enters Capital Rebalancing Phase
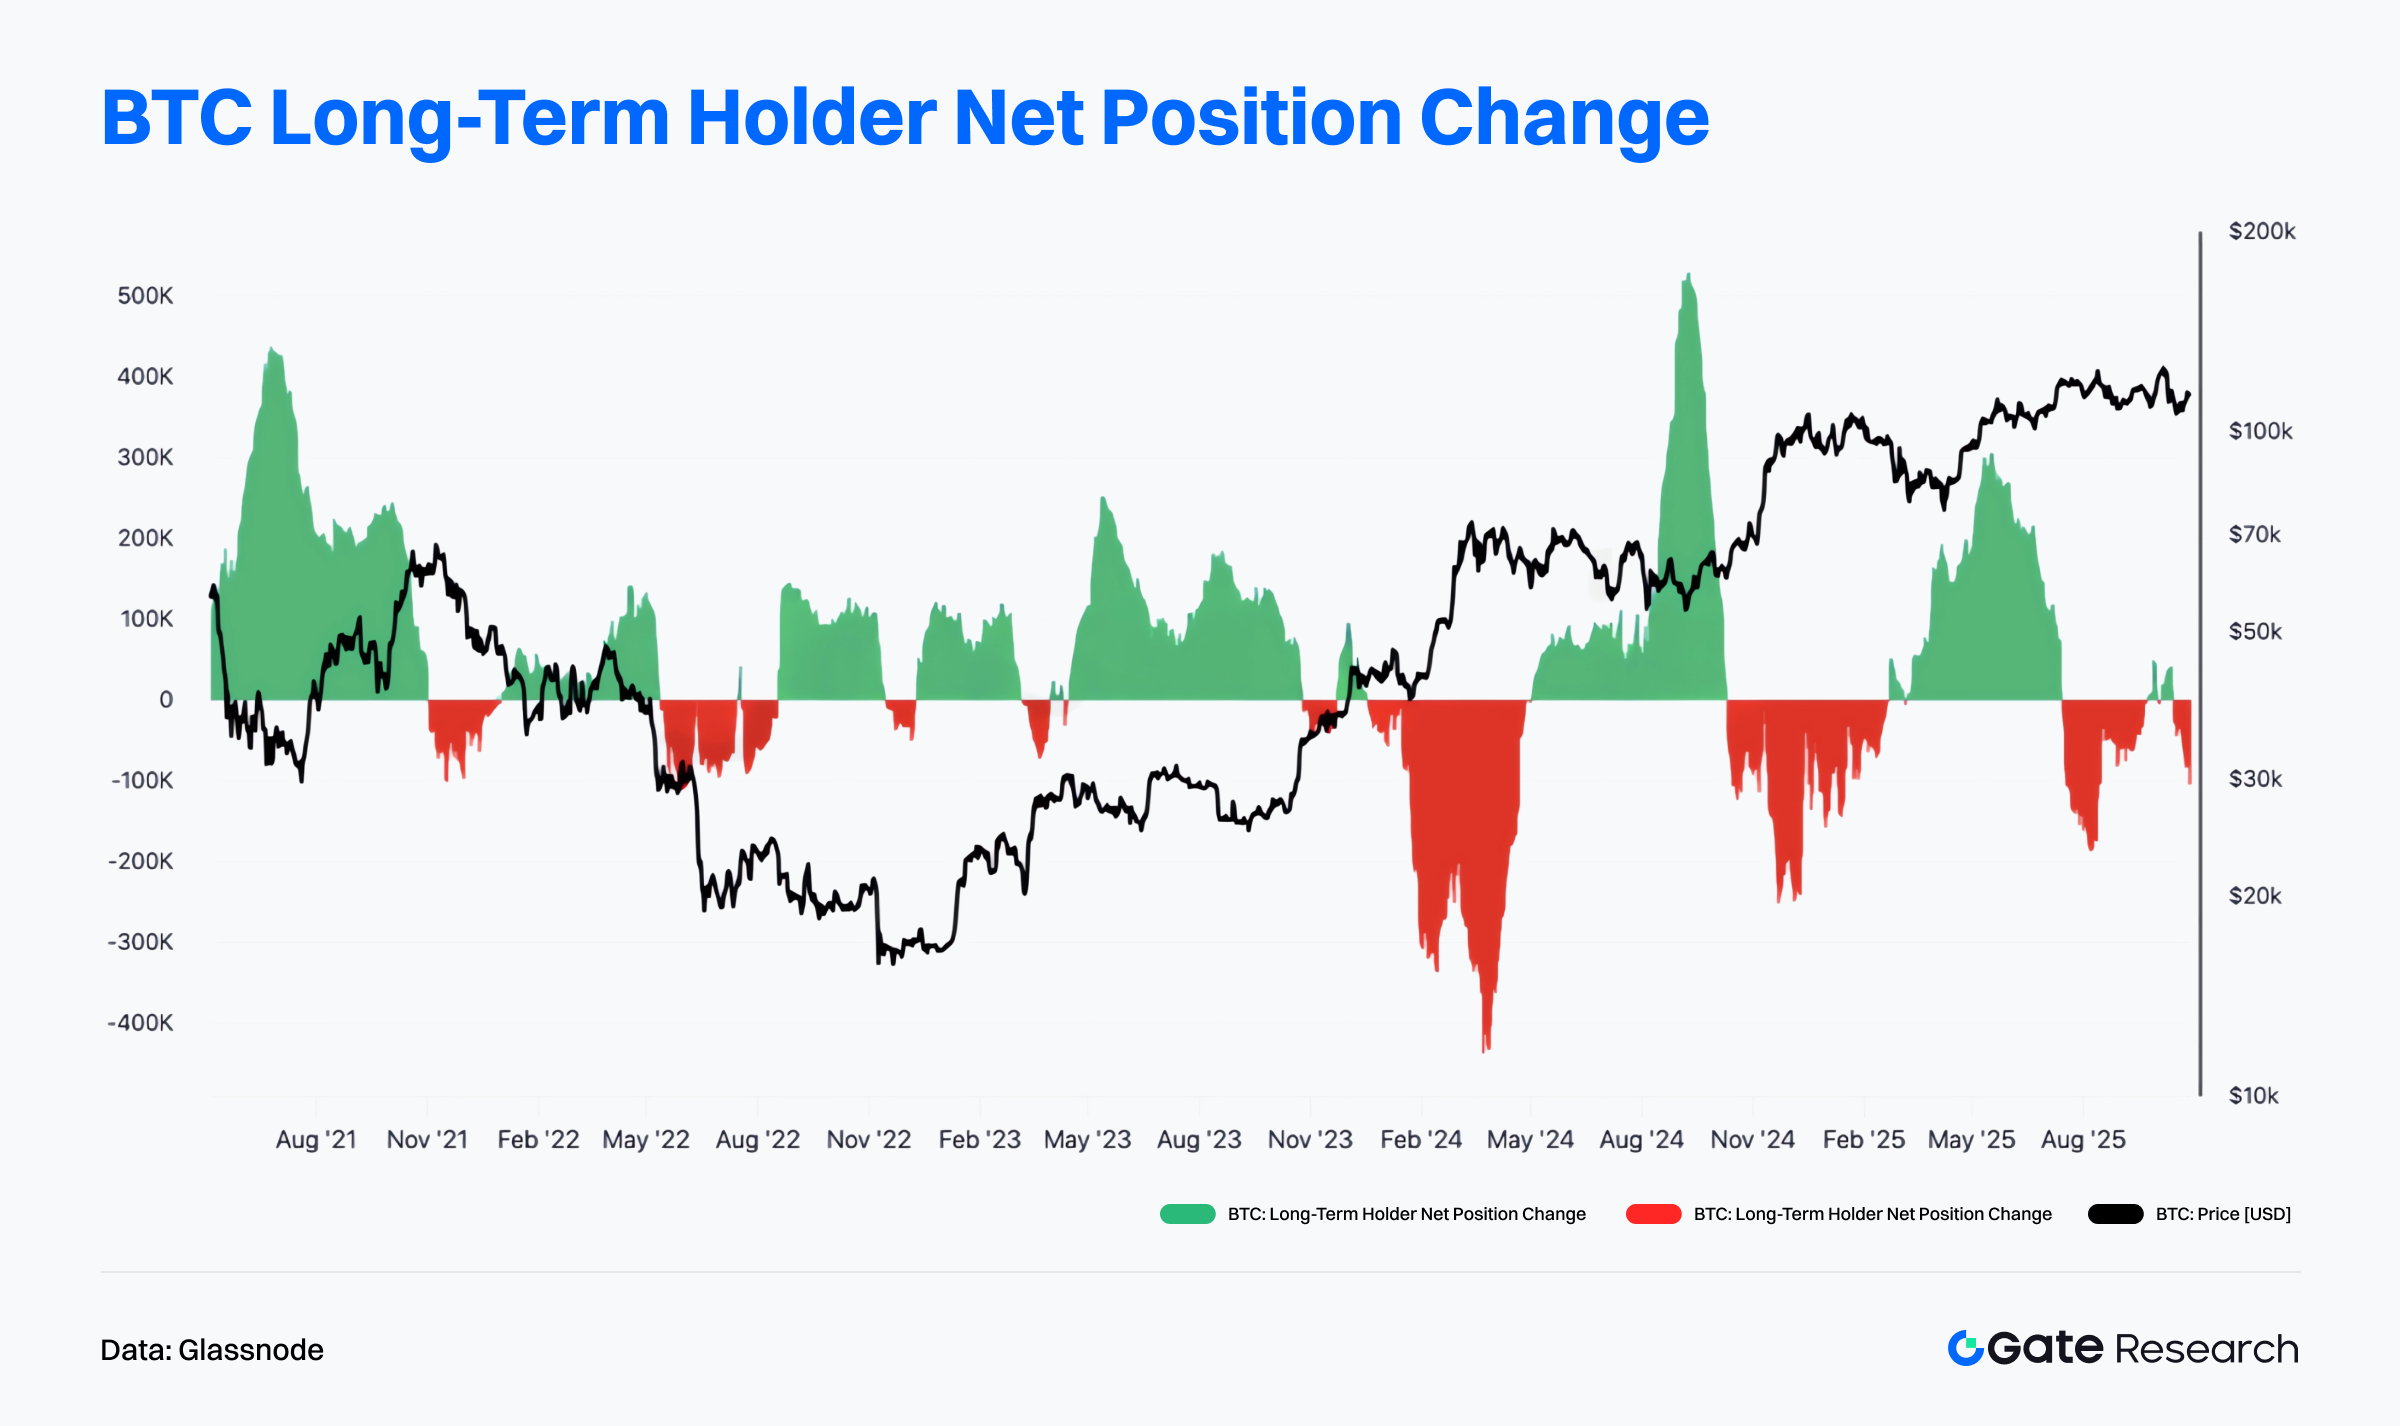
According to Glassnode, the Long-Term Holder Net Position Change indicator shows clear divergence in recent months. Previously, red bars (indicating net selling by long-term holders) expanded significantly, reflecting that some long-term investors took profits at elevated prices — a common behavior when prices reach relatively overvalued zones.【8】
However, green bars have re-emerged recently, signaling renewed accumulation by long-term holders and a modest rebound in net buying pressure. Historically, such transitions from red to green often coincide with bottom-building or mid-cycle reaccumulation phases. Overall, selling pressure from long-term holders has eased, but capital remains cautious. Continued observation is needed to confirm whether stronger long-term inflows emerge — a key condition for confirming confidence recovery and structural bottom formation.
Trending Project & Token Activity
On-chain data indicates that capital and users are increasingly concentrating in ecosystems with solid interaction foundations and strong application depth. Meanwhile, projects with strong narratives and technological innovation are becoming the new focal points for investors. This section highlights the most prominent projects and tokens of recent weeks, analyzing the logic behind their growth and potential market impact.
Overview of Trending Project
Polymarket
Polymarket is currently the most representative on-chain prediction market platform, dedicated to deeply integrating event-based trading with traditional financial markets. Built on the principle that “prediction markets are financial markets,” the platform launched its new product “Up/Down Equity Markets” in October, enabling users to directly bet on stock price movements. This innovation marks the entry of on-chain prediction tools into the traditional stock market sphere, expanding the intersection between DeFi and TradFi, and pushing “information trading” from niche experimentation toward mainstream financial adoption.
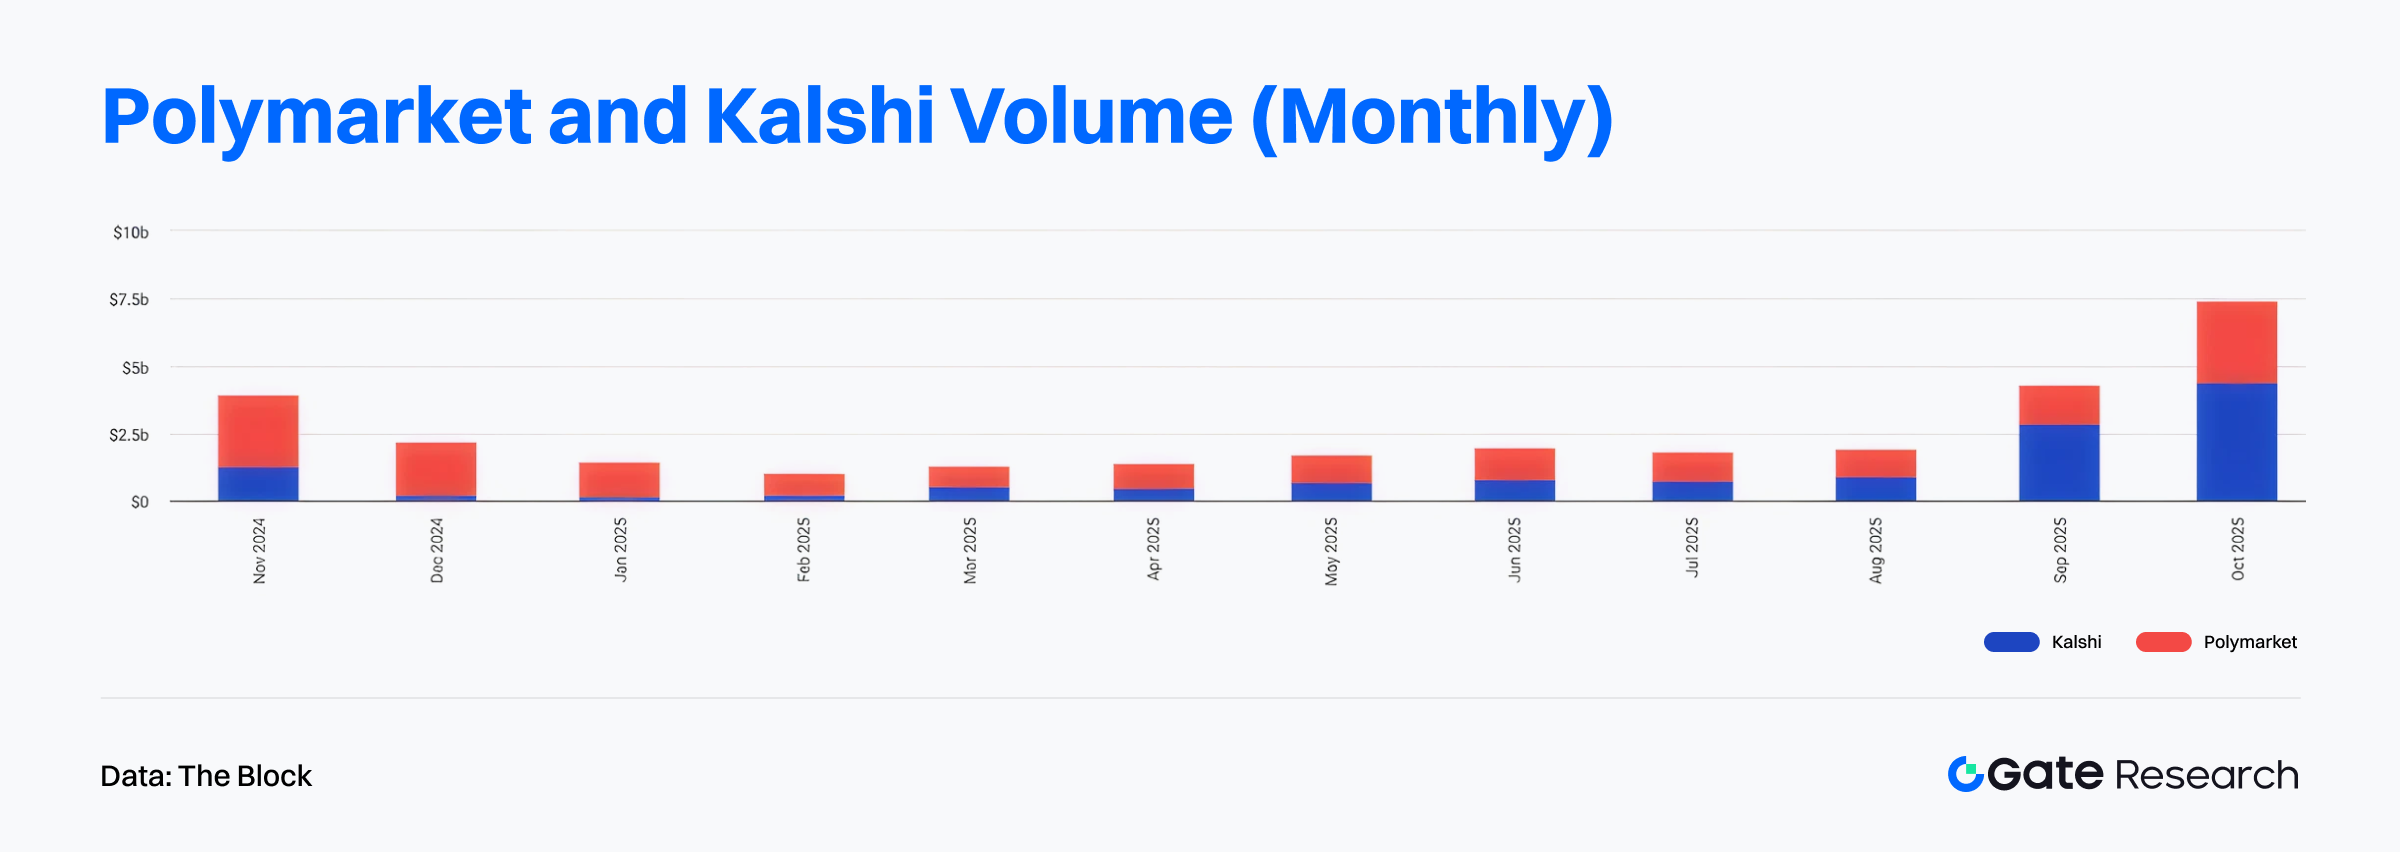
According to The Block, Polymarket has over 440,000 monthly active users and monthly trading volume exceeding $2.7 billion, establishing itself as a flagship platform for the financialization of social narratives on-chain. Together with Kalshi, the combined trading volume of both platforms in October 2025 exceeded $7 billion, indicating a surge in the overall prediction market sector. Both platforms also completed new funding rounds: Polymarket received a $2 billion investment from ICE, raising its valuation to $9 billion; Kalshi secured $300 million in funding at a $5 billion valuation. Notably, Polymarket founder Shayne Coplan became the world’s youngest self-made billionaire, further boosting attention and capital inflow into the sector.【9】
At the technical and ecosystem level, Kalshi’s surge in trading volume was partly fueled by its strategic partnership with Robinhood, which now allows users to participate in sports prediction markets directly through the Robinhood platform. The company’s CEO revealed that the prediction market business has become one of its nine core revenue streams, each generating over $100 million annually. Its unique model combining gambling, trading, and media could potentially reshape three traditional industries. Additionally, Pyth Network announced that it would supply real-time data feeds for prediction markets, significantly improving on-chain transparency and settlement accuracy.
It is also worth noting that Ethereum founder Vitalik Buterin publicly acknowledged the substantial progress prediction markets have made since Augur v1, highlighting Polymarket as a key driver of this breakthrough. Overall, prediction markets are evolving from niche financial experiments into a core narrative of mainstream adoption, gradually becoming essential infrastructure that links on-chain assets, information flow, and cultural transmission, ushering in a new cycle of convergence between decentralized finance and real-world markets.
Overview of Trending Token
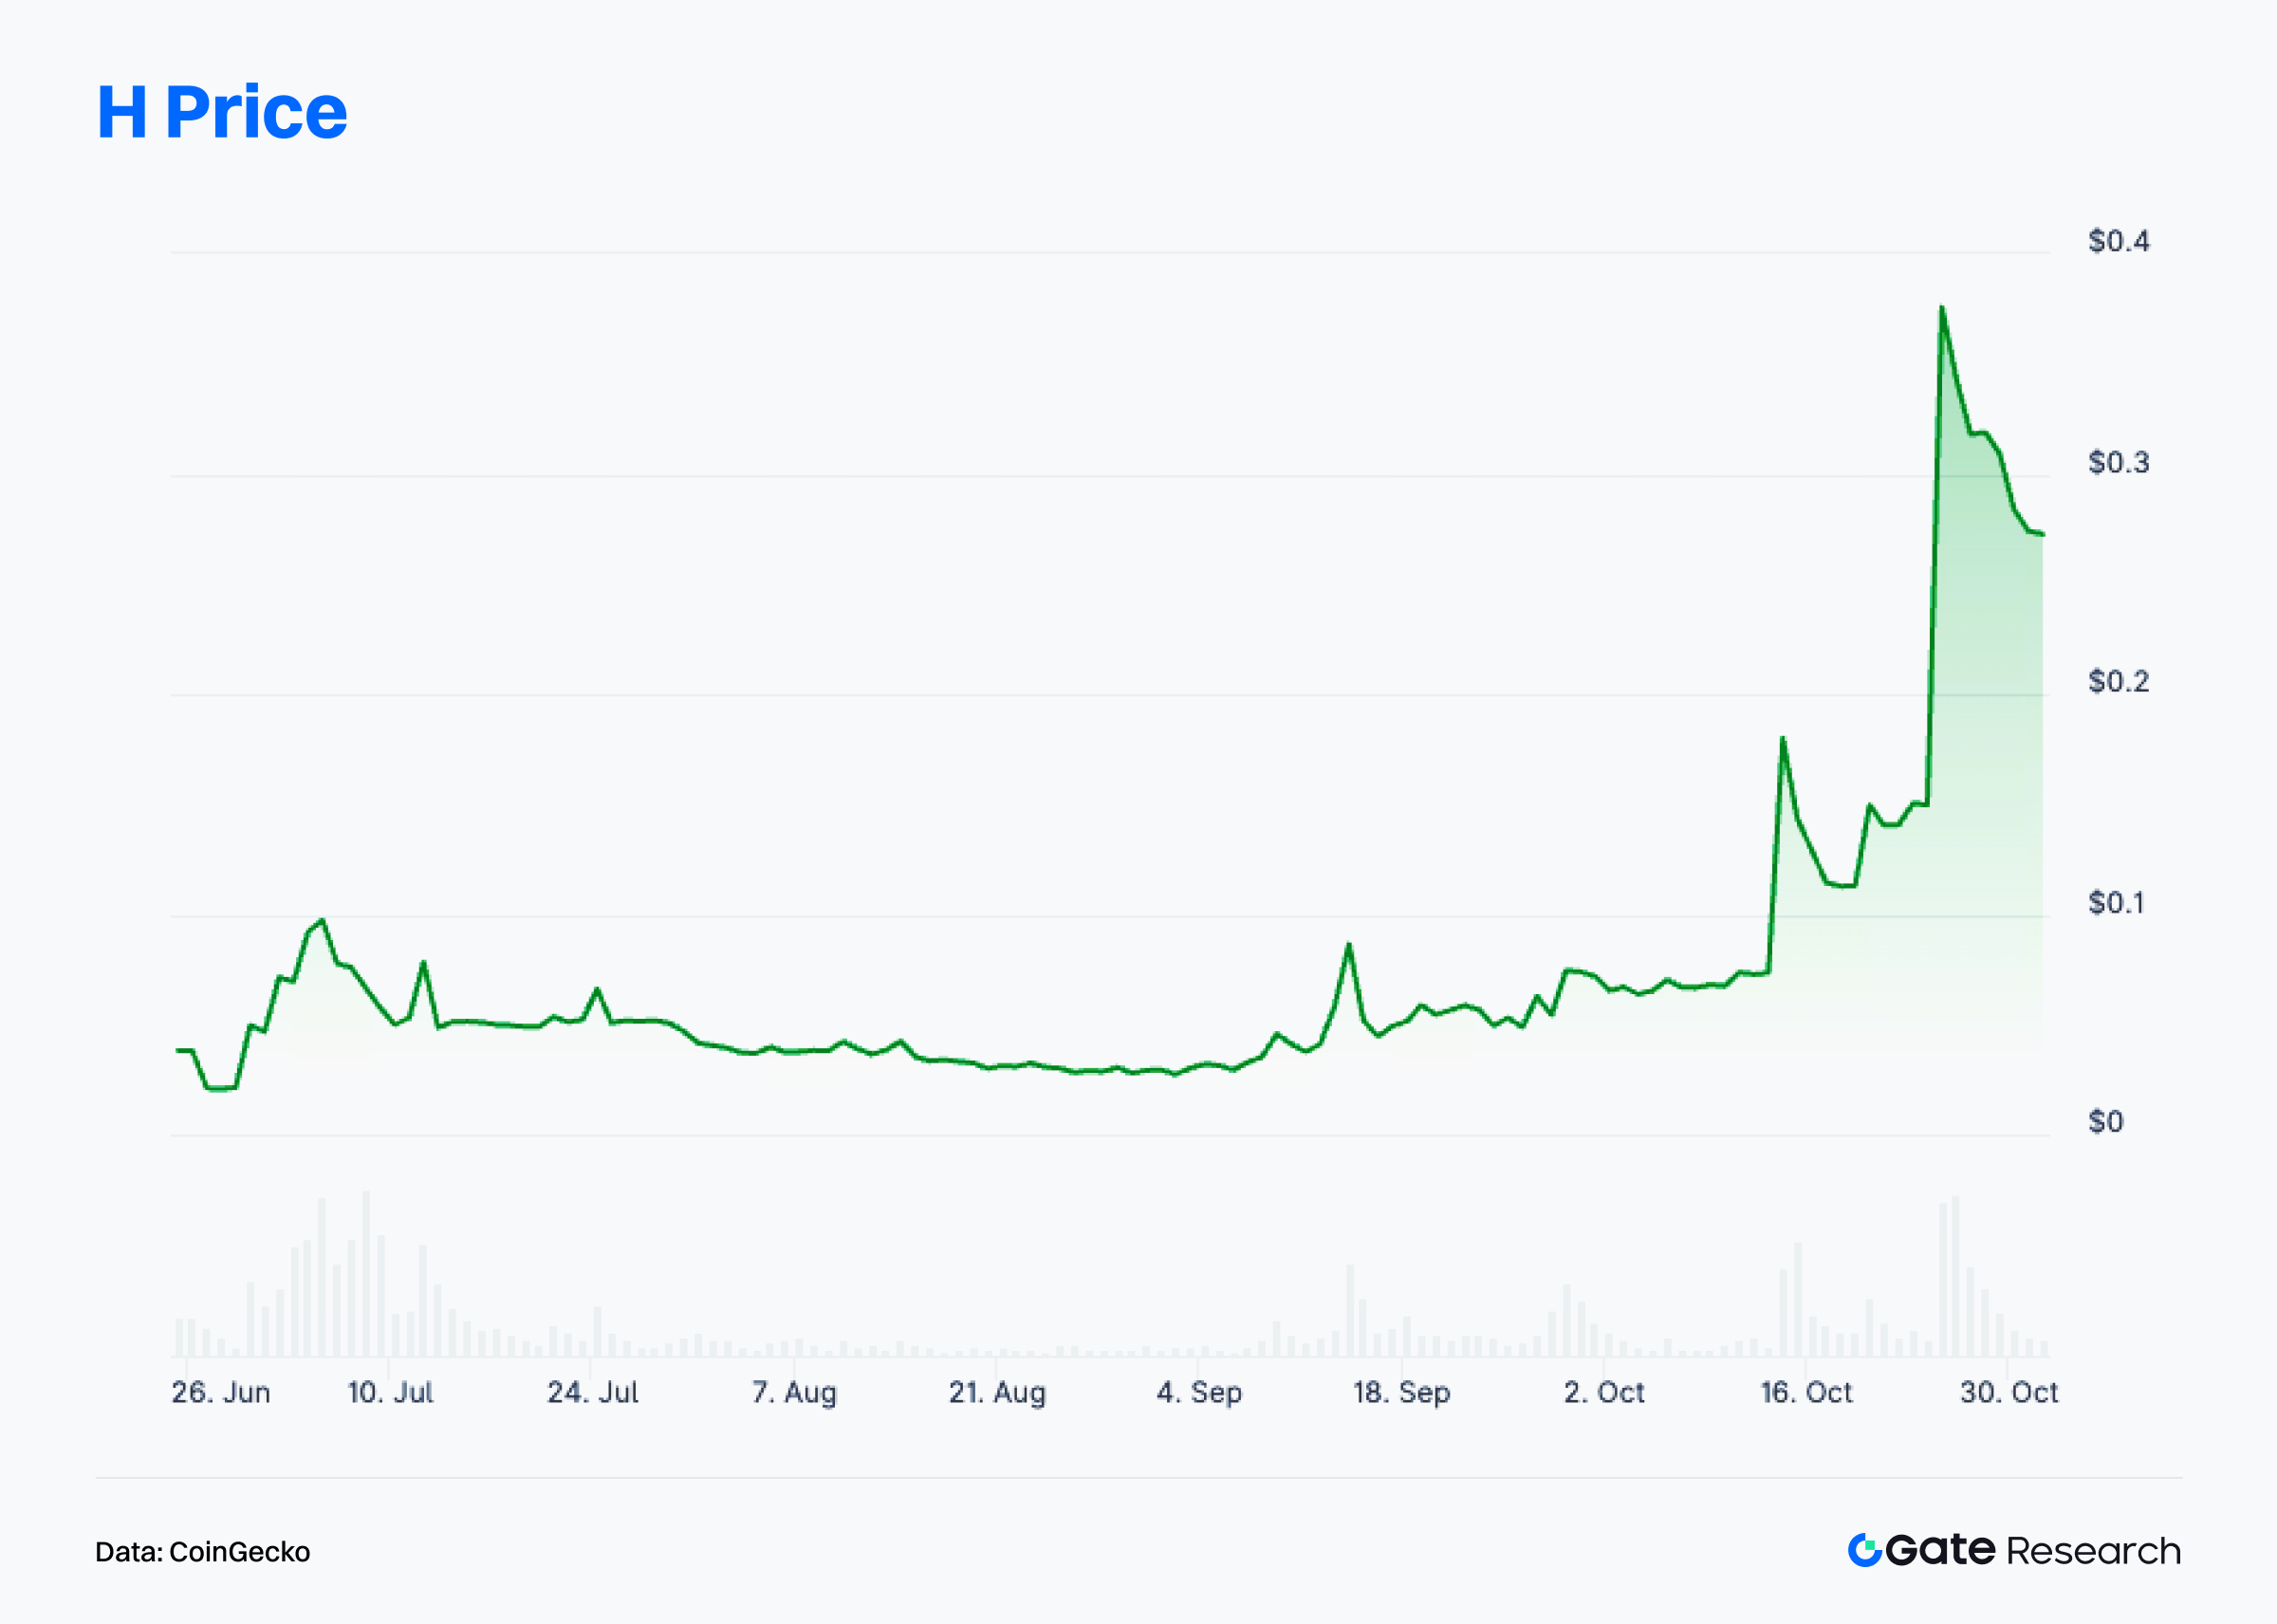
$H
Humanity Protocol is a blockchain focused on decentralized identity verification (DID), designed to resist Sybil attacks through zero-knowledge proof (ZKP) mechanisms. It aims to establish a secure, private, and verifiable system of human identity. Within the protocol, zkProofers verify users’ humanity and receive native $H tokens as rewards. The process ensures anonymity and trustworthiness by not storing any personal data. Humanity envisions an ecosystem where everyone can prove their humanity, protect their identity, and freely participate in the digital economy, achieving self-sovereignty through privacy and trust.
According to CoinGecko, $H has surged over 300% in the past month, with nearly 100% growth in a single week. Humanity’s strong momentum is closely tied to renewed capital inflows into DePIN, DID, and SocialFi sectors. As market risk appetite increases, capital has rotated from major assets such as BTC and ETH toward innovative mid- and small-cap projects, providing structural growth opportunities for $H.【10】
In October, the project team announced that its core module, the Human Identity Layer, has entered internal testing and will soon open its user verification interface, supporting on-chain identity registration and cross-platform social login. Simultaneously, Humanity is collaborating with multiple AI projects to develop datasets for training identity verification models aimed at combating bots and fake accounts in Web3. This makes “Trusted Identity + AI” a new focal point in market narratives.
Community activity has also surged dramatically in late October. Anticipation for the upcoming testnet launch drove explosive growth across Twitter and Discord, with widespread agreement on the idea that “human identity verification equals ownership proof.” Many view this mechanism as the foundational layer for sustainable SocialFi development. While some investors have expressed concerns about token unlock schedules and liquidity distribution, overall sentiment remains positive — social media buzz and KOL endorsements are reinforcing a positive feedback loop of narrative strengthening, rising expectations, and capital inflows.
In summary, Humanity Protocol, centered on zero-knowledge identity verification, has become a leading project in the “AI + DID” narrative. As its core modules go live, AI partnerships expand, and community enthusiasm continues, $H is entering a healthy consolidation phase following its strong rally. The short-term outlook remains resilient, while the mid-term trend will depend on the pace of the identity layer’s mainnet launch and the overall ecosystem rollout.
Conclusion
In October 2025, on-chain activity and capital structures continued to diverge. Layer2 networks and high-performance blockchains saw sustained increases in activity, while major Layer1 chains remained stable overall. Solana maintained its lead with 2.5 billion monthly transactions, demonstrating high-frequency interaction and strong user stickiness. Polygon PoS posted a 22% monthly increase in transaction volume, marking a significant recovery in ecosystem activity. Base and Ethereum grew modestly by 1.8% and 3.9%, respectively, indicating steady mainnet operations. In contrast, Arbitrum was the standout performer — transaction count surged by over 34%, with both liquidity and user activity rising, signaling that capital is increasingly concentrating in leading Layer2 ecosystems.
On the capital front, Arbitrum recorded notable net inflows driven by DRIP incentives and asset tokenization deployments, further strengthening its position as the top Layer2 network. Meanwhile, Starknet, fueled by the BTCFi narrative, emerged as a new focal point and attracted significant capital inflows. By comparison, Ethereum and Base experienced mild outflows, reflecting a liquidity rebalancing phase among major Layer1s amid incentive-driven competition. As for Bitcoin, the price has been consolidating after retreating from recent highs; short-term holdings have stabilized, long-term holders are re-accumulating, and the market as a whole has entered a structural recovery phase.
Overall, the on-chain landscape demonstrates a clear pattern of “high-frequency chains leading, mainnets stable but adjusting.” Capital and usage demand are becoming increasingly stratified, highlighting the differentiation between fast-growing ecosystems and value-stable chains.
At the project level, Polymarket is leading a new wave of on-chain narratives by integrating prediction markets with traditional finance through its “Up/Down Equity Markets” product. The platform now boasts over 440,000 active users and monthly trading volume exceeding $2.7 billion, making it a flagship example of event-based financialization. Meanwhile, Humanity Protocol, focused on zero-knowledge identity verification and the “AI + DID” narrative, has seen its $H token rise by over 300% in the past month. With ongoing technical testing and growing community engagement, it has become one of the most closely watched emerging projects in the decentralized identity space.
References:
- Artemis, https://app.artemisanalytics.com/chains
- Artemis, https://app.artemisanalytics.com/chains
- Artemis, https://app.artemisanalytics.com/chains
- Artemis, https://app.artemisanalytics.com/flows
- DefiLlama, https://defillama.com/chain/arbitrum
- Glassnode, https://studio.glassnode.com/charts/indicators.CostBasisDistributionHeatmap?a=BTC&mScl=lin&period=1y&s=1727838936&u=1759374936&zoom=365
- Glassnode, https://studio.glassnode.com/charts/indicators.NuplLess155?a=BTC&s=1577923200&u=1761696000&zoom=
- Glassnode, https://studio.glassnode.com/charts/supply.LthNetChangePit?a=BTC&c=native&ema=0&mAvg=3&mMedian=0&mScl=lin&pScl=lin&period=1y&resolution=24h&s=1722384000&u=1759276800&zoom=
- The Block, https://www.theblock.co/data/decentralized-finance/prediction-markets-and-betting/polymarket-and-kalshi-volume-monthly
- CoinGecko, https://www.coingecko.com/coins/humanity
Gate Research is a comprehensive blockchain and cryptocurrency research platform that provides deep content for readers, including technical analysis, market insights, industry research, trend forecasting, and macroeconomic policy analysis.
Disclaimer
Investing in cryptocurrency markets involves high risk. Users are advised to conduct their own research and fully understand the nature of the assets and products before making any investment decisions. Gate is not responsible for any losses or damages arising from such decisions.
Share
Content


Related Articles

Reflections on Ethereum Governance Following the 3074 Saga

Gate Research: 2024 Cryptocurrency Market Review and 2025 Trend Forecast

Gate Research: BTC Breaks $100K Milestone, November Crypto Trading Volume Exceeds $10 Trillion For First Time

NFTs and Memecoins in Last vs Current Bull Markets

Altseason 2025: Narrative Rotation and Capital Restructuring in an Atypical Bull Market