Gate Research: BTC Rebounds from Lows as Mid- and Small-Cap Narratives Heat Up — Privacy and AI Sectors Emerge as Capital Focus
Crypto Market Overview
According to CoinGecko data, between October 7 and October 20, 2025, the crypto market exhibited signs of structural adjustment and accelerated infrastructure integration amid heightened volatility. On the price front, BTC found support after bottoming at $102,100 on October 11, forming a “low consolidation and short-term rebound” pattern, while ETH rebounded from around $3,680 on October 13 before facing resistance above $3,980.
At the ecosystem level, Ethereum added 16,181 new developers, maintaining its leading position in the Web3 landscape, followed by Solana and Bitcoin, as developers continued to concentrate on highly compatible and scalable blockchains. The macro risk-off sentiment pushed the market capitalization of tokenized gold to $3.28 billion, while stablecoins acted as a crucial liquidity buffer amid market turbulence. During the same period, Tether and Circle collectively issued about $74 billion, bringing the total global stablecoin supply to an all-time high of $301.5 billion.
In DeFi, JustLend DAO’s TVL rose to $7.82 billion, while Aave’s stablecoin RLUSD reached a circulation of 448 million tokens, signaling accelerated capital inflows into leading protocols. The Starknet ecosystem showed a notable recovery, with over 3 million blocks and 600 million STRK staked, while its new “BTCFi” initiative introduced Bitcoin staking and institutional incentive programs, pushing both TVL and stablecoin circulation to new highs. The prediction market sector continued to heat up — Polymarket received a $2 billion investment from ICE and launched a stock “up/down” prediction feature, driving active wallet counts past 56,000; meanwhile, Kalshi, in partnership with Robinhood, recorded $1.44 billion in trading volume, marking a historical peak.
Meanwhile, institutional adoption continued to accelerate: Taiwanese company OwlTing successfully listed on Nasdaq, and asset management giant Amundi launched a crypto ETF, underscoring the growing institutional presence. Overall, following market deleveraging, risk exposure has narrowed significantly while risk-averse capital remains active within the ecosystem. Capital and narrative focus are gradually shifting toward “high-performance infrastructure + regulated asset tokenization” as the medium- to long-term theme, with BTCFi and prediction markets emerging as the core drivers of the next wave of structural capital inflows and market consensus.
1. Overview of Price Performance
This analysis groups the top 500 cryptocurrencies by market capitalization to observe their average price changes between October 7 and October 20, 2025. The overall average decline was -14.13%, indicating that the market remained in a correction phase following consecutive pullbacks. Performance varied significantly across market-cap tiers, showing a “mid-cap resilience amid deeper corrections at both ends” pattern. Tokens ranked 201–300 recorded the smallest loss at -10.51%, demonstrating stronger resilience in volatile conditions; in contrast, the 101–200 group fell -16.48%, marking the weakest performance. Top-cap assets (ranks 1–100) declined -13.92%, while lower-tier tokens (ranks 301–400 and 401–500) dropped -15.12% and -14.63%, respectively — suggesting that capital did not concentrate in any particular segment, and trading remained cautious and volatile overall.
In summary, the market continued its post-deleveraging consolidation phase, with mid-cap tokens showing relative resilience, while top and lower-tier assets experienced deeper corrections due to liquidity shifts and heightened risk aversion. The market-cap structure reflected a stage of capital caution and sector divergence, signaling that participants are awaiting new liquidity catalysts and macroeconomic signals.
Note: Based on CoinGecko data, the analysis divides the top 500 tokens by market cap into five groups of 100 (ranks 1–100, 101–200, etc.), calculates the price change of each token from October 7 to October 20, 2025, and averages them within each group to derive mean performance by tier. The overall -14.13% decline represents the unweighted average across all 500 tokens.
Figure 1: The overall average decline was -14.13%, with tokens ranked 201–300 showing the strongest relative performance, down only -10.51%.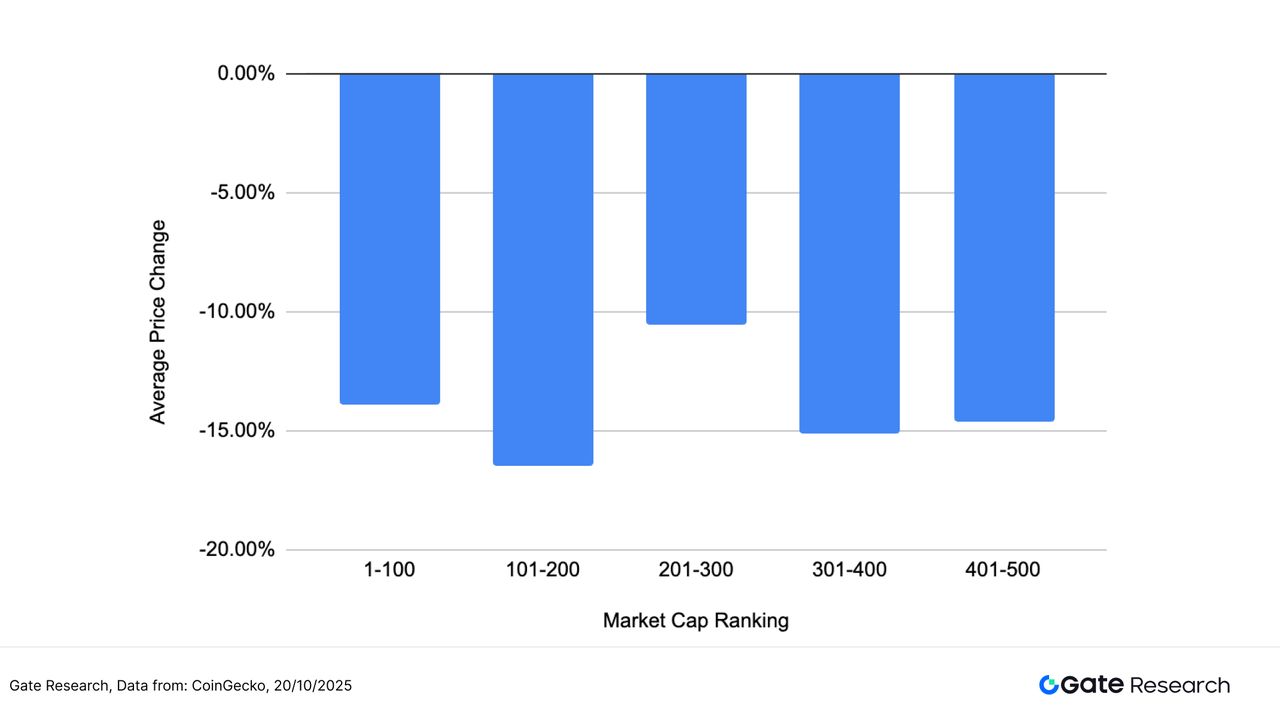
Top Gainers and Losers
Over the past two weeks (October 7–20), the crypto market experienced notable volatility, with capital rotating rapidly among different narrative sectors, leading to sharp divergences in token performance.
Top Gainers: Privacy Narrative Resurgence Led by RAIL
RAIL, the native token of the decentralized privacy protocol Railgun, surged more than 125% in the past two weeks. Railgun focuses on privacy transaction solutions built with zero-knowledge proofs (ZK-SNARKs), enabling fully private transfers and trades across Ethereum and compatible chains. In mid-October, the project announced that its total private transaction volume exceeded $4 billion (with $1.6 billion from 2025 alone) and confirmed plans to host the Privacy & Compliance Summit 2025 on November 19, fueling strong expectations for a revival of the privacy narrative. As regulatory discussions around compliance intensified and liquidity flowed back into the privacy sector, RAIL emerged as the standout leader in this theme.
Meanwhile, H (+114.02%) and COAI (+112.00%) followed closely, the former benefiting from on-chain gaming expansion, and the latter gaining traction with its AI + data computation narrative—reflecting investors’ preference for mid-cap tokens with compelling storytelling.
Top Losers: XAN Leads Declines as Profit-Taking and Capital Rotation Weigh on Prices
In contrast, XAN (-63.25%) posted the steepest losses after a prior rapid rally that lacked sustainable catalysts and trading support. As capital rotated back into major assets and short-term profit-taking intensified, XAN saw a sharp pullback from its highs. Other tokens such as UXPL (-60.09%), AIA (-60.08%), and XPL (-60.05%) also fell significantly, largely due to previous overextensions and fading market enthusiasm.
Overall, the period reflected a dual narrative structure—a revival in privacy and AI narratives alongside corrections in overheated themes. Privacy-focused projects attracted renewed capital amid compliance discussions and rising on-chain activity, while speculative tokens underwent rapid shakeouts. Looking ahead, market attention is likely to center on long-term themes combining privacy compliance and AI integration.
Figure 2: RAIL surged 125.93%, driven by the privacy narrative revival and anticipation of the November Privacy & Compliance Summit.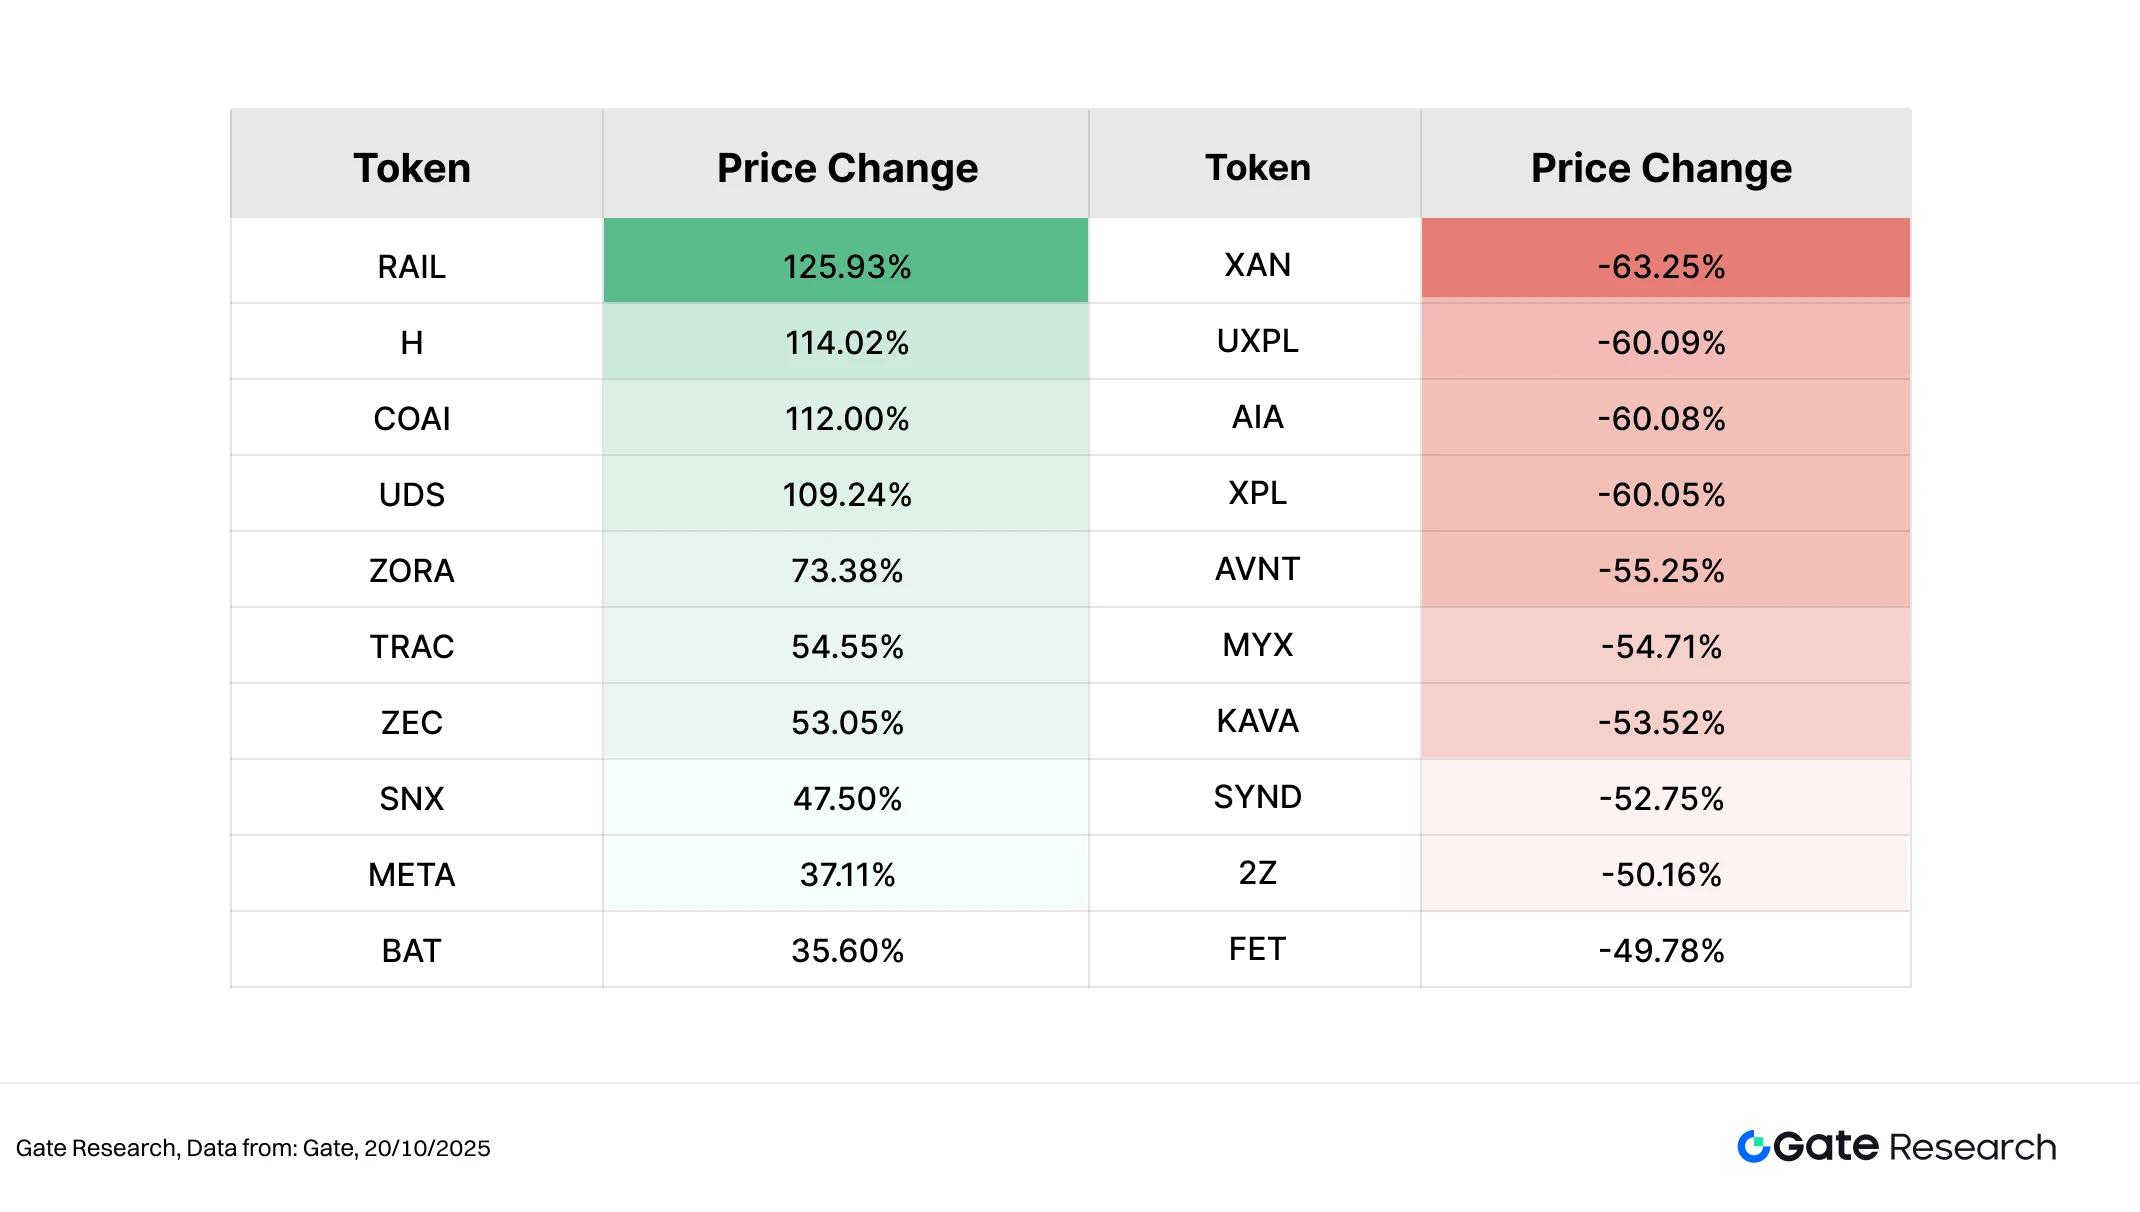
Relationship Between Market Cap Ranking and Price Performance
To analyze the structural characteristics of token performance during this market cycle, this report presents a scatter plot of the top 500 tokens by market capitalization. The x-axis represents market cap ranking (with higher-cap tokens on the left), and the y-axis shows price changes from October 7 to October 20. Each dot represents a token — green indicates a gain, while red indicates a loss.
Overall, the number of declining tokens far exceeded gainers, indicating that the market remained in a correction phase. Most declines were concentrated in the -10% to -20% range, while tokens gaining over 50% were relatively few and mostly located in the mid- to lower-cap range, suggesting that market capital has favored smaller, higher-volatility assets.
Among the top performers, RAIL (+125.93%), H (+114.02%), and COAI (+112.00%) stood out. RAIL led the privacy narrative rally, boosted by growing interest in privacy solutions and anticipation surrounding the Privacy & Compliance Summit 2025, while H and COAI attracted attention for their AI and innovative application themes.
In contrast, the largest decliners were primarily tokens that had previously experienced excessive speculation or suffered from limited liquidity — including XAN (-63.25%), UXPL (-60.09%), and AIA (-60.08%) — which saw sharp corrections as profit-taking and capital withdrawal followed short-term rallies.
In summary, market sentiment remains cautious, with capital preferring short-term trading and thematic rotation. Mid- and small-cap tokens continue to exhibit both high volatility and high risk, while large-cap assets remain relatively stable, highlighting the structural divergence in current market behavior.
Figure 3: Among the top 500 tokens by market cap, declining tokens dominate, while standout gainers are mainly concentrated in the mid- to lower-cap segments, reflecting investors’ preference for high-beta and strong-narrative assets.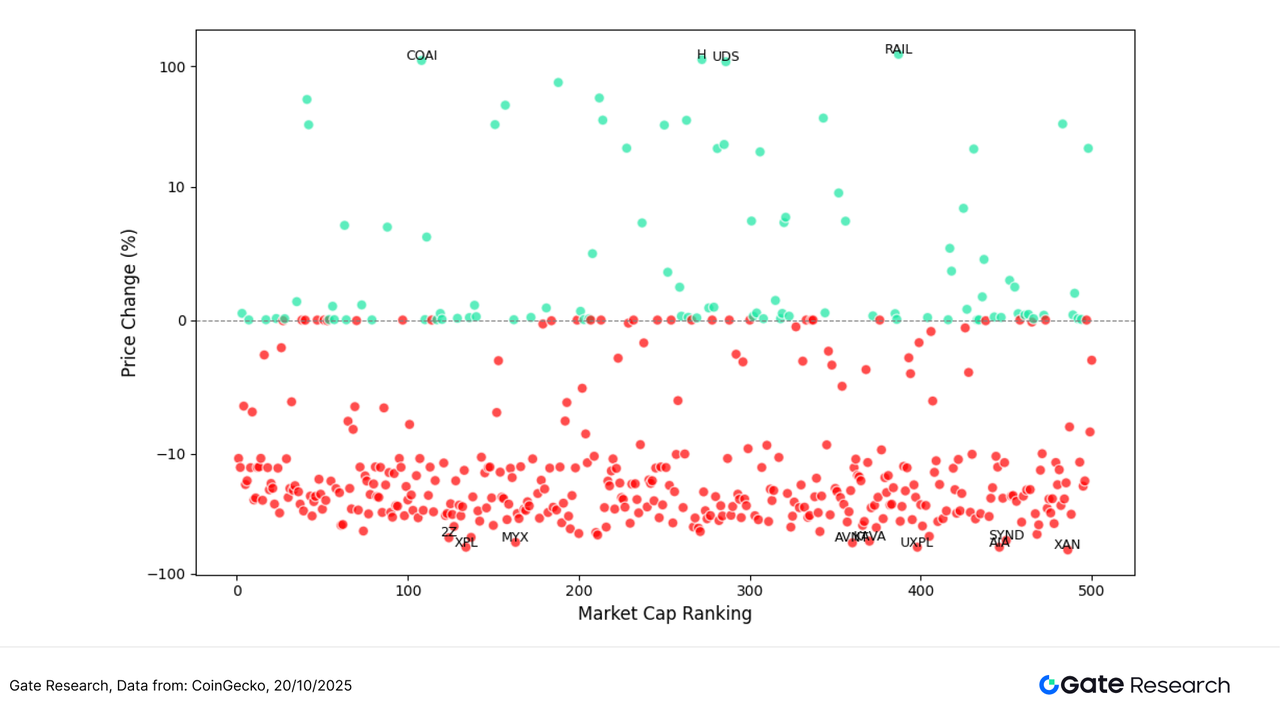
Top 100 Market Cap Leaders
During this period of market volatility, the top 100 tokens by market capitalization showed clear performance divergence. While major assets generally remained stable, several tokens with strong narrative or hedging appeal stood out. Among the top five gainers, ZEC (+53.05%) led the pack, driven by renewed interest in the privacy sector and rising attention toward decentralized privacy protocols. TAO, representing decentralized AI networks, maintained strong momentum amid sustained market enthusiasm. Meanwhile, PAXG (+6.96%) and XAUT (+7.09%) benefited from rising gold prices and heightened risk aversion, making them representatives of steady-return assets. XMR (+1.38%) also posted modest gains supported by the ongoing privacy narrative. Overall, the leading gainers were primarily concentrated in the themes of “privacy” and “real-world asset (RWA) anchoring.”
In contrast, several popular tokens saw sharp corrections among the top decliners. IP (-44.09%) recorded the steepest drop due to fading speculative hype and capital outflows. ASTER (-39.51%) and APT (-38.91%) both underwent significant pullbacks, indicating weakened capital momentum in the major public chain sector. Meanwhile, PUMP (-33.78%) and WLFI (-33.03%) were hit by cooling community-driven speculation, facing short-term downward pressure. Overall, capital within the top 100 tokens has shown a preference for assets with defensive qualities and long-term narratives, while high-beta and meme-related tokens experienced widened volatility.
Figure 4: Within the top 100 tokens by market cap, ZEC and TAO led the gains, while PAXG and XAUT rose modestly amid risk-off sentiment. On the downside, IP, ASTER, and APT posted the largest losses, reflecting a temporary decline in market risk appetite.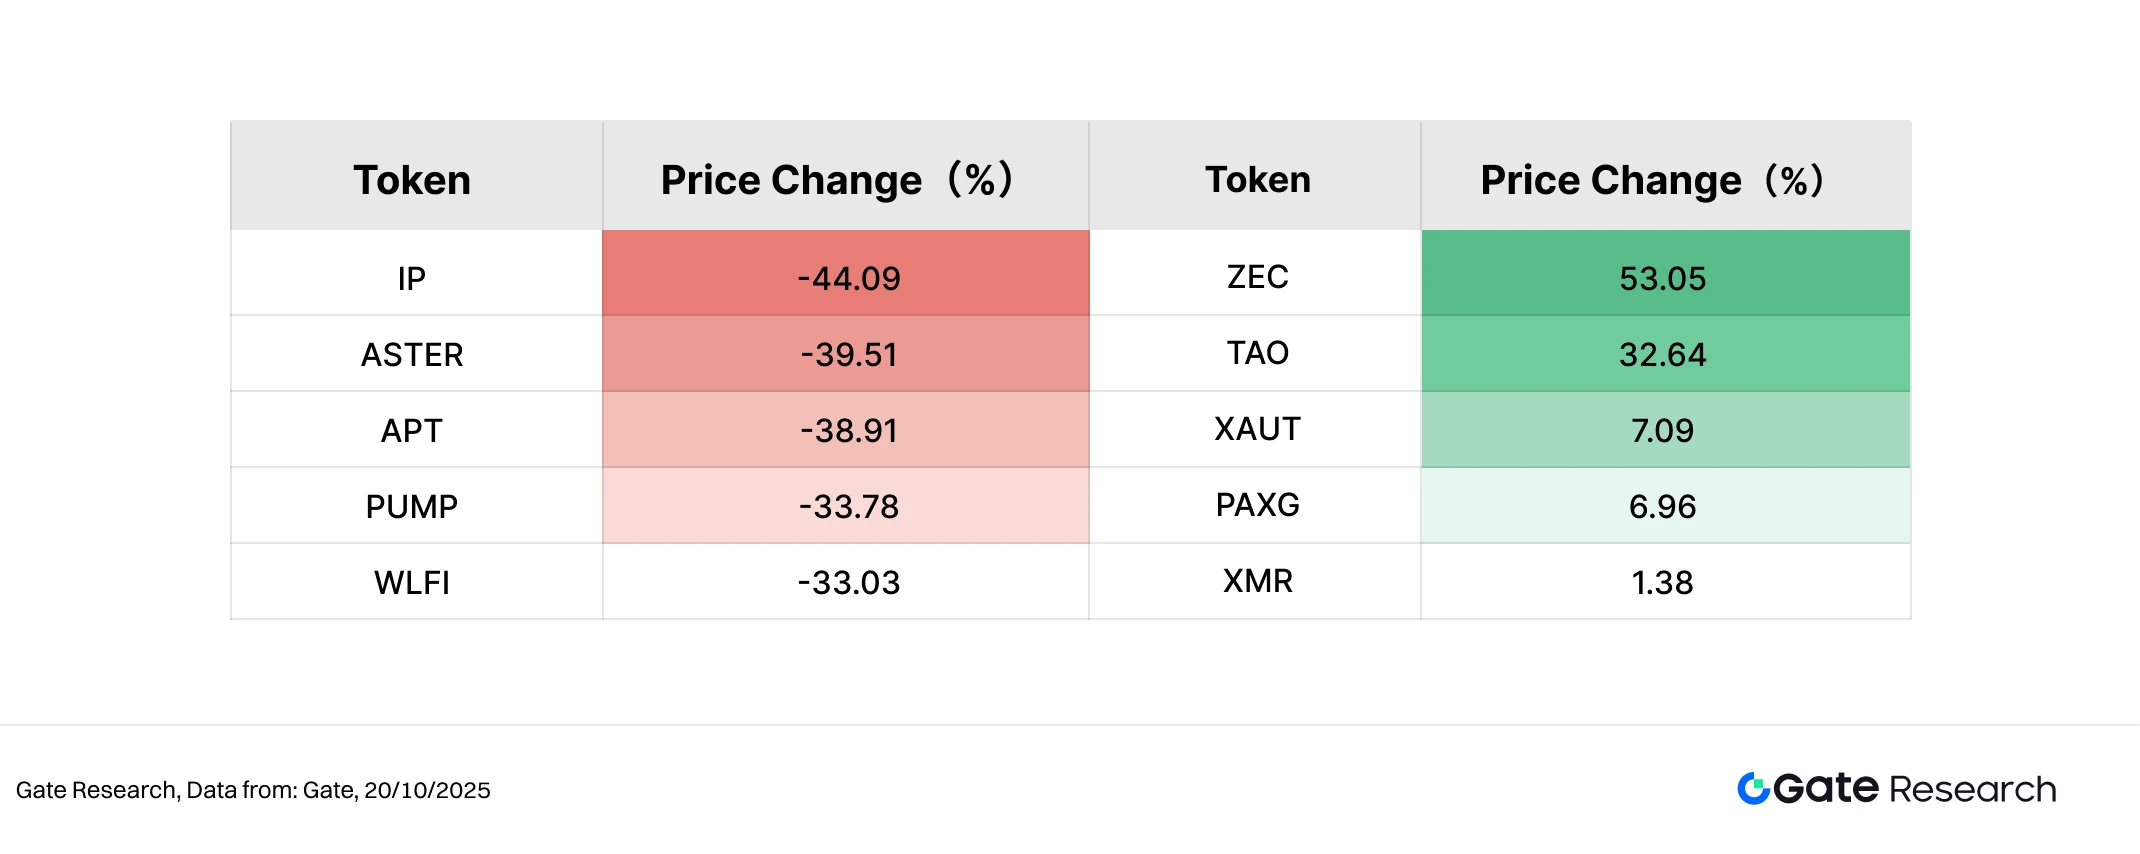
2. Volume Surge Analysis
Trading Volume Growth Analysis
Beyond price performance, this report also analyzes trading volume changes for selected tokens to assess market activity and capital participation. Using pre-rally trading volumes as the baseline, volume growth multiples were calculated and compared against corresponding price changes to evaluate market attention and short-term capital behavior.
Data shows that EBTC, AGENTFUN, SN64, VKHYPE, and KAG were the five tokens with the most significant increases in trading volume during the period. EBTC recorded a 14.31× surge in volume, and although its price declined -9.72%, the sharp rise in activity suggests a notable increase in market sentiment and short-term trading interest. AGENTFUN also saw a 10.61× jump in volume but fell -27.52%, indicating intense speculative trading without sustained buying support.
In contrast, SN64 stood out as the strongest performer, with a 9.99× increase in trading volume and a simultaneous 33.18% price rebound, showing a classic “volume–price resonance” pattern that reflects strong market consensus and emotional momentum. KAG also recorded a 5.65× rise in volume along with a modest 7.30% price uptick, suggesting steady capital inflows. VKHYPE, despite an 8.12× volume surge, dropped -17.57%, implying that capital participation was short-lived.
Overall, the tokens with sharp volume expansion were mainly concentrated in the mid- to small-cap range, where trading activity rose significantly but price performance diverged. This pattern indicates that the market remains in a short-term rotation and sentiment-driven phase. While a surge in trading volume does not necessarily guarantee price appreciation, it often signals emerging capital interest and potential narrative momentum.
Figure 5: Tokens such as EBTC, AGENTFUN, and SN64 saw notable trading volume expansion during the period, with SN64 exhibiting clear volume–price resonance, making it a key focus among mid- to lower-cap assets.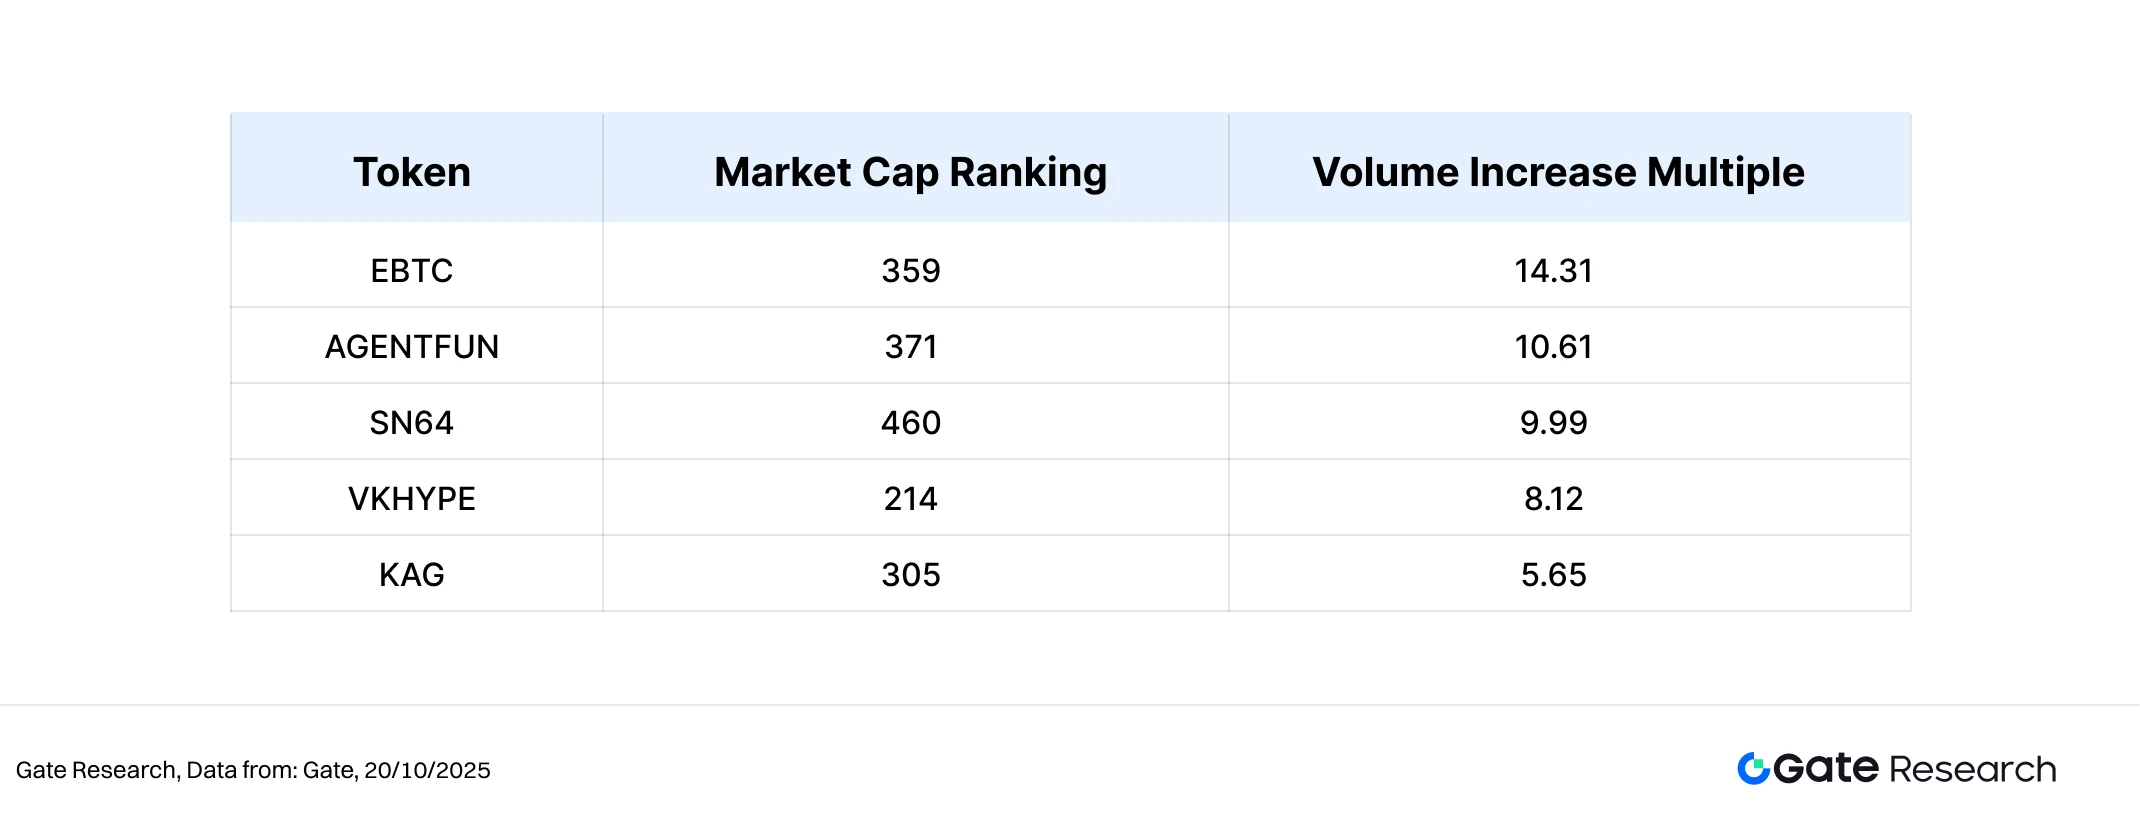
Volume-Price Relationship Analysis
Building on the previous analysis of abnormal trading activity, this section combines volume growth and price performance to present a scatter plot of Volume Increase Multiple vs. Price Change (%). The x-axis represents each token’s trading volume growth multiple over the past two weeks relative to the baseline period, while the y-axis shows the corresponding percentage change in price. A symmetrical logarithmic scale is used to clearly illustrate the structural relationship between “volume expansion” and “price movement.”
From the chart, the upper-right quadrant clusters tokens that experienced both significant volume expansion and concurrent price increases—representing the core targets of structural capital rotation within the current market. Among them, SN64 stood out, with trading volume surging nearly 10× and price rising over 30%, likely driven by news that Chutes AI became the largest open-source inference provider on OpenRouter. This development sparked strong attention toward its ecosystem narrative, creating a “volume–price resonance” pattern fueled by the “AI + decentralized inference” theme.
In contrast, EBTC and AGENTFUN recorded volume increases of 14.31× and 10.61×, respectively, but still saw price declines of -9.72% and -27.52%, suggesting that higher trading activity failed to trigger price reversals amid a speculative short-term trading environment. SATUSD also posted a sharp volume spike but weak price performance, indicating that capital was concentrated in arbitrage or short-term hedging strategies rather than sustained accumulation.
Overall, tokens in the upper-right quadrant tend to exhibit clear information catalysts, strong community support, and robust liquidity, making them the primary focus of capital rotation in this cycle. Conversely, the lower-right quadrant reflects cases of “volume expansion without price follow-through,” indicating weaker market conviction. The broader market remains in a narrative- and event-driven speculative phase, where liquidity flows primarily follow short-term catalysts.
Figure 6: SN64 lies in the upper-right quadrant, showing a strong volume–price resonance driven by AI infrastructure narratives and ecosystem catalysts, while EBTC and AGENTFUN exhibited significant volume growth without corresponding price rebounds.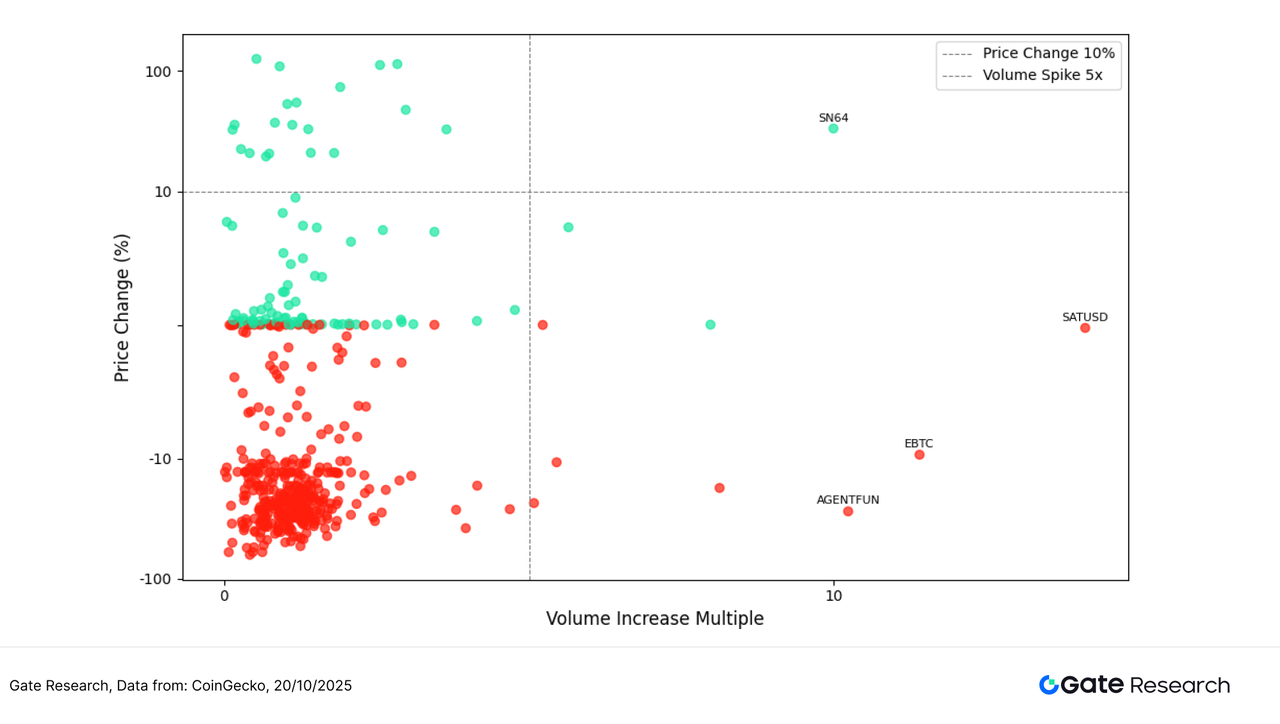
Correlation Analysis
Following the exploration of the relationship between trading volume and price performance, this section further analyzes their systematic correlation from a statistical perspective. To measure how trading activity impacts price volatility, a Relative Activity Indicator — defined as “Volume Growth Rate / Market Cap” — was constructed, and its correlation coefficient with price changes was calculated to identify which types of tokens are most sensitive to capital flows in the current market.
The chart shows that most tokens have correlation coefficients concentrated in the 0.7–0.9 range, indicating a strong positive correlation between volume expansion and price fluctuation. Bubble colors represent correlation intensity (with red indicating stronger and blue weaker correlations), while bubble size reflects each token’s market capitalization.
Among them, XSO, UDS, and C1USD recorded the highest correlation coefficients, nearing 0.9–1.0, suggesting that these mid- to small-cap tokens tend to experience synchronized price movements when trading volume increases — making them typical high-elasticity “volume–price linked” tokens. In contrast, stablecoins such as USDT, TUSD, and FDUSD exhibited relatively lower correlations (around 0.7–0.75), mainly due to their price-pegged nature, which limits volatility. Nonetheless, they continue to play a structural role in liquidity cycles.
Overall, the market displays a clear “correlation stratification”: mid- to small-cap tokens show strong volume–price coupling and higher volatility, while large-cap and stablecoin assets exhibit weaker correlations and greater stability. This pattern indicates that capital currently favors high-elasticity tokens for short-term trading, whereas stablecoins and major assets primarily serve as vehicles for liquidity provision and risk hedging.
Figure 7: XSO, UDS, and other mid- to small-cap tokens show the strongest correlation between trading volume and price movement, reflecting a clear volume–price linkage, while USDT, TUSD, and FDUSD demonstrate lower correlation, indicating a more stable market structure.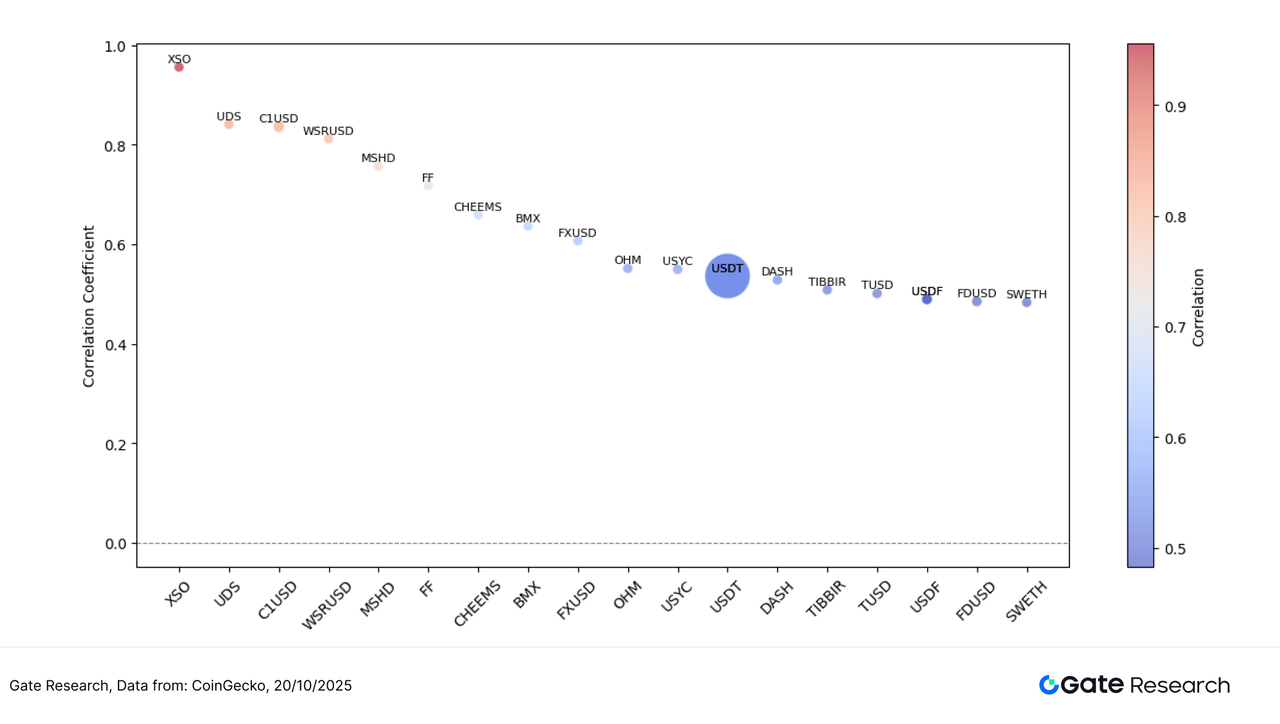
The current crypto market continues to exhibit a structural rotation pattern, with sentiment gradually recovering amid volatility and an increasingly strong correlation between trading volume and price movement. RAIL, COAI, and H, all mid- to small-cap tokens, achieved strong rebounds driven by narrative catalysts and surging trading volumes, becoming focal points for short-term speculative capital. Meanwhile, SN64 gained notable traction as Chutes AI rose to become the top open-source inference provider on OpenRouter, creating clear volume–price resonance. In contrast, EBTC and AGENTFUN, despite significant increases in trading volume, saw weak price performance—indicating that market capital is becoming increasingly concentrated.
Beyond market trading activity, several potential airdrop projects are also progressing steadily across trending areas such as AI modular blockchains, Web3 community incentives, stablecoin deposits, and decentralized node networks. By staying engaged and participating in these projects, users can strategically position themselves to earn token rewards and future airdrop eligibility even amid a volatile market.
Airdrop Highlights
This report highlights several noteworthy airdrop opportunities observed between October 7 and October 20, 2025, including OpenSea (the world’s largest NFT marketplace), Momentum DEX (a decentralized exchange deployed on the Sui network), Gopher (a decentralized AI data infrastructure project built within the Cosmos ecosystem), and Fraction AI (a Web3 platform combining artificial intelligence with NFT creation). Users can participate by connecting wallets, completing on-chain tasks, trading, and staking, thereby accumulating activity records that may qualify them for future token rewards or airdrop distributions.
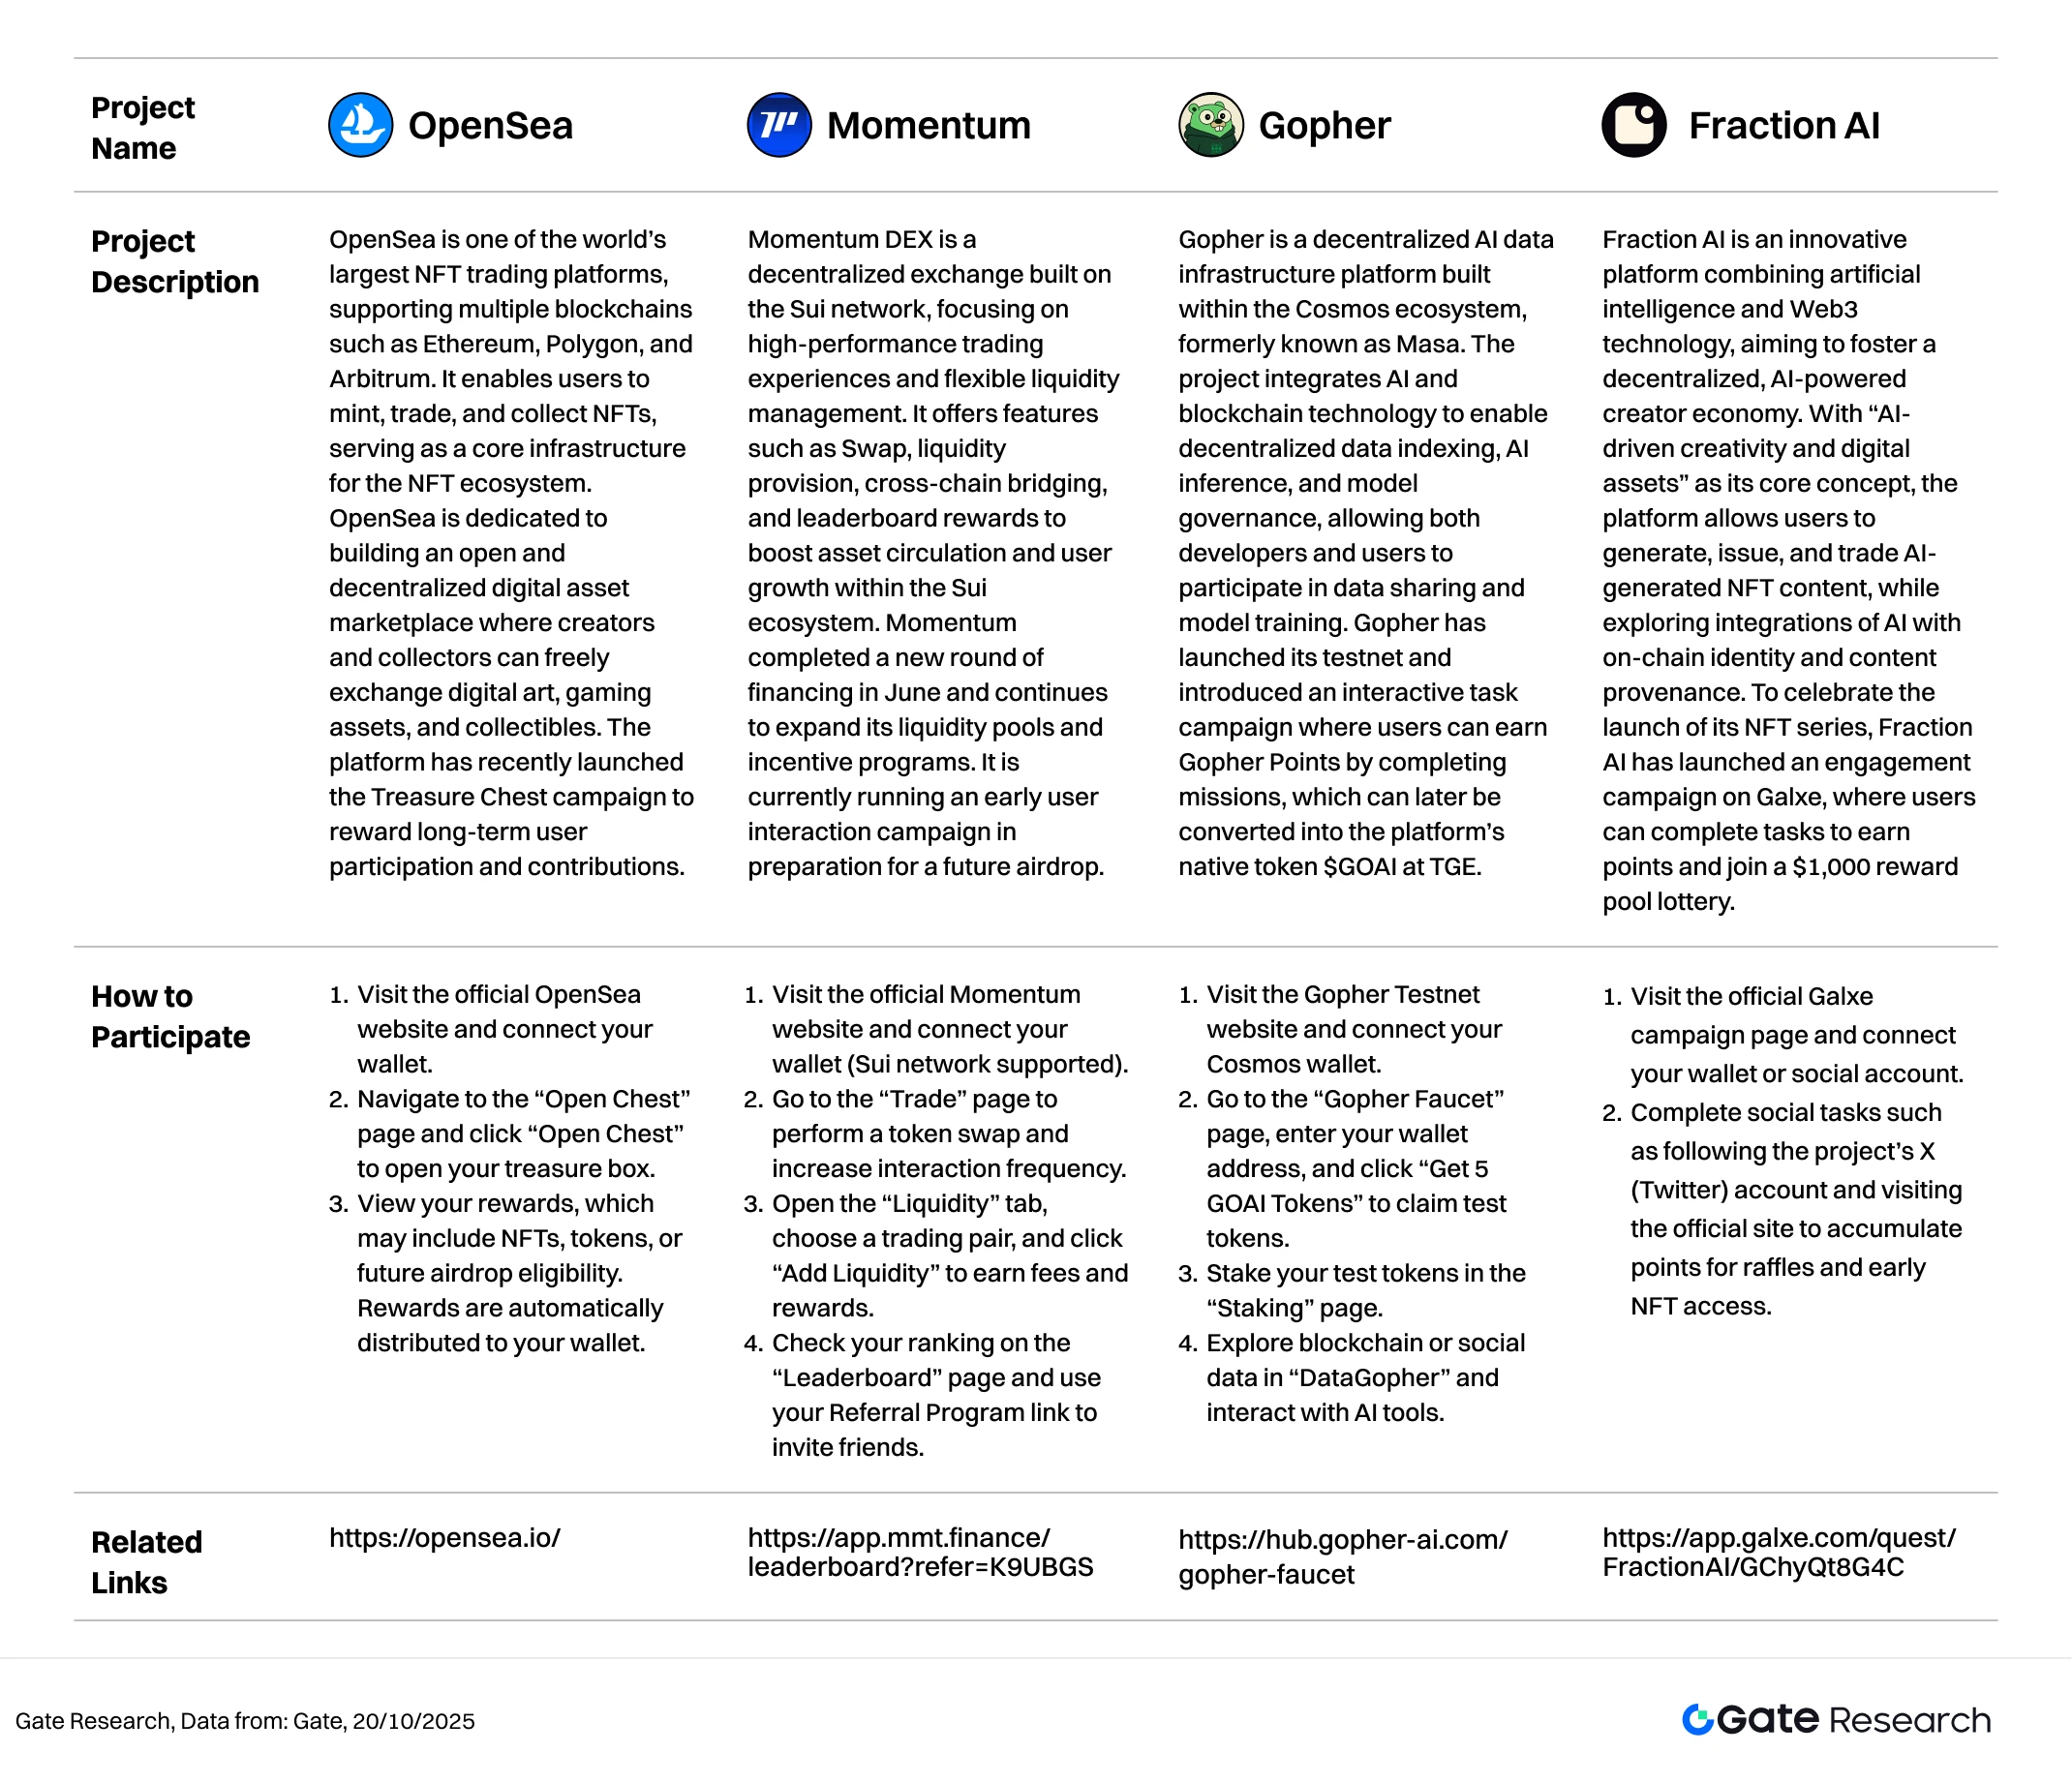
OpenSea
OpenSea is one of the world’s largest NFT trading platforms, supporting multiple blockchains such as Ethereum, Polygon, and Arbitrum. It enables users to mint, trade, and collect NFTs, serving as a core infrastructure for the NFT ecosystem. OpenSea is dedicated to building an open and decentralized digital asset marketplace where creators and collectors can freely exchange digital art, gaming assets, and collectibles. The platform has recently launched the Treasure Chest campaign to reward long-term user participation and contributions.【2】
How to Participate:
- Visit the official OpenSea website and connect your wallet.
- Navigate to the “Open Chest” page and click “Open Chest” to open your treasure box.
- View your rewards, which may include NFTs, tokens, or future airdrop eligibility. Rewards are automatically distributed to your wallet.
Momentum
Momentum DEX is a decentralized exchange built on the Sui network, focusing on high-performance trading experiences and flexible liquidity management. It offers features such as Swap, liquidity provision, cross-chain bridging, and leaderboard rewards to boost asset circulation and user growth within the Sui ecosystem. Momentum completed a new round of financing in June and continues to expand its liquidity pools and incentive programs. It is currently running an early user interaction campaign in preparation for a future airdrop.【3】
How to Participate:
- Visit the official Momentum website and connect your wallet (Sui network supported).
- Go to the “Trade” page to perform a token swap and increase interaction frequency.
- Open the “Liquidity” tab, choose a trading pair, and click “Add Liquidity” to earn fees and rewards.
- Check your ranking on the “Leaderboard” page and use your Referral Program link to invite friends.
Gopher
Gopher is a decentralized AI data infrastructure platform built within the Cosmos ecosystem, formerly known as Masa. The project integrates AI and blockchain technology to enable decentralized data indexing, AI inference, and model governance, allowing both developers and users to participate in data sharing and model training. Gopher has launched its testnet and introduced an interactive task campaign where users can earn Gopher Points by completing missions, which can later be converted into the platform’s native token $GOAI at TGE.【4】
How to Participate:
- Visit the Gopher Testnet website and connect your Cosmos wallet.
- Go to the “Gopher Faucet” page, enter your wallet address, and click “Get 5 GOAI Tokens” to claim test tokens.
- Stake your test tokens in the “Staking” page.
- Explore blockchain or social data in “DataGopher” and interact with AI tools.
Fraction AI
Fraction AI is an innovative platform combining artificial intelligence and Web3 technology, aiming to foster a decentralized, AI-powered creator economy. With “AI-driven creativity and digital assets” as its core concept, the platform allows users to generate, issue, and trade AI-generated NFT content, while exploring integrations of AI with on-chain identity and content provenance. To celebrate the launch of its NFT series, Fraction AI has launched an engagement campaign on Galxe, where users can complete tasks to earn points and join a $1,000 reward pool lottery.【5】
How to Participate:
- Visit the official Galxe campaign page and connect your wallet or social account.
- Complete social tasks such as following the project’s X (Twitter) account and visiting the official site to accumulate points for raffles and early NFT access.
Reminder
Airdrop plans and participation methods are subject to change at any time. Therefore, it is recommended that users follow the official channels of the above projects for the latest updates. Additionally, users should exercise caution, be aware of the risks, and conduct thorough research before participating. Gate does not guarantee the distribution of subsequent airdrop rewards.
Conclusion
Reviewing market performance from October 7 to October 20, 2025, the overall trend continued to follow a “structural rotation + narrative-driven” pattern, with a notable rise in correlation between trading volume and price movements. BTC rebounded after stabilizing at $102,100, while ETH began its upward move from $3,680, providing confidence anchors for the broader market. Among the top 100 tokens by market capitalization, performance remained steady — ZEC and TAO led gains in the privacy and AI sectors, respectively. Meanwhile, mid- to small-cap tokens such as RAIL, COAI, and SN64 surged more than 100%, accompanied by multiple-fold increases in trading volume, making them the primary beneficiaries of this round’s capital rotation.
From a structural perspective, the correlation coefficient between (Volume/Market Cap) and price change clustered between 0.7 and 0.9, highlighting market preference for assets with high activity and strong narratives. In the scatter distribution, tokens with both rising volume and price were concentrated in the upper-right quadrant, reflecting clear structural strength, while stablecoins and major assets remained in the low-correlation zone, maintaining relatively stable trajectories. Overall, the market is in a “theme-led, structurally divergent” phase — with short-term capital rotating across hot sectors, while long-term investors remain on the sidelines, monitoring macro liquidity and technical signals for the next major trend catalyst.
Additionally, the tracked projects — OpenSea, Momentum, Gopher, and Fraction AI — are all in active incentive or engagement phases, focusing respectively on NFT marketplace ecosystems, on-chain DEX trading, AI data networks, and the AI content economy. These ecosystems are complementary in positioning and feature clear incentive paths. Users can participate based on project-specific tasks such as opening treasure chests, adding liquidity, staking test tokens, or completing Galxe social missions to boost point accumulation and potential TGE reward weighting. Continuous attention to official announcements and interaction schedules is recommended to capture airdrop opportunities and early-stage reward windows.
Reference:
- CoinGecko, https://www.coingecko.com/
- OpenSea, https://opensea.io/
- Momentum, https://app.mmt.finance/leaderboard?refer=K9UBGS
- Gopher, https://hub.gopher-ai.com/gopher-faucet
- Fraction AI, https://app.galxe.com/quest/FractionAI/GChyQt8G4C
Gate Research is a comprehensive blockchain and cryptocurrency research platform that provides deep content for readers, including technical analysis, market insights, industry research, trend forecasting, and macroeconomic policy analysis.
Disclaimer
Investing in cryptocurrency markets involves high risk. Users are advised to conduct their own research and fully understand the nature of the assets and products before making any investment decisions. Gate is not responsible for any losses or damages arising from such decisions.
Share
Content


Related Articles
12 Best Sites to Hunt Crypto Airdrops in 2025

Top 20 Crypto Airdrops in 2025

Gate Research: 2024 Cryptocurrency Market Review and 2025 Trend Forecast
Perpetual Contract Funding Rate Arbitrage Strategy in 2025

Gate Research: BTC Breaks $100K Milestone, November Crypto Trading Volume Exceeds $10 Trillion For First Time