2025 Q Price Prediction: Navigating the Future of Digital Asset Valuation
Introduction: Q's Market Position and Investment Value
Quack AI (Q), as the AI-native governance layer for Web3, has transformed fragmented governance into automated, auditable workflows since its inception. As of 2025, Quack AI's market capitalization has reached $22,927,808, with a circulating supply of approximately 1,616,000,000 tokens, and a price hovering around $0.014188. This asset, hailed as the "Web3 Governance Automator," is playing an increasingly crucial role in decentralized decision-making processes for DAOs and RWA projects.
This article will comprehensively analyze Quack AI's price trends from 2025 to 2030, combining historical patterns, market supply and demand, ecosystem development, and macroeconomic factors to provide investors with professional price predictions and practical investment strategies.
I. Q Price History Review and Current Market Status
Q Historical Price Evolution Trajectory
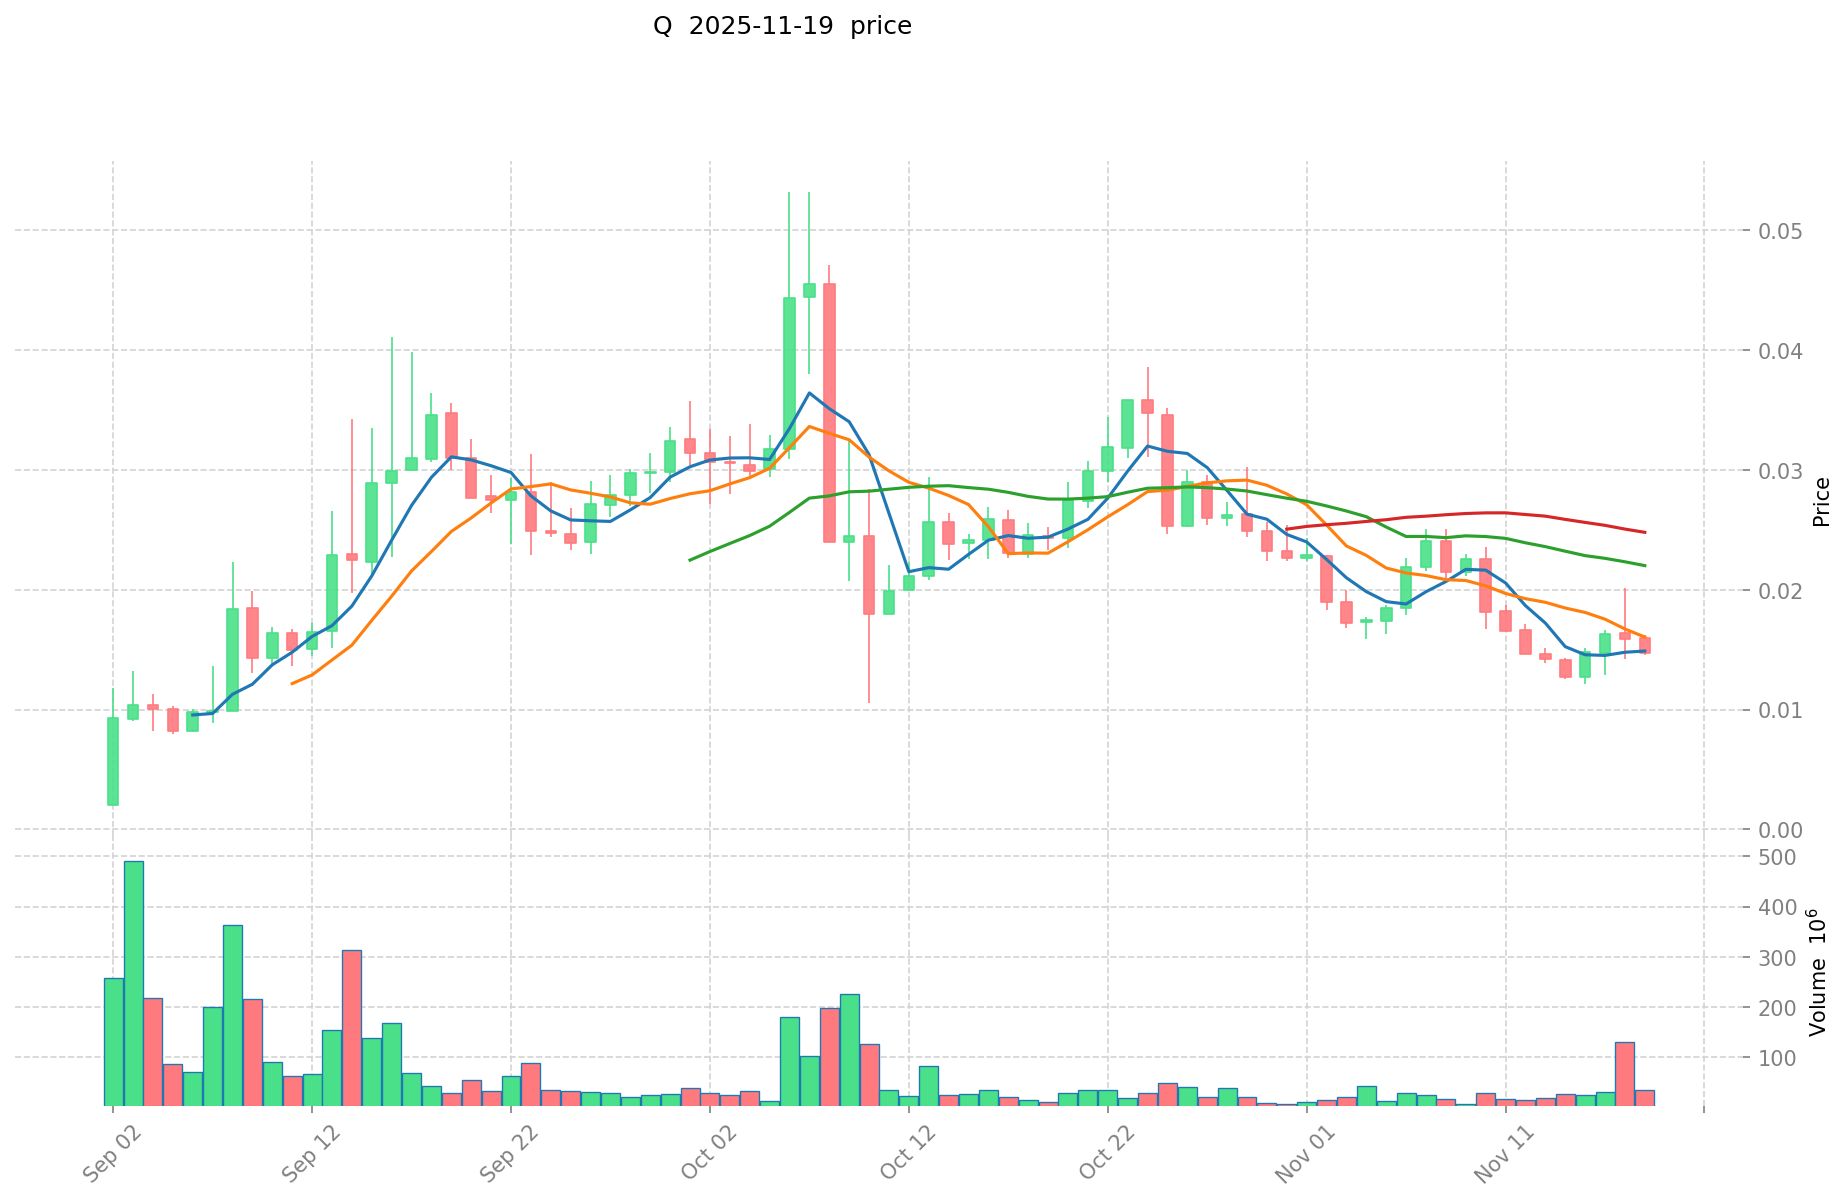
- 2025 September: Initial listing, price started at $0.01
- 2025 October: Reached all-time high of $0.053205
- 2025 November: Market correction, price dropped to current level
Q Current Market Situation
As of November 19, 2025, Q is trading at $0.014188, experiencing a 7.17% decrease in the last 24 hours. The token has seen significant volatility, with a 15.76% decline over the past week and a 43.41% drop in the last 30 days. Q's current market capitalization stands at $22,927,808, ranking 868th in the overall cryptocurrency market. The trading volume in the past 24 hours is $401,416.93, indicating moderate market activity. Despite the recent downtrend, Q is still trading significantly above its all-time low of $0.002, recorded on September 2, 2025.
Click to view the current Q market price
Q Market Sentiment Indicator
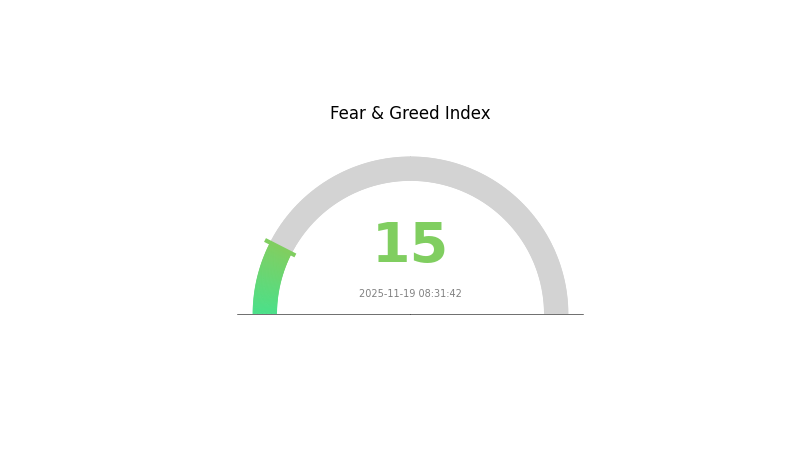
2025-11-19 Fear and Greed Index: 15 (Extreme Fear)
Click to view the current Fear & Greed Index
The crypto market is experiencing a period of extreme fear, with the Fear and Greed Index plummeting to 15. This heightened level of anxiety suggests investors are overly pessimistic, potentially creating opportunities for contrarian traders. However, caution is advised as market sentiment can shift rapidly. Savvy investors may consider dollar-cost averaging or exploring secure storage options like hardware wallets to navigate these uncertain times. As always, thorough research and risk management are crucial in volatile market conditions.
Q Holdings Distribution
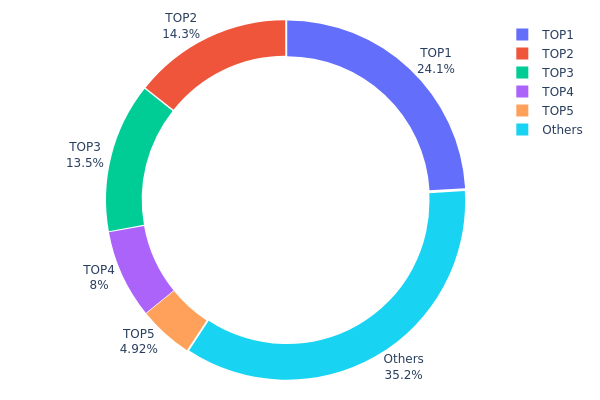
The address holdings distribution chart provides crucial insights into the concentration of Q tokens among different addresses. Analysis of the provided data reveals a significant level of centralization in Q's token distribution. The top 5 addresses collectively hold 64.81% of the total supply, with the largest single address controlling 24.06% of all tokens.
This high concentration of tokens in a few addresses raises concerns about potential market manipulation and price volatility. The top address, holding nearly a quarter of all tokens, could exert substantial influence on market dynamics if it were to engage in large-scale transactions. Furthermore, the cumulative holdings of the top three addresses account for over 50% of the total supply, indicating a significant centralization of power within the Q ecosystem.
While 35.19% of tokens are distributed among other addresses, the current distribution structure suggests a relatively low level of decentralization. This concentration may impact the overall stability of Q's on-chain structure and could potentially lead to increased market volatility or susceptibility to coordinated actions by major token holders.
Click to view the current Q Holdings Distribution
| Top | Address | Holding Qty | Holding (%) |
|---|---|---|---|
| 1 | 0x74d8...633f55 | 1203222.22K | 24.06% |
| 2 | 0x78ac...c2671e | 716666.67K | 14.33% |
| 3 | 0x5214...852638 | 675000.00K | 13.50% |
| 4 | 0x8cac...49cedf | 400000.00K | 8.00% |
| 5 | 0x7084...5a7169 | 246000.00K | 4.92% |
| - | Others | 1759102.61K | 35.19% |
II. Key Factors Affecting Q's Future Price
Macroeconomic Environment
- Monetary Policy Impact: The Bank of England is widely expected to cut interest rates in December due to cooling inflation and sluggish economic growth.
- Inflation Hedging Properties: Core CPI in China has been rising for four consecutive months as of August 2025, supported by above-seasonal increases in medical services and household appliance prices.
- Geopolitical Factors: Global geopolitical tensions are creating an increased "safety demand" which is influencing commodity prices, particularly metals.
Technical Development and Ecosystem Building
- Metal Price Trends: Metal prices are expected to show a sustained wave-like uptrend, mainly due to insufficient global mining capital expenditure in recent years, coupled with rising "safety demand" triggered by geopolitical tensions.
III. Q Price Prediction for 2025-2030
2025 Outlook
- Conservative forecast: $0.01069 - $0.01407
- Neutral forecast: $0.01407 - $0.01674
- Optimistic forecast: $0.01674 - $0.01941 (requires positive market sentiment)
2027 Mid-term Outlook
- Market phase expectation: Potential growth phase
- Price range predictions:
- 2026: $0.01573 - $0.01774
- 2027: $0.01276 - $0.02241
- Key catalysts: Increased adoption and technological advancements
2030 Long-term Outlook
- Base scenario: $0.02338 - $0.02487 (assuming steady market growth)
- Optimistic scenario: $0.02487 - $0.03706 (assuming strong bullish trends)
- Transformative scenario: $0.03706+ (with exceptional market conditions and widespread adoption)
- 2030-12-31: Q $0.03706 (potential peak price)
| 年份 | 预测最高价 | 预测平均价格 | 预测最低价 | 涨跌幅 |
|---|---|---|---|---|
| 2025 | 0.01941 | 0.01407 | 0.01069 | 0 |
| 2026 | 0.01774 | 0.01674 | 0.01573 | 17 |
| 2027 | 0.02241 | 0.01724 | 0.01276 | 21 |
| 2028 | 0.02439 | 0.01983 | 0.01408 | 39 |
| 2029 | 0.02763 | 0.02211 | 0.0126 | 55 |
| 2030 | 0.03706 | 0.02487 | 0.02338 | 75 |
IV. Professional Investment Strategies and Risk Management for Q
Q Investment Methodology
(1) Long-term Holding Strategy
- Suitable for: Risk-tolerant investors with a long-term outlook
- Operational suggestions:
- Accumulate Q tokens during market dips
- Set price targets and gradually take profits
- Store tokens in secure wallets with private key control
(2) Active Trading Strategy
- Technical analysis tools:
- Moving Averages: Identify trend directions and potential reversal points
- Relative Strength Index (RSI): Gauge overbought/oversold conditions
- Key points for swing trading:
- Monitor trading volume for trend confirmation
- Use stop-loss orders to manage downside risk
Q Risk Management Framework
(1) Asset Allocation Principles
- Conservative investors: 1-3% of crypto portfolio
- Aggressive investors: 5-10% of crypto portfolio
- Professional investors: Up to 15% of crypto portfolio
(2) Risk Hedging Solutions
- Diversification: Spread investments across multiple crypto assets
- Stop-loss orders: Implement to limit potential losses
(3) Secure Storage Solutions
- Hardware wallet recommendation: Gate Web3 Wallet
- Cold storage solution: Paper wallet for long-term holding
- Security precautions: Enable two-factor authentication, use strong passwords
V. Potential Risks and Challenges for Q
Q Market Risks
- High volatility: Significant price fluctuations common in crypto markets
- Limited liquidity: Potential difficulties in executing large trades
- Market sentiment: Susceptible to rapid shifts based on news or trends
Q Regulatory Risks
- Uncertain regulatory environment: Potential for new regulations affecting Q
- Cross-border compliance: Varying legal status in different jurisdictions
- Taxation complexities: Evolving tax treatment of crypto assets
Q Technical Risks
- Smart contract vulnerabilities: Potential for exploits or bugs
- Blockchain scalability: Possible network congestion issues
- Technological obsolescence: Risk of being outpaced by newer projects
VI. Conclusion and Action Recommendations
Q Investment Value Assessment
Q presents an innovative approach to AI-driven governance in Web3, offering long-term potential in the evolving DAO ecosystem. However, it faces short-term risks due to market volatility and regulatory uncertainties.
Q Investment Recommendations
✅ Beginners: Start with small positions, focus on education and understanding the technology ✅ Experienced investors: Consider allocating a portion of the crypto portfolio, monitor project developments closely ✅ Institutional investors: Conduct thorough due diligence, potentially engage in governance participation
Q Trading Participation Methods
- Spot trading: Buy and hold Q tokens on reputable exchanges
- Staking: Participate in governance and earn rewards if available
- Dollar-cost averaging: Regular small purchases to mitigate volatility risk
Cryptocurrency investments carry extremely high risks, and this article does not constitute investment advice. Investors should make decisions carefully based on their own risk tolerance and are advised to consult professional financial advisors. Never invest more than you can afford to lose.
FAQ
Will QNT reach $1000?
Yes, QNT is projected to reach $1000 by 2035. Long-term trends and market analysis suggest strong growth potential for Quant over the next decade.
How much will 1 QNT be worth in 2030?
Based on current projections, 1 QNT could be worth around $75.83 by mid-2030 and approximately $81.94 by the end of 2030.
What is the target price for QCOM in 2025?
Based on analyst consensus as of November 19, 2025, the target price for QCOM in 2025 is $186.94, indicating a potential 0.00% increase from the current price.
Can quant reach $50,000?
While possible, it's highly unlikely. Quant would need extraordinary market growth and adoption to reach $50,000. Current trends don't support this projection.
Share
Content
Introduction: Q's Market Position and Investment Value
I. Q Price History Review and Current Market Status
II. Key Factors Affecting Q's Future Price
III. Q Price Prediction for 2025-2030
IV. Professional Investment Strategies and Risk Management for Q
V. Potential Risks and Challenges for Q
VI. Conclusion and Action Recommendations
FAQ

